Unlocking Redox Dynamics: A Comprehensive Guide to EIS for Sensitive Detection of Bioactive Molecules
This article provides a detailed exploration of Electrochemical Impedance Spectroscopy (EIS) for the detection of redox-active species, a critical technique in biomedical research and drug development.
Unlocking Redox Dynamics: A Comprehensive Guide to EIS for Sensitive Detection of Bioactive Molecules
Abstract
This article provides a detailed exploration of Electrochemical Impedance Spectroscopy (EIS) for the detection of redox-active species, a critical technique in biomedical research and drug development. We begin by establishing the fundamental principles of EIS, explaining how charge transfer resistance relates to redox events at the electrode interface. The guide then progresses to practical methodologies, covering electrode modification, experimental design, and data acquisition for specific applications like biomarker and drug metabolite sensing. A dedicated troubleshooting section addresses common pitfalls, from non-faradaic processes to electrode fouling, offering optimization strategies for enhanced signal-to-noise ratios. Finally, we present a comparative analysis of EIS against other electrochemical techniques (e.g., CV, amperometry), validating its advantages in label-free, real-time monitoring. This resource equips researchers with the knowledge to design, execute, and critically evaluate EIS-based biosensing platforms.
The Core Science: Understanding EIS Fundamentals for Redox Sensing
Theoretical Foundations
Electrochemical Impedance Spectroscopy (EIS) is a powerful, non-destructive analytical technique that probes the interfacial properties of an electrode by applying a small amplitude alternating current (AC) potential perturbation and measuring the resultant current response. Within the context of detecting redox-active species—crucial for biosensing, drug metabolism studies, and pharmaceutical analysis—EIS excels at monitoring binding events or enzymatic reactions that alter the charge transfer resistance (Rct) at the electrode surface.
The core principle involves applying a sinusoidal potential perturbation, ( E(t) = E0 \sin(\omega t) ), where ( E0 ) is the amplitude (typically 5-10 mV to maintain linearity) and ( \omega ) is the angular frequency. The system responds with a current, ( I(t) = I0 \sin(\omega t + \phi) ), phase-shifted by ( \phi ). The complex impedance, ( Z(\omega) ), is defined as: [ Z(\omega) = \frac{E(t)}{I(t)} = Z0 \frac{\sin(\omega t)}{\sin(\omega t + \phi)} = Z' + jZ'' ] where ( Z' ) is the real component (resistive), ( Z'' ) is the negative imaginary component (capacitive), and ( j = \sqrt{-1} ).
Key Quantitative Parameters in Redox Sensing EIS
The following table summarizes the core quantitative parameters derived from EIS data, particularly relevant to redox-active species detection.
Table 1: Key EIS Parameters for Redox-Active Species Detection
| Parameter | Symbol | Typical Range in Sensing | Physical Meaning in Redox Detection |
|---|---|---|---|
| Solution Resistance | ( R_s ) | 10 - 100 Ω | Resistance of the electrolyte. Unaffected by surface events. |
| Charge Transfer Resistance | ( R_{ct} ) | 10² - 10⁶ Ω | Most critical parameter. Resistance to electron transfer across the electrode-electrolyte interface. Increases upon binding of non-redox or insulating species. |
| Double Layer Capacitance | ( C_{dl} ) | 10⁻⁹ - 10⁻⁶ F | Capacitance of the electrode/electrolyte double layer. Changes with surface modification. |
| Warburg Impedance | ( Z_W ) | Variable (Frequency dependent) | Resistance to mass transport (diffusion) of redox species. Significant at low frequencies. |
| Constant Phase Element Exponent | ( n ) | 0.9 - 1.0 (1 = ideal capacitor) | Describes surface roughness/heterogeneity. Deviation from 1 indicates non-ideal capacitive behavior. |
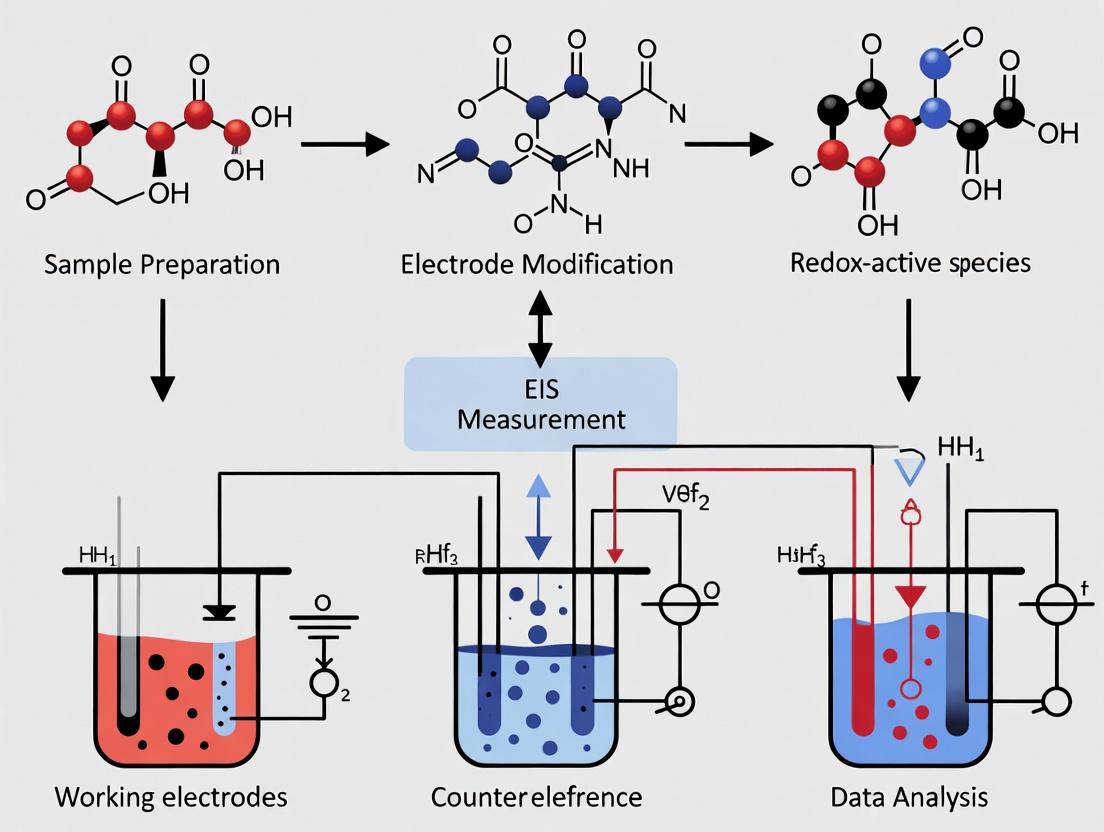
Experimental Protocol: EIS for Aptamer-Based Target Detection
This protocol details a standard experiment for detecting a redox-active species or a binding event using a ferro/ferricyanide (([Fe(CN)_6]^{3-/4-})) redox probe.
Materials & Reagents
- Working Electrode (WE): Gold disk electrode (2 mm diameter).
- Counter Electrode (CE): Platinum wire.
- Reference Electrode (RE): Ag/AgCl (3M KCl).
- Electrolyte/Redox Probe: 5 mM ( K3[Fe(CN)6]/K4[Fe(CN)6] ) (1:1) in 0.1 M PBS (pH 7.4).
- Modification Reagents:
- Thiolated DNA aptamer (e.g., 5'-SH-(CH2)6-...-3').
- 6-Mercapto-1-hexanol (MCH) for backfilling.
- Target analyte (e.g., a specific protein or small molecule drug).
Procedure
Electrode Pretreatment:
- Polish the Au WE successively with 1.0, 0.3, and 0.05 µm alumina slurry on a microcloth. Rinse thoroughly with deionized water.
- Sonicate in ethanol and water for 2 minutes each.
- Electrochemically clean in 0.5 M H2SO4 via cyclic voltammetry (CV) (~20 scans from -0.2 to +1.5 V vs. Ag/AgCl) until a stable CV profile for clean Au is obtained. Rinse with water.
Baseline EIS Measurement:
- Assemble the 3-electrode cell in the redox probe electrolyte.
- Apply the DC bias potential at the formal potential of the redox probe (~+0.22 V vs. Ag/AgCl for ([Fe(CN)_6]^{3-/4-})).
- Perform EIS: Apply a 10 mV RMS AC perturbation across a frequency range of 100 kHz to 0.1 Hz, measuring 10 points per decade. Record the Nyquist plot ((-Z'') vs. (Z')). Fit data to a Randles Equivalent Circuit (Fig. 1) to obtain baseline ( R_{ct}^0 ).
Aptamer Immobilization & Backfilling:
- Incubate the clean Au WE in 1 µM thiolated aptamer solution in PBS overnight at 4°C.
- Rinse with PBS to remove physisorbed strands.
- Incubate in 1 mM MCH solution for 1 hour to displace non-specifically adsorbed aptamers and create a well-organized, charge-blocking monolayer.
Post-Modification EIS Measurement:
- Rinse the modified electrode and place it in fresh redox probe electrolyte.
- Repeat the EIS measurement under identical conditions (Step 2.3). The ( R{ct} ) will increase significantly (( R{ct}^{mod} )) due to the repulsive barrier created by the negatively charged aptamer backbone.
Target Binding & Detection EIS Measurement:
- Incubate the modified electrode in a solution containing the target analyte for a specified time (e.g., 30-60 min).
- Rinse gently to remove unbound target.
- Repeat EIS measurement. Binding of the target (e.g., a protein) often causes a further increase in ( R{ct}^{target} ) due to increased steric hindrance and/or electrostatic blocking of the redox probe. The normalized signal is ( \Delta R{ct}/R{ct}^{mod} = (R{ct}^{target} - R{ct}^{mod}) / R{ct}^{mod} ).
The Scientist's Toolkit: Essential Reagents & Materials
Table 2: Key Research Reagent Solutions for EIS-based Redox Sensing
| Item | Function & Rationale |
|---|---|
| High-Purity Redox Couple (e.g., [Fe(CN)6]3-/4-) | Provides a well-defined, reversible electron transfer reaction to probe interfacial changes. Its accessibility to the surface is modulated by binding events. |
| Thiolated Capture Probes (DNA, RNA, Peptides) | Form a stable, self-assembled monolayer on gold electrodes via Au-S bonds, providing specific binding sites for the target. |
| Backfilling Agent (e.g., 6-Mercapto-1-hexanol - MCH) | Passivates uncovered gold sites, minimizes non-specific adsorption, and forces probe molecules into an upright orientation, enhancing target accessibility. |
| High Ionic Strength Buffer (e.g., PBS with 0.1-1.0 M electrolyte) | Minimizes solution resistance (Rs) and ensures the measured impedance is dominated by interfacial (Rct) processes. Suppresses undesired electrostatic interactions. |
| Charge-Transfer Blocking Reagents (e.g., BSA, Casein) | Used in washing buffers to block remaining non-specific binding sites on the electrode surface, reducing background noise. |
| Potentiostat with FRA (Frequency Response Analyzer) | Instrument that applies the precise DC bias and superimposed AC perturbation, and measures the amplitude and phase shift of the current response across the frequency spectrum. |
Visualization of Core Concepts
Diagram 1: EIS Workflow for Redox Sensing
Diagram 2: Randles Equivalent Circuit Model
This whitepaper serves as a technical guide to the Randles equivalent circuit (REC), the cornerstone model for interpreting electrochemical impedance spectroscopy (EIS) data at electrode interfaces. Within the broader thesis on EIS for Redox-Active Species Detection Principles, the REC is not merely a fitting tool; it is the fundamental framework that decodes the physicochemical narrative of electron transfer, mass transport, and double-layer dynamics. This guide details its components, experimental validation, and application in modern biosensing and drug development research.
Core Components of the Randles Circuit
The REC models a polarized electrode in the presence of a redox couple (e.g., Fe(CN)₆³⁻/⁴⁻, Ru(NH₃)₆³⁺/²⁺). It translates physical interfacial processes into discrete electrical components.
Table 1: Core Components of the Randles Equivalent Circuit
| Circuit Element | Physical Origin | Key Quantitative Relationship |
|---|---|---|
| Solution Resistance (Rₛ) | Ionic resistance of the electrolyte between working and reference electrodes. | Rₛ = ρ * (l/A), where ρ=solution resistivity, l=distance, A=electrode area. |
| Double Layer Capacitance (Cₑₗ) | Dielectric separation of ionic charge in solution from electronic charge in the electrode. | Cₑₗ = (ε₀εᵣ*A)/d, where εᵣ=relative permittivity, d=double-layer thickness. Often modelled as a Constant Phase Element (CPE). |
| Charge Transfer Resistance (Rₜᶜ) | Kinetic barrier to electron transfer for the redox reaction Ox + ne⁻ ⇌ Red. | Rₜᶜ = (RT)/(nF * i₀), where i₀=exchange current density. Inversely proportional to reaction rate. |
| Warburg Impedance (Z𝓌) | Semi-infinite linear diffusion of redox species to/from the electrode surface. | Z𝓌 = σω⁻¹/²(1-j), where σ=Warburg coefficient, ω=angular frequency. |
Experimental Protocols for EIS Characterization
Protocol 1: Baseline Characterization of a Redox Probe
- Objective: Obtain a pristine REC profile for a known redox couple.
- Materials: See Scientist's Toolkit.
- Procedure:
- Prepare a 5 mM K₃[Fe(CN)₆]/K₄[Fe(CN)₆] (1:1) solution in 1x PBS (pH 7.4, 0.1 M supporting electrolyte).
- Using a three-electrode setup, perform cyclic voltammetry (CV) from -0.1 V to +0.5 V vs. Ag/AgCl at 50 mV/s. Verify a reversible redox peak.
- Set the DC potential to the formal potential (E⁰') identified from CV.
- Perform EIS measurement: Apply a sinusoidal AC potential of 10 mV amplitude over a frequency range of 100 kHz to 0.1 Hz.
- Fit the acquired Nyquist plot data to the REC model using non-linear least squares (e.g., in ZView, EC-Lab).
Protocol 2: Monitoring Binding Events (e.g., Antibody-Antigen)
- Objective: Track the increase in Rₜᶜ due to hindered electron transfer upon surface modification.
- Procedure:
- Characterize a functionalized gold electrode (e.g., with self-assembled monolayers (SAMs) and capture antibodies) using Protocol 1.
- Incubate the electrode with the target antigen solution for 30 minutes at 25°C.
- Rinse thoroughly with PBS to remove unbound species.
- Perform EIS under identical conditions as the baseline (Step 1).
- The primary fitting parameter of interest is the increase in Rₜᶜ, which correlates with analyte concentration.
Table 2: Typical EIS Fitting Results for a Fe(CN)₆³⁻/⁴⁻ Probe on Gold
| Electrode State | Rₛ (Ω) | Cₑₗ (CPE, μF*s^(α-1)) | α (CPE exponent) | Rₜᶜ (kΩ) | σ (Ω*s⁻⁰·⁵) |
|---|---|---|---|---|---|
| Bare Gold | 120 ± 5 | 25 ± 3 | 0.95 ± 0.02 | 1.2 ± 0.2 | 750 ± 50 |
| After SAM Formation | 125 ± 5 | 12 ± 2 | 0.90 ± 0.03 | 15.0 ± 1.5 | 800 ± 60 |
| After Antigen Binding | 130 ± 5 | 10 ± 2 | 0.88 ± 0.03 | 45.0 ± 3.0 | 820 ± 60 |
The Scientist's Toolkit: Research Reagent Solutions
Table 3: Essential Materials for REC-Based Experiments
| Item | Function & Rationale |
|---|---|
| Potassium Ferri/Ferrocyanide (K₃[Fe(CN)₆]/K₄[Fe(CN)₆]) | Standard, reversible redox probe for benchmarking electrode kinetics and diffusional properties. |
| Phosphate Buffered Saline (PBS), 0.1 M KCl | Provides a consistent pH and high ionic strength supporting electrolyte to minimize uncompensated Rₛ. |
| 6-Mercapto-1-hexanol (MCH) or similar alkanethiols | Used to form controlled, defect-free SAMs on gold to insulate the electrode and provide functional groups. |
| N-Hydroxysuccinimide (NHS) & Ethylcarbodiimide (EDC) | Carbodiimide crosslinkers for covalent immobilization of biomolecules (e.g., antibodies, DNA) on carboxylated surfaces. |
| Gold Disk Electrode (3 mm diameter) | Standard, well-defined working electrode material for foundational studies. |
| Platinum Counter Electrode | Inert electrode to complete the current circuit. |
| Ag/AgCl (3M KCl) Reference Electrode | Provides a stable, well-defined reference potential for accurate DC bias application. |
| Faradaic Cage | Shields the electrochemical cell from external electromagnetic interference, crucial for low-noise EIS at high frequencies. |
Advanced Considerations: Beyond the Ideal REC
The ideal REC is a starting point. Real-world systems require modifications:
- Constant Phase Element (CPE): Replaces Cₑₗ to account for surface inhomogeneity, roughness, or porosity. Its impedance is Z_CPE = 1/[Q(jω)^α], where 0.9 < α < 1.
- Finite-Length Warburg (O): Replaces Z𝓌 for diffusion within thin films or under hydrogels (bounded diffusion).
- Additional R-C Circuits in Parallel: Model multiple kinetic steps or heterogeneous binding sites.
Fitting these modified circuits to high-quality EIS data allows researchers to deconvolute complex interfacial phenomena, driving advances in sensitive diagnostic platforms and fundamental electrochemistry research within the overarching thesis on EIS detection principles.
Within the broader thesis on Electrochemical Impedance Spectroscopy (EIS) principles for detecting redox-active species, the charge transfer resistance (Rct) emerges as the paramount kinetic parameter. This whitepaper establishes Rct as the central, quantifiable reporter on the facility of electron exchange at an electrode-solution interface. The detection of specific analytes—from metal ions to protein biomarkers—hinges on measurable perturbations to this resistance upon binding or catalytic turnover. Understanding Rct's fundamental relationship with heterogeneous electron transfer (ET) kinetics is therefore critical for designing sensitive, specific, and quantitative EIS biosensors.
Theoretical Foundation: From Butler-Volmer to Rct
The kinetics of a single-step, one-electron redox reaction, O + e⁻ ⇌ R, are described by the Butler-Volmer equation. At equilibrium (zero overpotential), the exchange current density (i₀) is defined. For small overpotentials (typically ≤ 10 mV), the current-potential relationship becomes linear, and the charge transfer resistance is derived as its inverse slope:
Rct = (RT)/(nF i₀)
Where R is the gas constant, T is temperature, n is the number of electrons, and F is Faraday's constant.
Crucially, i₀ is proportional to the standard heterogeneous ET rate constant, k⁰: i₀ = n F A k⁰ C*
Thus, Rct is inversely proportional to k⁰. A high k⁰ (fast kinetics) yields a low Rct, while a low k⁰ (slow, kinetically hindered ET) results in a high Rct. In sensing, any event that modulates k⁰—such as steric blocking by an bound antibody or facilitation by a redox mediator—directly alters the measured Rct.
Table 1: Relationship Between Rct, k⁰, and Kinetic Regime
| Rct Value | k⁰ (cm/s) | Kinetic Regime | Implications for Sensing |
|---|---|---|---|
| Very Low (Ωs) | > 10⁻² | Reversible (Fast) | Ideal for background, sensitive to blocking events. |
| Moderate | 10⁻⁵ – 10⁻² | Quasi-Reversible | Sensitive to both binding and catalytic enhancement. |
| Very High (kΩ-MΩ) | < 10⁻⁵ | Irreversible (Slow) | High background, difficult measurement; large signal gain upon facilitation. |
Experimental Protocol: Extracting Rct via EIS
Objective: To obtain an accurate value of Rct for a redox probe system before and after a sensing event.
Materials: Potentiostat with EIS capability, 3-electrode cell (Working, Counter, Reference), electrolyte solution containing a reversible redox couple (e.g., 5 mM [Fe(CN)₆]³⁻/⁴⁻ in 0.1 M KCl).
Procedure:
- Electrode Preparation: Clean the working electrode (e.g., Au, glassy carbon) per standard protocols (polishing, sonication, electrochemical cycling).
- DC Potential Setup: Perform a cyclic voltammetry (CV) scan in the redox solution. Identify the formal potential (E⁰') of the couple.
- EIS Measurement: Set the potentiostat to EIS mode.
- DC Bias: Apply E⁰' as the DC potential.
- AC Amplitude: 5-10 mV RMS.
- Frequency Range: Typically 100 kHz to 0.1 Hz (or lower). 10 points per decade.
- Data Acquisition: Record impedance (Z) and phase (θ) at each frequency.
- Data Fitting:
- Use an equivalent electrical circuit (EEC) model.
- The Randles Circuit is standard for simple interfaces: Rs(CPE[RctW]).
- Rs: Solution resistance.
- CPE: Constant Phase Element (models double-layer capacitance).
- Rct: Charge Transfer Resistance (the parameter of interest).
- W: Warburg element (models semi-infinite linear diffusion).
- Fit the recorded impedance spectrum to the model using non-linear least squares software to extract the value of Rct with confidence intervals.
Rct as a Reporter in Sensing Modalities
4.1. Label-Free, "Blocking" Assays: Target binding (e.g., antigen-antibody) forms an insulating layer, increasing the effective electron transfer distance, decreasing k⁰, and increasing Rct.
4.2. Redox-Mediated, "Facilitation" Assays: An enzyme label (e.g., horseradish peroxidase) generates a soluble mediator that shuttles electrons to the electrode, increasing effective k⁰ and causing a decrease in Rct.
The Scientist's Toolkit: Essential Reagents & Materials
Table 2: Key Research Reagent Solutions for Rct-Based EIS Studies
| Item | Function/Explanation |
|---|---|
| Redox Probe (e.g., [Fe(CN)₆]³⁻/⁴⁻, [Ru(NH₃)₆]³⁺) | Provides a reversible, solution-based electron transfer pathway to benchmark interface kinetics. |
| High-Purity Supporting Electrolyte (e.g., KCl, PBS) | Carries ionic current, minimizes solution resistance (Rs), and controls ionic strength. |
| Self-Assembled Monolayer (SAM) Reagents (e.g., 6-mercapto-1-hexanol, carboxy-alkanethiols) | Creates a well-defined, tunable interface for biomolecule immobilization and kinetic control. |
| Redox Mediators (e.g., TMB, HQ, [Os(bpy)₃]²⁺) | Electron shuttles for enzyme-linked or catalytic assays, modulating Rct. |
| Blocking Agents (e.g., BSA, casein, ethanolamine) | Passivates non-specific binding sites to ensure Rct changes are specific to target binding. |
| Electrode Polish (Alumina or diamond slurry) | Maintains a reproducible, clean electrode surface geometry, critical for consistent Rct measurement. |
Visualization of Core Concepts
Title: Rct's Role in the EIS Detection Thesis
Title: Experimental Workflow to Extract Rct from EIS
Title: Two Pathways by Which Sensing Events Modulate Rct
What Makes a Species 'Redox-Active'? Relevance to Biomarkers, Drugs, and Metabolites.
Defining Redox-Activity: An Electrochemical Perspective
A species is termed 'redox-active' if it can participate in reduction-oxidation (redox) reactions, involving the transfer of electrons between chemical entities. In an electrochemical context, this translates to the species undergoing a reversible or quasi-reversible electron transfer at an electrode surface within the accessible potential window of the solvent/electrolyte system. This electron transfer generates a measurable Faradaic current, the fundamental principle exploited in techniques like cyclic voltammetry (CV) and Electrochemical Impedance Spectroscopy (EIS).
The redox-activity of a molecule is governed by its molecular orbital energetics. A small energy gap between the highest occupied molecular orbital (HOMO) and the lowest unoccupied molecular orbital (LUMO) facilitates electron addition or removal. Key structural motifs that confer redox-activity include:
- Conjugated π-systems (e.g., quinones, flavins, polyaromatic hydrocarbons).
- Metal ion centers with multiple stable oxidation states (e.g., Fe²⁺/Fe³⁺, Cu⁺/Cu²⁺).
- Specific functional groups like thiols/disulfides, phenols, and amines.
Relevance to Biomarkers, Drugs, and Metabolites
The redox-activity of biomolecules is central to both physiology and pathology, making it a critical property for detection and intervention.
Biomarkers: Many disease biomarkers are inherently redox-active. Reactive oxygen/nitrogen species (ROS/RNS), neurotransmitter metabolites (e.g., homovanillic acid), and markers of oxidative stress (e.g., glutathione ratio, ascorbate) are direct electrochemical targets. Their detection via EIS-based biosensors offers rapid, point-of-care diagnostics.
Drugs: A vast array of pharmaceuticals are redox-active. Chemotherapeutic agents (e.g., doxorubicin), antibiotics (e.g., metronidazole), and psychotropic drugs (e.g., chlorpromazine) contain electroactive moieties. Electroanalysis is crucial for drug development (studying metabolic stability), quality control (assay of active ingredient), and therapeutic drug monitoring.
Metabolites: Metabolic pathways are replete with redox reactions. Key metabolites like NADH/NAD⁺, FADH₂/FAD, and cytochrome c are electroactive. Monitoring their concentration changes electrochemically provides a direct window into cellular metabolic state and mitochondrial function.
Electrochemical Impedance Spectroscopy (EIS) for Detection
Within the thesis context of EIS for redox-active species detection, the principle hinges on monitoring changes in the electrode-solution interface upon redox cycling. A redox-active species, when its formal potential is within the applied bias window, can shuttle electrons, reducing the interfacial impedance. EIS excels at tracking this charge transfer resistance (R_ct), a parameter highly sensitive to the presence and concentration of the redox probe.
For a species to be effectively detected by a label-free, direct EIS method, it typically must be reversibly redox-active under the experimental conditions. Alternatively, a competitive or binding assay can be designed where the target analyte displaces or modulates the activity of a known redox probe (e.g., ferri/ferrocyanide).
Quantitative Data on Representative Redox-Active Species
Table 1: Electrochemical Parameters of Key Redox-Active Biomolecules
| Species | Category | Formal Potential (E°) vs. Ag/AgCl (approx.) | Relevance |
|---|---|---|---|
| Dopamine | Neurotransmitter | +0.15 V | Biomarker for neurological disorders. |
| Ascorbic Acid | Antioxidant | -0.05 V (pH 7.0) | Marker of oxidative stress. |
| Uric Acid | Metabolic Waste | +0.25 V | Biomarker for gout, renal function. |
| Glutathione (Reduced) | Antioxidant | +0.45 V (oxidation of -SH) | Central redox buffer in cells. |
| Potassium Ferricyanide | Probe | +0.18 V | Standard redox probe for EIS and CV. |
| Metronidazole | Antibiotic Drug | -0.45 V | Electroanalysis for dosage determination. |
| NADH | Coenzyme | +0.45 V (oxidation) | Key indicator of metabolic activity. |
| H₂O₂ | ROS | Variable (depends on catalyst) | Direct biomarker of oxidative stress. |
Experimental Protocols for Characterization and Detection
Protocol 1: Cyclic Voltammetry for Determining Redox-Activity Objective: To confirm redox-activity and determine formal potential (E°) of a species. Method:
- Prepare a 1-5 mM solution of the analyte in a suitable buffer (e.g., 0.1 M PBS, pH 7.4) with 0.1 M supporting electrolyte (e.g., KCl).
- Use a standard three-electrode system: Glassy Carbon working electrode, Pt wire counter electrode, Ag/AgCl reference electrode.
- Polish the working electrode with 0.05 µm alumina slurry, rinse with DI water, and dry.
- Deoxygenate the solution by purging with inert gas (N₂ or Ar) for 10-15 minutes.
- Run CV from a starting potential negative of the expected reduction, scanning positively, then reversing. Common scan range: -0.8 V to +0.8 V. Scan rate: 50-100 mV/s.
- Identify peaks. A reversible system shows symmetric oxidation and reduction peaks. Calculate E° as (Epa + Epc)/2.
Protocol 2: Label-Free EIS Detection of a Redox-Active Biomarker Objective: To quantify a redox-active biomarker (e.g., uric acid) by monitoring charge transfer resistance. Method:
- Prepare a redox probe solution (e.g., 5 mM K₃[Fe(CN)₆]/K₄[Fe(CN)₆] in 0.1 M PBS).
- Set up the same three-electrode system as in Protocol 1.
- Apply a DC bias potential equal to the formal potential of the probe (+0.18 V for ferri/ferrocyanide).
- Apply a small AC perturbation (e.g., 10 mV RMS) over a frequency range from 100 kHz to 0.1 Hz. Record the impedance spectrum (Nyquist plot).
- Fit the data to a modified Randles equivalent circuit to extract the charge transfer resistance (R_ct).
- Add increasing concentrations of the analyte (uric acid) to the solution. As the redox-active analyte participates in electron transfer, it facilitates charge transfer, decreasing Rct. Construct a calibration curve of ΔRct vs. log(concentration).
Visualization: Pathways and Workflows
Title: EIS Detection Workflow for a Redox-Active Analyte
Title: Structural Motifs Conferring Redox-Activity
The Scientist's Toolkit: Key Research Reagent Solutions
Table 2: Essential Materials for Redox-Activity Experiments
| Item | Function/Benefit |
|---|---|
| Glassy Carbon Electrode | Standard working electrode with wide potential window and good chemical inertness for CV/EIS. |
| Ag/AgCl (3M KCl) Reference Electrode | Provides a stable, reproducible reference potential for accurate potential control. |
| Potassium Ferri-/Ferrocyanide | Benchmark reversible redox couple for electrode characterization and as a probe in EIS assays. |
| Phosphate Buffered Saline (PBS) | Standard physiological buffer (e.g., 0.1 M, pH 7.4) for biomolecule studies. |
| Alumina Polishing Suspension (0.05 µm) | For reproducible renewal and cleaning of solid electrode surfaces. |
| Nafion Perfluorinated Resin | Cation-exchange polymer used to coat electrodes, often to selectively preconcentrate cationic analytes (e.g., neurotransmitters). |
| High-Purity Inert Gas (Ar/N₂) | For deoxygenating electrochemical solutions to prevent interference from O₂ reduction. |
| Electrochemical Impedance Analyzer | Instrument capable of applying a small sinusoidal AC potential and measuring the phase and magnitude of the current response. |
| Faradaic Equivalent Circuit Fitting Software | Essential for modeling EIS data (e.g., using a Randles circuit) to extract quantitative parameters like R_ct. |
This technical whitepaper, framed within a broader thesis on Electrochemical Impedance Spectroscopy (EIS) principles for detecting redox-active species, elucidates three cardinal advantages of the technique. EIS provides a powerful framework for biosensing and interfacial characterization by enabling label-free analytical measurements, imposing minimal perturbation on the system under study, and facilitating real-time, kinetic monitoring of dynamic processes. This guide delves into the technical foundations, experimental protocols, and current applications of these advantages, particularly for researchers in biosensor development and drug discovery.
Technical Foundations of EIS Advantages
Electrochemical Impedance Spectroscopy measures the complex resistance of an electrochemical cell to a small-amplitude applied AC potential across a range of frequencies. The resultant Nyquist or Bode plots provide a fingerprint of interfacial properties.
Label-Free Detection: EIS transduces biorecognition events (e.g., antibody-antigen binding, DNA hybridization) directly into measurable changes in electrical parameters (charge transfer resistance, Rct, or capacitance), eliminating the need for fluorescent, enzymatic, or radioactive labels.
Minimal Sample Perturbation: The application of a small excitation signal (typically 5-10 mV) ensures the system remains in a pseudo-linear steady state, preventing faradaic currents that could degrade analytes or modify the electrode interface irreversibly.
Real-Time Monitoring: By acquiring impedance spectra at defined time intervals, EIS can track the evolution of an interfacial process, such as cell adhesion, protein adsorption, or corrosion, in a continuous, non-invasive manner.
The following tables consolidate key performance metrics from recent research leveraging these EIS advantages.
Table 1: Comparison of Label-Free EIS Biosensor Performance for Various Analytes
| Target Analyte | Sensor Platform | Limit of Detection (LOD) | Dynamic Range | Key Impedance Parameter | Ref. Year |
|---|---|---|---|---|---|
| C-Reactive Protein | Anti-CRP/Au electrode | 0.1 pg/mL | 0.1 pg/mL - 100 ng/mL | ΔRct | 2023 |
| miRNA-21 | PNA capture probe/GO modified SPCE | 0.3 fM | 1 fM - 10 nM | ΔRct | 2024 |
| SARS-CoV-2 Spike | Aptamer/Au interdigitated electrode | 1 fg/mL | 1 fg/mL - 1 ng/mL | ΔZ at 10 Hz | 2023 |
| Dopamine | MnO2 nanoflower/GCE | 12 nM | 0.05 - 100 µM | ΔRct | 2024 |
Table 2: Real-Time Monitoring Data for Cell Proliferation Using EIS
| Cell Line | Electrode | Time Interval | Measured Parameter | Correlation with Standard Assay (R²) | Monitoring Duration |
|---|---|---|---|---|---|
| MCF-7 (Breast Cancer) | 8-well ECIS array | 60 sec | Normalized Cell Index (from Rb) | 0.98 vs. MTT assay | 72 hours |
| HEK293 | ITO interdigitated | 15 min | Barrier Resistance (Rb) | 0.96 vs. Cell counting | 48 hours |
| MDCK | Gold-film electrode | 30 sec | Trans-epithelial Resistance | N/A (continuous) | 96 hours |
Detailed Experimental Protocols
Protocol 1: Label-Free Aptasensor for Protein Detection
Objective: To fabricate and characterize an EIS-based aptasensor for the detection of a target protein (e.g., thrombin).
Materials: Gold disk electrode (3 mm diameter), thiolated aptamer, 6-mercapto-1-hexanol (MCH), potassium ferricyanide/ferrocyanide ([Fe(CN)₆]³⁻/⁴⁻), phosphate buffer saline (PBS).
Procedure:
- Electrode Pretreatment: Polish the Au electrode with 0.3 and 0.05 µm alumina slurry. Clean via sonication in ethanol and water. Electrochemically clean in 0.5 M H₂SO₄ by cyclic voltammetry.
- Aptamer Immobilization: Incubate the electrode in 1 µM thiolated aptamer solution in PBS overnight at 4°C. This forms a self-assembled monolayer (SAM) via Au-S bonds.
- Backfilling: Rinse electrode and incubate in 1 mM MCH solution for 1 hour to passivate uncovered gold sites and orient the aptamer.
- Baseline EIS Measurement: Perform EIS in a solution of 5 mM [Fe(CN)₆]³⁻/⁴⁻ in 0.1 M PBS (pH 7.4). Apply a DC potential equal to the formal potential of the redox probe (typically ~0.22 V vs Ag/AgCl) with a 10 mV AC amplitude, scanning from 10⁵ Hz to 0.1 Hz.
- Target Incubation & Measurement: Incubate the modified electrode in sample containing the target protein for 30 minutes. Rinse thoroughly and record a new EIS spectrum in the same redox probe solution.
- Data Analysis: Fit spectra to a modified Randles equivalent circuit. The increase in charge transfer resistance (Rct) is proportional to target concentration.
Protocol 2: Real-Time Monitoring of Bacterial Biofilm Formation
Objective: To monitor the kinetic growth of Pseudomonas aeruginosa biofilm using time-lapse EIS.
Materials: Polystyrene cell culture well with integrated indium tin oxide (ITO) electrodes, Luria-Bertani (LB) broth, bacterial strain.
Procedure:
- Setup: Place the electrode array in a sterile culture well. Connect to an impedance analyzer within a biosafety cabinet.
- Baseline: Add sterile LB broth to the well and record impedance spectra (10⁴ Hz to 10 Hz) every 5 minutes for 1 hour to establish a stable baseline.
- Inoculation: Inoculate the well with bacteria to a final concentration of ~10⁵ CFU/mL.
- Continuous Monitoring: Record impedance spectra at 5-minute intervals for 24-48 hours. Maintain constant temperature (37°C).
- Analysis: Plot the impedance modulus at a characteristic frequency (e.g., 100 Hz) versus time. The increase correlates with biofilm accumulation and insulating properties.
Visualizations
The Scientist's Toolkit: Key Research Reagent Solutions
Table 3: Essential Materials for EIS-based Redox-Active Species Detection
| Item | Function/Description | Example Product/Catalog |
|---|---|---|
| Redox Probe | Provides a reversible faradaic couple to monitor interfacial changes. Most common is [Fe(CN)₆]³⁻/⁴⁻. | Potassium Hexacyanoferrate(III), Sigma 244023 |
| Self-Assembled Monolayer (SAM) Reagents | Alkanethiols (e.g., MCH) for backfilling and controlling probe orientation on gold electrodes. | 6-Mercapto-1-hexanol, Sigma 451472 |
| Blocking Agents | Proteins (BSA, casein) or surfactant solutions to minimize non-specific binding on sensor surfaces. | Bovine Serum Albumin (Fraction V), Thermo 37525 |
| Electrode Polishing Kits | Alumina or diamond suspensions for renewing and planarizing solid electrode surfaces. | Buehler Alumina MicroPolish (0.3 & 0.05 µm) |
| Bifunctional Crosslinkers | For covalent immobilization of probes on non-gold surfaces (e.g., carbon, ITO). E.g., EDAC/NHS chemistry. | N-(3-Dimethylaminopropyl)-N'-ethylcarbodiimide (EDAC), Sigma 03449 |
| Validated Equivalent Circuit Software | Essential for modeling and extracting quantitative parameters from impedance spectra. | ZView (Scribner Assoc.), EC-Lab (BioLogic) |
| Multi-Well EIS Arrays | Integrated electrode plates for high-throughput or cell culture real-time monitoring. | Applied Biophysics ECIS 8W10E plates |
| Stable Reference Electrodes | Provides a constant potential reference. Ag/AgCl (with KCl electrolyte) is standard. | BASi MF-2052 Ag/AgCl Reference Electrode |
From Theory to Bench: Designing and Executing EIS Biosensing Experiments
This technical guide examines electrode selection and surface modification within the broader thesis context of Electrochemical Impedance Spectroscopy (EIS) for detecting redox-active species. The choice of electrode material and its subsequent functionalization are critical determinants of sensor sensitivity, selectivity, and stability. Gold electrodes and Screen-Printed Electrodes (SPEs) represent two dominant platforms, each with distinct advantages and functionalization pathways. This whitepaper provides an in-depth analysis of these materials and the strategies used to tailor their surfaces for specific applications in biosensing and drug development research.
Core Electrode Platforms: Gold vs. Screen-Printed Electrodes (SPEs)
The selection between bulk gold electrodes and disposable SPEs involves a trade-off between performance, cost, and application requirements.
Gold Electrodes: Offer excellent conductivity, chemical inertness, and a well-established chemistry for forming self-assembled monolayers (SAMs) via gold-thiol bonds. They are the standard for high-precision, laboratory-based EIS measurements due to their reliable, renewable surface.
Screen-Printed Electrodes (SPEs): Typically consist of a three-electrode system (working, counter, reference) printed on a plastic or ceramic substrate. The working electrode is often carbon-based (carbon ink, graphene) or gold. SPEs provide a low-cost, portable, and single-use platform ideal for point-of-care testing and high-throughput screening, though with potentially higher batch-to-batch variability.
Table 1: Comparison of Gold Electrodes and Screen-Printed Electrodes (SPEs)
| Parameter | Bulk Gold Electrode | Screen-Printed Gold Electrode | Carbon-Based SPE |
|---|---|---|---|
| Fabrication | Polished disk or rod | Printed gold ink on substrate | Printed carbon/graphene ink |
| Cost per unit | High (reusable) | Low to Medium (disposable) | Very Low (disposable) |
| Surface Renewal | Mechanical/electrochemical polishing | Not typically renewed | Not typically renewed |
| Functionalization | Well-defined SAM chemistry | SAM chemistry possible | Rich carbon chemistry (EDC/NHS, diazonium, π-π stacking) |
| Best for | Fundamental studies, high-precision lab measurement | Portable, disposable biosensors | Low-cost, mass-produced sensors |
| Typical EIS Charge Transfer Resistance (Rct) Range (bare) | 100 - 500 Ω | 500 - 2000 Ω | 1 - 10 kΩ |
Functionalization Strategies for Biosensor Development
Functionalization bridges the inorganic electrode surface and the biological recognition element (e.g., antibody, DNA, enzyme). The strategy must ensure proper orientation and activity of the bioreceptor while minimizing non-specific binding.
Gold Surface Modification via Self-Assembled Monolayers (SAMs)
The formation of alkanethiol SAMs is the cornerstone of gold electrode functionalization.
Protocol: Formation of a Mixed SAM on Gold for EIS Biosensing
- Electrode Pretreatment: Polish the gold electrode sequentially with 1.0, 0.3, and 0.05 µm alumina slurry on a microcloth pad. Rinse thoroughly with deionized water.
- Electrochemical Cleaning: Perform cyclic voltammetry (CV) in 0.5 M H₂SO₄ from -0.1 V to +1.5 V (vs. Ag/AgCl) at 100 mV/s until a stable CV profile is obtained. Rinse with water and ethanol.
- SAM Formation: Immerse the clean, dry gold electrode in a 1 mM ethanolic solution containing a mixture of a functional thiol (e.g., 11-mercaptoundecanoic acid, MUA) and a diluent thiol (e.g., 6-mercapto-1-hexanol, MCH) at a molar ratio (typically 1:3 to 1:10) for 12-18 hours at room temperature.
- Rinsing: Remove the electrode and rinse copiously with absolute ethanol to remove physisorbed molecules.
- Activation (for carboxyl-terminated SAM): Immerse the electrode in a solution containing 75 mM N-hydroxysuccinimide (NHS) and 15 mM 1-ethyl-3-(3-dimethylaminopropyl)carbodiimide (EDC) in MES buffer (pH 5.5-6.0) for 30-60 minutes to activate the carboxyl groups to NHS esters.
- Bioreceptor Immobilization: Immediately transfer the electrode to a solution containing the target bioreceptor (e.g., 10-50 µg/mL antibody in PBS, pH 7.4) for 1-2 hours. The amine groups on the bioreceptor react with the NHS esters.
- Quenching/Blocking: Immerse the electrode in a 1 M ethanolamine solution (pH 8.5) for 15-30 minutes to deactivate any remaining activated esters. Then, incubate in a blocking agent (e.g., 1% Bovine Serum Albumin (BSA) in PBS) for 30 minutes to minimize non-specific binding.
SPE Surface Modification Strategies
Functionalization of SPEs depends on the working electrode material.
For Gold-SPEs: The SAM protocol above can be applied, though pretreatment may involve simpler electrochemical cycling in sulfuric acid or KCl.
For Carbon-SPEs: A common strategy is surface oxidation followed by carbodiimide chemistry.
- Surface Activation: Electrochemically oxidize the carbon surface by CV in 0.1 M PBS (pH 7.4) from -0.5 V to +1.5 V for 5-10 cycles to generate oxygen-containing groups (carboxyl, hydroxyl).
- Carboxyl Activation: Apply the EDC/NHS activation solution (as in Step 5 above) directly to the electrode surface for 20-30 minutes.
- Bioreceptor Immobilization & Blocking: Follow Steps 6 and 7 from the gold protocol.
Table 2: Common Functionalization Reagents and Their Roles
| Reagent | Chemical Class/Type | Primary Function in Functionalization |
|---|---|---|
| 11-Mercaptoundecanoic acid (MUA) | Alkanethiol | Forms SAM on gold; provides terminal carboxyl group for covalent linkage. |
| 6-Mercapto-1-hexanol (MCH) | Alkanethiol | Diluent thiol in mixed SAMs to create spacing, reduce non-specific binding, and improve bioreceptor orientation. |
| 1-ethyl-3-(3-dimethylaminopropyl)carbodiimide (EDC) | Carbodiimide | Activates carboxyl groups to form reactive O-acylisourea intermediates for amine coupling. |
| N-hydroxysuccinimide (NHS) | NHS ester | Stabilizes the EDC-activated intermediate, forming an amine-reactive NHS ester with higher efficiency. |
| Ethanolamine | Small amine compound | Quenches/unreacted NHS esters after immobilization to prevent unwanted coupling. |
| Bovine Serum Albumin (BSA) | Protein | Universal blocking agent to occupy remaining non-specific binding sites on the sensor surface. |
| Poly-L-lysine | Cationic polymer | Used on negatively charged surfaces (e.g., oxidized carbon) for electrostatic adsorption of biomolecules. |
| Glutaraldehyde | Bifunctional crosslinker | Crosslinks amine-containing layers (e.g., poly-L-lysine coatings) for stable immobilization. |
EIS Measurement of Redox-Active Species Detection
The principle of label-free EIS detection relies on monitoring the change in charge transfer resistance (Rct) of a redox probe (e.g., [Fe(CN)₆]³⁻/⁴⁻) at the electrode/solution interface as biomolecular binding events occur.
Protocol: EIS Measurement for a Functionalized Biosensor
- Redox Probe Solution: Prepare a 5 mM solution of K₃[Fe(CN)₆]/K₄[Fe(CN)₆] (1:1 mixture) in a suitable electrolyte (e.g., 0.1 M PBS, pH 7.4, with 0.1 M KCl).
- Instrument Setup: Configure the potentiostat for EIS. Apply a DC potential equal to the formal potential of the redox probe (typically ~+0.22 V vs. Ag/AgCl for [Fe(CN)₆]³⁻/⁴⁻). Superimpose an AC sinusoidal voltage with an amplitude of 5-10 mV.
- Frequency Scan: Measure impedance over a frequency range from 100 kHz to 0.1 Hz, collecting 30-50 data points per decade.
- Measurement Sequence: Perform EIS on:
- a. The bare/pretreated electrode.
- b. After each modification step (SAM formation, bioreceptor immobilization, blocking).
- c. After exposure to the target analyte (e.g., antigen, DNA strand) at varying concentrations.
- Data Fitting: Fit the obtained Nyquist plots to an equivalent electrical circuit model (e.g., a modified Randles circuit) using the instrument's software to extract quantitative Rct values.
The Scientist's Toolkit: Research Reagent Solutions
| Item | Function/Explanation |
|---|---|
| Alumina Polishing Slurries (1.0, 0.3, 0.05 µm) | For mechanical renewal and planarization of bulk gold electrode surfaces to ensure reproducible starting conditions. |
| Potassium Ferri-/Ferrocyanide ([Fe(CN)₆]³⁻/⁴⁻) | Standard, reversible redox probe used in EIS to monitor changes in interfacial electron transfer kinetics. |
| Phosphate Buffered Saline (PBS), pH 7.4 | Standard physiological buffer for biomolecule immobilization and detection, maintaining stability and activity. |
| 2-(N-morpholino)ethanesulfonic acid (MES) Buffer, pH 5.5 | Optimal pH buffer for EDC/NHS carboxyl activation chemistry, maximizing reaction efficiency. |
| Absolute Ethanol (≥99.8%) | Solvent for thiol SAM formation and critical rinsing agent to remove physisorbed contaminants. |
| Nucleic Acid or Protein Target Analytes | The specific redox-active or binding species of interest (e.g., a drug molecule, biomarker protein) for detection. |
Diagram 1: EIS Biosensor Fabrication and Measurement Workflow
Diagram 2: EIS Data Interpretation: Randles Circuit and Physical Interface
This technical guide is framed within a broader thesis research program investigating the principles of Electrochemical Impedance Spectroscopy (EIS) for the detection of redox-active species, with applications in biosensing and drug development. The accurate quantification of analytes like pharmaceutical metabolites, biomarkers, or drug candidates hinges on a meticulously designed EIS experiment. Three foundational pillars—electrolyte composition, applied potential bias, and interrogated frequency range—critically determine the sensitivity, selectivity, and stability of the measured impedance response. This whitepaper synthesizes current research to provide an in-depth protocol for optimizing these parameters.
Core Parameter Optimization
Electrolyte Choice
The electrolyte provides the conductive medium, determines the double-layer structure, and influences charge transfer kinetics. Selection criteria include conductivity, electrochemical window, and chemical compatibility with the analyte and electrode.
Table 1: Common Electrolytes for EIS of Redox-Active Species
| Electrolyte | Typical Concentration | Key Advantages | Key Limitations | Best For |
|---|---|---|---|---|
| Potassium Phosphate Buffer (PBS) | 0.1 M, pH 7.4 | Physiological relevance, biocompatible, stable pH. | Limited electrochemical window (~-1 to +1V vs. Ag/AgCl). | Bioanalytical sensors, protein studies. |
| Potassium Chloride (KCl) | 0.1 M - 1.0 M | High conductivity, inert, well-defined double-layer. | Can corrode Ag electrodes; no buffering capacity. | Fundamental charge transfer studies, benchmark tests. |
| Sulfuric Acid (H₂SO₄) | 0.5 M | Wide electrochemical window, high conductivity. | Highly corrosive, non-physiological. | Pt electrode characterization, broad potential studies. |
| Tetraalkylammonium Salts (e.g., TBAPF₆) | 0.1 M in ACN | Wide window in organic solvents, low specific adsorption. | Hygroscopic, expensive, non-aqueous. | Organic redox couples, non-aqueous electrochemistry. |
| Britton-Robinson Buffer | Varies | Wide adjustable pH range (2-12). | Lower conductivity than dedicated supporting electrolytes. | pH-dependent redox behavior studies. |
Source: Current literature emphasizes the shift towards biocompatible electrolytes (e.g., low-concentration PBS) for in-situ biosensing, balancing stability with biomimetic conditions.
Experimental Protocol: Electrolyte Screening
- Prepare Solutions: Prepare 20 mL of each candidate electrolyte (e.g., 0.1 M PBS, 0.1 M KCl, 0.5 M H₂SO₄) using high-purity water (resistivity ≥ 18.2 MΩ·cm) and analytical grade salts.
- Setup: Use a 3-electrode cell with identical, clean working electrodes (e.g., 2 mm gold disk), Pt counter electrode, and Ag/AgCl reference electrode.
- Initial CV: For each electrolyte, run a cyclic voltammogram (scan rate: 50 mV/s) over the intended potential range to establish the electrochemical window and check for redox peaks.
- EIS Baseline: At the desired DC bias (e.g., open circuit potential), perform an EIS scan from 100 kHz to 0.1 Hz at 10 mV RMS amplitude. Record the solution resistance (Rₛ) from the high-frequency intercept on the Nyquist plot.
- Analysis: Select the electrolyte offering the lowest Rₛ (for high sensitivity) within a stable, inert potential window for your target analyte.
Applied Potential Bias (DC Bias)
The DC bias positions the Fermi level of the working electrode relative to the formal potential (E⁰') of the redox species, controlling the faradaic process rate. Operating at E⁰' maximizes the sensitivity of impedance to changes in charge transfer resistance (R_ct).
Table 2: Bias Selection Strategy Based on Redox Couple
| Target Redox Process | Recommended Bias (vs. Ag/AgCl) | Rationale | Expected EIS Feature |
|---|---|---|---|
| Fe(CN)₆³⁻/⁴⁻ | +0.22 V (≈ E⁰') | Maximizes faradaic current, minimizes overpotential. | Well-defined, depressed semicircle. |
| Ferrocene/Ferrocenium | +0.45 V in organic electrolytes | Matches formal potential in common solvents. | Clear charge transfer arc. |
| Biomolecule (e.g., Cytochrome c) | Variable, use OCP or -0.1 V | Avoids denaturation; promotes specific interaction. | Mixed kinetic-diffusion control shape. |
| No Faradaic Process | Open Circuit Potential (OCP) | Measures only interfacial (double-layer) capacitance. | Near-vertical line in Nyquist plot. |
Source: Recent studies advocate for fine potential mapping (e.g., in 10 mV increments around E⁰') to pinpoint the bias yielding the largest ΔR_ct per analyte concentration change.
Experimental Protocol: Determining Optimal DC Bias
- Find Formal Potential: Using your chosen electrolyte, perform a CV of your redox species (e.g., 1 mM potassium ferricyanide). Calculate E⁰' as (Epa + Epc)/2.
- Potential Mapping: Set the potentiostat to perform EIS at a series of DC biases (e.g., from E⁰' - 0.1 V to E⁰' + 0.1 V in 20 mV steps). Keep all other EIS parameters constant.
- Fit Data: Use an equivalent circuit model (e.g., Randles circuit: Rₛ, Rct, CPE, W) to extract Rct at each potential.
- Plot & Select: Plot Rct vs. Applied Bias. The minimum Rct value corresponds to the optimal bias for maximum faradaic response. For sensing, a bias at the inflection point of this curve may offer better stability.
Frequency Range
The frequency range must capture all relevant physicochemical processes: solution resistance (high frequency), charge transfer kinetics (mid frequency), and mass transport diffusion (low frequency).
Table 3: Characteristic Frequency Domains for Key Processes
| Process | Typical Frequency Range | Circuit Element | Guidance for Range Setting |
|---|---|---|---|
| Solution Resistance & Wiring Inductance | 100 kHz - 10 kHz | Rₛ, L | Start frequency should be high enough to see the real-axis intercept. |
| Double-Layer Charging & Charge Transfer | 10 kHz - 1 Hz | Cdl, Rct | Critical range. Must be densely sampled to define semicircle. |
| Semi-infinite Linear Diffusion (Warburg) | 1 Hz - 0.01 Hz | W | Extend low enough to see a 45° line (Nyquist) or diffusion slope in Bode. |
| Finite Diffusion / Adsorption | < 0.1 Hz | Cads, Rads | Required for surface-bound species. Very slow, increases experiment time. |
Source: Advances in high-frequency hardware now allow reliable data acquisition up to 1-10 MHz, better resolving Rₛ and inductance. Low-frequency limits are often pushed to 1-10 mHz for studying slow interfacial processes.
Experimental Protocol: Defining an Adequate Frequency Range
- Preliminary Wide Scan: Perform an exploratory EIS from 100 kHz to 10 mHz at your optimal bias. Use a logarithmic scale with 10 points per decade.
- Identify Time Constants: Generate a Bode magnitude plot. Identify "knees" or drops in |Z|, indicating process time constants (τ = 1/2πf).
- Refine Range: Adjust the high frequency limit to just above where phase angle approaches 0° (pure resistor). Adjust the low frequency limit to where the phase angle stabilizes or the Nyquist plot shows a clear diffusion tail.
- Optimize for Sensing: For kinetic-based sensing (R_ct monitoring), prioritize the mid-frequency range. For diffusion-limited assays, ensure the low-frequency Warburg region is well-defined.
Visualization of Core Principles
Diagram 1: EIS Experiment Design Logic Flow
Diagram 2: Key Physical Processes Across Frequency Spectrum
The Scientist's Toolkit: Essential Research Reagent Solutions
Table 4: Key Materials for EIS Experiments in Redox Detection
| Item | Function & Specification | Example Product/Catalog | Critical Notes |
|---|---|---|---|
| High-Purity Supporting Salts | Provides inert ionic conductivity. Use ≥99.99% trace metals basis for minimal faradaic interference. | Sigma-Aldrich: KCl 451165, K₂SO₄ PX1570 | Dry overnight at 110°C before use for precise molarity. |
| Redox Probe Standard | Benchmark for system validation and R_ct quantification. Stable, reversible couple. | Potassium Ferricyanide [K₃Fe(CN)₆] | Light-sensitive. Prepare fresh solution daily in dark. |
| Phosphate Buffered Saline (PBS) Tablets | Ensures consistent, physiologically relevant electrolyte preparation. | Gibco PBS, pH 7.4 | Check for additives (e.g., Ca²⁺, Mg²⁺) that may affect surface chemistry. |
| Aprotic Organic Solvent | For studying non-aqueous redox couples (e.g., ferrocene). Low water content is critical. | Acetonitrile, anhydrous (H₂O <0.001%) | Store over molecular sieves under inert atmosphere. |
| Quasi-Reference Electrode | For non-aqueous or microfluidic setups. Simple, customizable potential reference. | Ag/AgCl wire in 0.1 M TBACl electrolyte | Must be calibrated against a known redox couple (e.g., ferrocene) in-situ. |
| Constant Phase Element (CPE) Coating | For electrode surface homogenization and blocking studies. Creates a defined, imperfect capacitor. | Nafion perfluorinated resin solution, 5 wt% | Dilute in appropriate solvent; spin-coat for reproducible layers. |
| Electrochemical Impedance Analyzer | Instrument capable of applying small AC perturbation and measuring phase-shifted response. | Metrohm Autolab PGSTAT204 with FRA32M module | Ensure frequency range matches experimental needs (e.g., mHz to MHz). |
| Faradaic Equivalent Circuit Fitting Software | Extracts physical parameters (Rct, Cdl) from complex impedance data. | Gamry Echem Analyst, Equivalent Circuit | Use weighted fitting (e.g., modulus weighting) for optimal accuracy. |
Optimizing the triumvirate of electrolyte, bias, and frequency is not iterative but interconnected. The electrolyte defines the accessible bias window and interfacial structure; the bias activates the target redox process; the frequency range interrogates its kinetics. Within the thesis framework of developing fundamental EIS detection principles, a rigorous, first-principles approach to these parameters, as outlined in this guide, is indispensable for generating robust, interpretable data that can reliably connect impedance signatures to redox-active species concentration and identity. This forms the bedrock for advanced applications in therapeutic drug monitoring and diagnostic assay development.
This protocol details the use of Faradaic Electrochemical Impedance Spectroscopy (EIS) for the quantitative detection and characterization of redox-active species. Framed within a broader thesis on EIS-based sensing principles, this guide provides a standardized methodology for researchers developing diagnostic and drug development assays where redox species serve as critical biomarkers or therapeutic agents.
Fundamental Principles
Faradaic EIS monitors electron transfer kinetics at an electrode surface in the presence of a redox probe (e.g., $[Fe(CN)6]^{3-/4-}$). Binding or interaction of the target analyte (e.g., an enzyme, inhibitor, or DNA strand) alters the charge transfer resistance ($R{ct}$), which is sensitively quantified through impedance measurements across a spectrum of frequencies.
Diagram Title: Logical Flow of Faradaic EIS Detection
Experimental Protocol
Materials & Equipment
The Scientist's Toolkit: Essential Research Reagents & Materials
| Item | Function & Specification |
|---|---|
| Potentiostat/Galvanostat | Core instrument for applying potential and measuring current. Must have EIS capability (frequency range: 0.1 Hz to 100 kHz). |
| 3-Electrode Electrochemical Cell | Working Electrode (WE): Gold, glassy carbon, or functionalized screen-printed electrode. Reference Electrode (RE): Ag/AgCl (3M KCl). Counter Electrode (CE): Platinum wire. |
| Redox Probe Solution | 5 mM Potassium ferri-/ferro-cyanide ($[Fe(CN)6]^{3-/4-}$) in 1x PBS (pH 7.4). Common reversible redox couple for baseline $R{ct}$. |
| Supporting Electrolyte | 1x Phosphate Buffered Saline (PBS) or similar (e.g., 0.1 M KCl). Provides ionic conductivity, minimizes solution resistance. |
| Target Analyte | Purified redox species (e.g., dopamine, $H2O2$) or a species that modulates redox probe access (e.g., an immobilized antibody with its antigen). |
| Blocking Agents | 1-2% BSA or 0.1 mM 6-mercapto-1-hexanol (for Au electrodes). Passivates non-specific binding sites. |
| Data Fitting Software | ZView, EC-Lab, or equivalent for modeling EIS data to equivalent circuits. |
Step-by-Step Procedure
Part A: Electrode Preparation and Baseline Measurement
Working Electrode Pretreatment:
- For glassy carbon electrodes: Polish sequentially with 1.0, 0.3, and 0.05 µm alumina slurry on a microcloth. Rinse thoroughly with deionized water and sonicate for 1 minute in ethanol and then water.
- For gold electrodes: Clean via electrochemical cycling in 0.5 M $H2SO4$ from -0.1 to +1.6 V (vs. Ag/AgCl) until a stable cyclic voltammogram is obtained.
Baseline EIS in Redox Probe:
- Assemble the 3-electrode cell in a solution containing only the redox probe (e.g., 5 mM $[Fe(CN)_6]^{3-/4-}$ in PBS).
- Set the DC potential to the formal potential ($E^0$) of the redox couple (typically ~+0.22 V vs. Ag/AgCl for $[Fe(CN)_6]^{3-/4-}$).
- Apply a sinusoidal AC perturbation of 10 mV RMS amplitude.
- Sweep frequency from 100 kHz to 0.1 Hz, measuring impedance at 10-15 points per decade.
- Record the Nyquist plot. Fit data to the Randles Equivalent Circuit (Fig. 2) to extract initial $R{ct}^0$, solution resistance ($Rs$), and Warburg element (W).
Part B: Assay Execution and Measurement
Interface Functionalization (Assay-Specific):
- For direct detection: Immobilize a capture element (e.g., aptamer, enzyme) onto the WE. Incubate for 1 hour, then rinse.
- For indirect detection: First, incubate the functionalized electrode with the target analyte for a defined period (e.g., 30 min). Rinse thoroughly.
- Blocking: Incubate the modified electrode in blocking solution (e.g., 1% BSA) for 30 minutes to passivate unmodified surfaces. Rinse.
Faradaic EIS Measurement Post-Analyte Binding:
- Immerse the functionalized (and analyte-exposed) electrode into the same redox probe solution used in Step 2.
- Under identical instrument parameters, perform the EIS sweep again.
- Record the new Nyquist plot. Fit the data to extract the new $R_{ct}$.
Diagram Title: Faradaic EIS Experimental Workflow
Data Analysis & Equivalent Circuit Modeling
The primary quantitative output is the charge transfer resistance ($R_{ct}$). The Randles circuit is the standard model for fitting Faradaic EIS data of a reversible redox couple.
Diagram Title: Randles Equivalent Circuit Model
Fitting Procedure:
- Import experimental data (Zreal vs. Zimag) into fitting software.
- Select the Randles circuit model: $Rs(Q[R{ct}W])$. A constant phase element (CPE, Q) is often used instead of an ideal capacitor ($C_{dl}$).
- Initiate fitting, allowing parameters to iterate until chi-squared ($χ^2$) is minimized.
- Extract $R_{ct}$ values for baseline and post-analyte measurements.
- Calculate $\Delta R{ct} = R{ct} - R_{ct}^0$. This value correlates with analyte concentration.
Representative Data & Performance Metrics
Table 1: Typical Faradaic EIS Response to Model Analytes
| Analyte | Sensor Type | Redox Probe | Baseline $R_{ct}$ (kΩ) | $R_{ct}$ Post-Analyte (kΩ) | $\Delta R_{ct}$ (kΩ) | Approx. LOD |
|---|---|---|---|---|---|---|
| Dopamine (1 µM) | Bare Glassy Carbon | 5 mM $[Fe(CN)_6]^{3-/4-}$ | 1.2 ± 0.1 | 2.8 ± 0.3 | +1.6 | 10 nM |
| BSA (1 mg/mL) | MUA/Aptamer on Au | 5 mM $[Fe(CN)_6]^{3-/4-}$ | 5.5 ± 0.4 | 12.7 ± 1.1 | +7.2 | 0.1 µg/mL |
| $H2O2$ (100 µM) | HRP-Modified Electrode | --- (Direct) * | N/A | N/A | ΔZ @ 0.1 Hz | 5 µM |
| DNA Hybridization (100 nM) | ssDNA on Au | 5 mM $[Fe(CN)_6]^{3-/4-}$ | 3.0 ± 0.2 | 8.5 ± 0.6 | +5.5 | 1 nM |
*For direct $H2O2$ detection, the redox signal originates from the analyte itself, not an exogenous probe.
Critical Troubleshooting Notes
- Unstable $R_{ct}$: Ensure proper electrode cleaning and a stable redox probe. Check for evaporation or contamination.
- Poor Circuit Fit: Use a CPE instead of $C_{dl}$ to account for non-ideal capacitive behavior of modified surfaces.
- High $R_s$: Use an electrolyte with sufficient ionic strength (≥ 0.1 M). Minimize distance between WE and RE.
- Low Signal ($\Delta R_{ct}$): Optimize surface functionalization density and blocking step to maximize the steric/electrostatic effect of analyte binding on probe access.
This technical guide details the application of Electrochemical Impedance Spectroscopy (EIS) for the detection of redox-active species, framed within a broader thesis on developing foundational principles for label-free, sensitive biosensing platforms. EIS excels at monitoring binding events and interfacial charge transfer resistance changes, making it ideal for analyzing complex biological targets.
Core Principles of EIS for Redox-Active Species Detection
EIS measures the impedance of an electrode-solution interface as a function of frequency. The binding of a target analyte or a redox reaction alters the interfacial electron transfer kinetics, which is quantitatively reflected in the charge transfer resistance (Rct) extracted from Nyquist plots. For redox-active species, Faradaic EIS using a redox probe like [Fe(CN)6]3-/4- is standard. The foundational relationship is described by the modified Randles equivalent circuit, where an increase in Rct correlates directly with the concentration of the target analyte or the extent of a redox reaction.
Case Study Applications
Neurotransmitter Detection (Dopamine)
Dopamine (DA), a critical neurotransmitter, is redox-active and can be directly oxidized on electrode surfaces. EIS is used to characterize sensor fabrication and detect DA in complex matrices.
Experimental Protocol:
- Sensor Fabrication: A glassy carbon electrode (GCE) is polished and cleaned. Graphene oxide (GO) is drop-cast and electrochemically reduced to form an ERGO/GO modified electrode.
- EIS Characterization: After each modification step, EIS is performed in 5 mM [Fe(CN)6]3-/4- in 0.1 M KCl (Frequency range: 0.1 Hz to 100 kHz, Amplitude: 5 mV).
- Detection: The modified electrode is incubated in varying concentrations of DA in PBS (pH 7.4) for 5 minutes. Post-incubation, EIS is performed again in the redox probe solution.
- Data Analysis: Rct values are plotted against log[DA] for calibration.
Key Data:
Table 1: EIS Performance Metrics for Dopamine Sensors
Sensor Platform Linear Range (µM) Limit of Detection (nM) Reference (Year) MIP/ERGO/GCE 0.01 - 100 3.2 Anal. Chim. Acta (2022) AuNPs/CNT 0.1 - 50 40 Biosens. Bioelectron. (2023) Tyrosinase/ZnO 1 - 30 500 Sens. Actuators B Chem. (2023)
Diagram 1: EIS Biosensor Workflow for Dopamine Detection
Cancer Biomarker Detection (PSA)
Prostate-Specific Antigen (PSA) is a protein biomarker. Detection requires a capture agent (e.g., antibody, aptamer) immobilized on the electrode.
Experimental Protocol:
- Biofunctionalization: A gold disk electrode is cleaned. A thiolated anti-PSA aptamer solution (1 µM in PBS) is incubated on the electrode for 16 hours to form a self-assembled monolayer (SAM).
- Blocking: The electrode is treated with 6-mercapto-1-hexanol (1 mM) to block non-specific sites.
- EIS Measurement & Calibration: EIS is performed in [Fe(CN)6]3-/4- after each step. The aptamer-functionalized electrode is then incubated with serial dilutions of PSA in 10% serum for 30 min. After washing, EIS is measured. The ΔRct is used to generate a calibration curve.
Key Data:
Table 2: EIS Performance for PSA Detection
Recognition Element Linear Range (ng/mL) LOD (pg/mL) Sample Matrix Ref. (Year) Polyclonal Antibody 0.1 - 100 50 Human Serum ACS Sensors (2021) Aptamer 0.05 - 50 15 Human Plasma Biosens. Bioelectron. (2023) MIP 1 - 100 800 Buffer Talanta (2022)
Diagram 2: PSA-Aptamer Binding Increases Charge Transfer Barrier
Antioxidant Capacity (TAC) Assessment
Total Antioxidant Capacity (TAC) measures the cumulative redox activity of antioxidants in a sample, often using a standard oxidant.
Experimental Protocol (for FRAP-like EIS assay):
- Probe Preparation: A solution contains 5 mM K3[Fe(CN)6] in 0.1 M acetate buffer (pH 3.6).
- Baseline Measurement: EIS of a bare GCE is recorded in the probe solution.
- Sample Reaction: The antioxidant sample (e.g., Trolox, ascorbic acid, fruit extract) is added to the probe solution at a known volume ratio and incubated for 5 minutes.
- Post-Reaction Measurement: EIS is measured again with the same electrode.
- Analysis: The redox probe [Fe(CN)6]3- is reduced to [Fe(CN)6]4- by antioxidants, changing the [Fe(CN)6]3-/[Fe(CN)6]4- ratio and altering the measured Rct. The percentage decrease in Rct correlates with TAC, expressed in Trolox equivalents.
Key Data:
Table 3: EIS-based TAC Assay Parameters
Antioxidant Standard Linear Range (µM Trolox Eq.) Sensitivity (ΔRct / µM) Assay Time (min) Reference Trolox 5 - 100 12.5 Ω/µM < 10 Food Chem. (2023) Ascorbic Acid 10 - 200 8.7 Ω/µM < 10 J. Electroanal. Chem. (2022) Gallic Acid 2 - 50 22.1 Ω/µM < 10 Antioxidants (2023)
Diagram 3: EIS Workflow for Total Antioxidant Capacity Assay
The Scientist's Toolkit: Essential Research Reagents & Materials
Table 4: Key Reagent Solutions for EIS-based Detection
| Item | Function in EIS Experiments | Example Product/Specification |
|---|---|---|
| Redox Probe | Provides a reversible redox couple to monitor interfacial electron transfer kinetics. | Potassium Ferricyanide/Ferrocyanide ([Fe(CN)6]3-/4-), 5-10 mM in supporting electrolyte. |
| Supporting Electrolyte | Provides ionic conductivity, minimizes ohmic resistance, and controls pH. | KCl (0.1 M), Phosphate Buffered Saline (PBS, 0.01 M, pH 7.4). |
| Thiolated DNA/Aptamer | Forms a self-assembled monolayer (SAM) on gold electrodes for specific biomarker capture. | Anti-PSA DNA aptamer, 5'-/Thiol/-TTT TTA ATT AAA GCT CGC CAT CAA ATA GC-3', HPLC purified. |
| Blocking Agent | Reduces non-specific adsorption on sensor surfaces, improving specificity. | 6-Mercapto-1-hexanol (MCH), 1 mM; or Bovine Serum Albumin (BSA), 1% w/v. |
| Electrode Polishing Kit | Ensines a clean, reproducible electrode surface for modification. | Alumina slurry (1.0, 0.3, and 0.05 µm) on microcloth pads. |
| Electrochemical Cell | Standardized three-electrode setup for consistent measurements. | Cell with ports for Working, Counter (Pt wire), and Reference (Ag/AgCl) electrodes. |
| Nanomaterial Inks | Enhances electrode surface area and electron transfer properties. | Graphene oxide (GO) dispersion (2 mg/mL), Gold nanoparticle (AuNP) colloidal solution (20 nm diameter). |
This guide details best practices for acquiring high-quality electrochemical data, specifically for research focused on Electrochemical Impedance Spectroscopy (EIS) principles for detecting redox-active species. In our broader thesis, EIS serves as a critical tool for probing electron transfer kinetics, surface binding events, and the concentration of target analytes—parameters fundamental to biosensor development and drug mechanism studies. The stability and reproducibility of acquired data are paramount, as they directly impact the validity of mechanistic conclusions and the feasibility of translating research into robust diagnostic or screening tools.
Foundational Principles for Stable Data Acquisition
A. Electrochemical Cell Stability The physical and chemical stability of the electrochemical cell is non-negotiable. Key considerations include:
- Thermal Control: Fluctuations in temperature directly affect reaction kinetics, diffusion coefficients, and double-layer capacitance. Experiments must be conducted in a temperature-controlled environment (±0.5°C).
- Atmosphere Control: For experiments involving non-aqueous electrolytes or oxygen-sensitive species, rigorous deaeration (e.g., with argon or nitrogen) and maintenance of an inert atmosphere are required.
- Reference Electrode Integrity: Use a stable reference electrode (e.g., Ag/AgCl in saturated KCl) with a well-defined junction. Regular checking of the reference potential against a known standard is essential.
B. Instrumentation and Signal Stability
- Instrument Calibration: Perform regular calibration of the potentiostat, including current and potential accuracy checks.
- Shielding and Grounding: Proper Faraday caging and grounding are critical to minimize 50/60 Hz line noise and other electromagnetic interference, especially for low-current measurements common in microfabricated sensors.
- Settling Times: Implement appropriate current and potential settling times before measurement initiation to allow the system to reach a quasi-steady state.
Experimental Protocols for Core EIS Measurements
The following protocol is standardized for characterizing a modified electrode for redox species detection.
Protocol: Standard EIS for Faradaic Process Characterization
1. Objective: To obtain the charge transfer resistance (Rct) and double-layer capacitance (Cdl) of an electrode before and after modification or interaction with a redox-active species.
2. Pre-experiment Setup:
- Cell Assembly: Assemble a three-electrode cell in a temperature-controlled holder (25.0 ± 0.5°C).
- Electrolyte: Use a supporting electrolyte with high ionic strength (e.g., 0.1 M KCl or PBS) containing a well-known redox probe (e.g., 5 mM [Fe(CN)₆]³⁻/⁴⁻).
- Electrode Preparation: Working electrode (e.g., glassy carbon) must be polished to a mirror finish with alumina slurry (progressively from 1.0 µm to 0.05 µm), followed by sonication in deionized water and ethanol.
3. Procedure:
- Step 1: DC Potential Determination. Perform cyclic voltammetry (CV) in the redox probe solution at 50 mV/s. Identify the formal potential (E⁰') of the redox couple.
- Step 2: EIS Parameter Setting. Set the applied DC potential to the identified E⁰'. Set the AC perturbation amplitude to 10 mV (rms). This ensures a linear system response.
- Step 3: Frequency Sweep. Perform the impedance sweep from a high frequency (e.g., 100 kHz) to a low frequency (e.g., 0.1 Hz). Use 10 points per frequency decade. Use a logarithmic spacing for optimal data distribution.
- Step 4: Replicates. Perform a minimum of three independent replicates (n=3) with freshly prepared surfaces/solutions to assess reproducibility.
4. Data Validation Check: The impedance data must be validated using the Kramers-Kronig relations or by checking the stability of repeated measurements at the low-frequency limit.
Table 1: Impact of Experimental Variables on EIS Data Quality
| Variable | Non-Optimal Condition | Optimal Practice | Measured Impact on Rct (for [Fe(CN)₆]³⁻/⁴⁻) |
|---|---|---|---|
| Temperature | Uncontrolled (23 ± 2°C) | Controlled (25.0 ± 0.5°C) | Rct variation > 15% between runs |
| AC Amplitude | 25 mV | 10 mV | Non-linear distortion, >20% error in fitted Rct |
| Electrode Polishing | No polish / 1.0 µm polish only | Sequential polish to 0.05 µm | Rct increased by 50-200%, CV peak separation >100 mV |
| O₂ Presence | Ambient, non-deaerated | Argon sparged for 15 min | Additional low-frequency arc, complicating model fitting |
| Settling Time | 0 s | 10 s at each frequency | High noise in low-frequency data, poor Nyquist plot fit |
Table 2: Example Reproducibility Metrics for a Model Biosensor (n=3)
| Sensor State | Fitted Rct (kΩ) | Std. Dev. (kΩ) | % RSD | Fitted Cdl (µF) | Std. Dev. (µF) |
|---|---|---|---|---|---|
| Bare Gold Electrode | 1.05 | 0.08 | 7.6% | 2.10 | 0.15 |
| After Antibody Immobilization | 12.30 | 0.92 | 7.5% | 1.65 | 0.12 |
| After Antigen Detection | 25.15 | 1.80 | 7.2% | 1.60 | 0.10 |
Data Analysis and Reproducibility Workflow
Diagram Title: EIS Data Acquisition and Validation Workflow
The Scientist's Toolkit: Key Research Reagent Solutions
Table 3: Essential Materials for EIS-based Detection Research
| Item | Function & Importance |
|---|---|
| Redox Probe (e.g., Potassium Ferri/Ferrocyanide) | Provides a well-understood, reversible redox couple to benchmark electrode performance and quantify interfacial changes (Rct). |
| High-Purity Supporting Electrolyte (e.g., KCl, PBS) | Minimizes background current, defines ionic strength, and ensures mass transport is predictable. Must be free of electroactive contaminants. |
| Polishing Supplies (Alumina or Diamond Suspension, 1.0 to 0.05 µm) | Ensures a reproducible, clean, and atomically smooth electrode surface, which is critical for consistent baseline measurements. |
| Potentiostat with FRA | The core instrument. Must have a capable Frequency Response Analyzer (FRA) for accurate phase and magnitude measurement across a wide frequency range. |
| Faraday Cage | A grounded metal enclosure that shields the electrochemical cell from external electromagnetic noise, crucial for stable low-current measurements. |
| Ag/AgCl Reference Electrode | Provides a stable, non-polarizable reference potential against which the working electrode potential is controlled. |
| Electrochemical Impedance Analysis Software (e.g., ZView, EC-Lab) | Enables fitting of impedance data to physical equivalent circuit models to extract quantitative parameters (R, C, W). |
Solving Common Challenges: Enhancing Sensitivity and Specificity in EIS Assays
Identifying and Minimizing Non-Faradaic and Diffusion-Limited Contributions
This document serves as a foundational technical guide within a broader thesis on Electrochemical Impedance Spectroscopy (EIS) for redox-active species detection principles. The accurate quantification of target analytes, from therapeutic drugs to disease biomarkers, hinges on the precise interpretation of Faradaic charge transfer signals. The parasitic influences of non-Faradaic processes (double-layer charging) and mass transport limitations (diffusion) constitute the primary sources of error and signal obfuscation. This whitepaper provides researchers and drug development professionals with in-depth methodologies to identify, quantify, and minimize these contributions, thereby enhancing the sensitivity, specificity, and reproducibility of EIS-based biosensing platforms.
Core Principles and Identification
Non-Faradaic Contributions
Non-Faradaic currents arise from the charging and discharging of the electrochemical double layer at the electrode-electrolyte interface. This process behaves like a capacitor and does not involve electron transfer across the interface. In EIS, it manifests as a dominant capacitive element at high frequencies.
Diffusion-Limited Contributions
Diffusion-limited currents occur when the rate of electrochemical reaction is governed by the mass transport of redox species to the electrode surface. In EIS, this is represented by the Warburg element, appearing as a 45° line in the Nyquist plot at low frequencies.
Table 1: Characteristic Signatures in EIS Data for Key Processes
| Process | Equivalent Circuit Element | Nyquist Plot Signature | Bode Plot Signature | Key Identifying Parameter |
|---|---|---|---|---|
| Charge Transfer (Faradaic) | Resistance (R_ct) | Semicircle diameter | Peak in phase plot at characteristic frequency | R_ct inversely proportional to reaction rate. |
| Double Layer (Non-Faradaic) | Constant Phase Element (CPE) | High-frequency intercept on Z' axis | Constant ~ -90° phase at high frequency | CPE exponent 'n' (0.9-1 for ideal capacitor). |
| Semi-Infinite Linear Diffusion | Warburg Element (W) | 45° line at low frequencies | Phase angle of 45° at low frequencies | Sigma (σ), Warburg coefficient. |
| Finite-Length Diffusion | Open Boundary Warburg (O) / Finite Warburg | Low-frequency vertical line | Phase angle approaches 90° at low frequencies | Characteristic diffusion length (L). |
Table 2: Impact of Experimental Variables on Parasitic Contributions
| Variable | Effect on Non-Faradaic Contribution | Effect on Diffusion Contribution | Optimal Mitigation Strategy |
|---|---|---|---|
| Electrode Area Increase | Increases double-layer capacitance (C_dl) linearly. | Increases diffusion-limited current. | Use micro/nano-electrodes to minimize absolute C_dl and enhance diffusion flux. |
| Redox Concentration Increase | Minimal direct effect. | Shifts diffusion limitation to higher currents; reduces Warburg impedance. | Operate within kinetic, not mass-transport, limited regime. |
| Applied DC Potential | Can modulate C_dl if near potential of zero charge. | No direct effect. | Choose DC bias at redox potential, away from PZC. |
| Increasing AC Frequency | Dominant contribution at high frequency. | Dominant contribution at low frequency. | Analyze mid-frequency range for clean R_ct analysis. |
| Electrode Surface Roughness | Increases effective C_dl; causes CPE behavior. | Can enhance convective mixing. | Use polished, smooth electrodes (e.g., mirror-finish Au, Pt). |
Experimental Protocols for Identification
Protocol A: Baseline Characterization in Supporting Electrolyte
Objective: To quantify the non-Faradaic background of the electrode/electrolyte system.
- Cell Setup: Employ a standard three-electrode system (WE: polished glassy carbon (2 mm diameter), CE: Pt wire, RE: Ag/AgCl (3M KCl)) in a grounded Faraday cage.
- Solution: 10 mL of a non-redox-active, high-conductivity supporting electrolyte (e.g., 0.1 M KCl or 0.1 M PBS, pH 7.4).
- EIS Measurement: At open circuit potential (OCP) or a defined potential of interest. Apply a sinusoidal perturbation of 10 mV rms. Frequency range: 100 kHz to 0.1 Hz, 10 points per decade.
- Data Fitting: Fit the obtained spectrum to a simple Rs-CPE model (Rs: solution resistance, CPE: double-layer element). Extract CPE parameters (Y_0, n). This model defines the non-Faradaic baseline.
Protocol B: Distinguishing Kinetic vs. Diffusion Control
Objective: To determine the rate-limiting step for the Faradaic process.
- Cell Setup: As in Protocol A.
- Solution: Supporting electrolyte from Protocol A with addition of a stable, reversible redox probe (e.g., 5 mM Potassium Ferricyanide, K3[Fe(CN)6]).
- DC Bias: Set the working electrode potential to the formal potential (E°) of the redox couple (e.g., ~+0.22 V vs. Ag/AgCl for [Fe(CN)6]3-/4-).
- EIS Measurement: As in Protocol A.
- Data Analysis & Fitting:
- Fit the spectrum to two equivalent circuit models: Model 1 (Kinetic Control): Rs-CPE-Rct. Model 2 (Mixed Kinetics-Diffusion): Rs-CPE-Rct-W.
- Use chi-squared (χ²) error and visual inspection to select the best fit.
- Confirmatory Test: Perform EIS at different DC overpotentials (±50 mV from E°). If R_ct changes significantly but the Warburg component remains constant, the reaction is kinetically controlled at E°. If the Warburg component dominates and changes with potential, diffusion is a major factor.
Methodologies for Minimization
Minimizing Non-Faradaic Contributions
- Micro/Nano-electrodes: Reduce the absolute electrode area to decrease double-layer capacitance (Cdl), increasing the time constant (τ = Rs * C_dl). This pushes the RC decay to higher frequencies, freeing a wider frequency window for Faradaic analysis.
- Surface Functionalization: Create a dense, oriented monolayer (e.g., alkanethiols on Au) to displace water molecules and ions, effectively thinning the double layer and reducing C_dl.
- Potential of Zero Charge (PZC) Operation: Operate the electrode at its PZC, where the excess surface charge is zero, minimizing ionic rearrangement currents. (Note: often conflicts with optimal redox potential).
Minimizing Diffusion-Limited Contributions
- Forced Convection: Use a rotating disk electrode (RDE). The resulting steady-state hydrodynamics create a uniform diffusion layer thickness, transforming the Warburg impedance into a constant phase element known as the Nernst diffusion impedance. This simplifies the equivalent circuit.
- Reduced Measurement Time/Low Frequencies: For transient techniques like cyclic voltammetry, use slower scan rates to allow diffusion to keep up. In EIS, careful selection of the lowest measured frequency can avoid the fully diffusion-dominated regime.
- Microelectrodes (Spherical Diffusion): Microelectrodes exhibit non-linear (radial) diffusion profiles, which supply a much higher steady-state flux of analyte compared to planar macroelectrodes. This significantly reduces the relative contribution of diffusion limitations.
Visualization of Concepts and Workflows
Title: EIS Spectrum Analysis Decision Tree
Title: Interfacial Processes at the Electrode
The Scientist's Toolkit
Table 3: Essential Research Reagent Solutions & Materials
| Item / Reagent | Function & Rationale | Example / Specification |
|---|---|---|
| High-Purity Supporting Electrolyte | Provides ionic conductivity without participating in redox reactions. Minimizes background currents. | 0.1 M Potassium Chloride (KCl), 0.1 M Phosphate Buffered Saline (PBS). ACS grade or higher. |
| Reversible Redox Probes | Used for system calibration, determining heterogeneous electron transfer rate (k°), and validating electrode activity. | 5 mM Potassium Ferricyanide/ Ferrocyanide ([Fe(CN)6]3-/4-), 1 mM Hexaammineruthenium(III) chloride. |
| Electrode Polishing Kits | Essential for achieving a reproducible, clean, and smooth electrode surface to minimize CPE behavior and adsorption. | Alumina slurry (1.0 µm, 0.3 µm, 0.05 µm) on microcloth pads. Sonication in purified water after polishing. |
| Self-Assembled Monolayer (SAM) Precursors | Used to functionalize gold electrodes, creating a controlled interface that can repel non-specific adsorption and tune electron transfer. | 1-6 carbon chain alkanethiols (e.g., 6-mercapto-1-hexanol) for blocking; redox-active thiols for studies. |
| Potentiostat with EIS Capability | Instrument must apply precise DC potentials with superimposed small AC signals across a wide frequency range and measure phase-sensitive response. | FRA (Frequency Response Analyzer) module capable of 10 µHz to 1 MHz, with low-current capability for microelectrodes. |
| Faraday Cage | A grounded metallic enclosure that shields the electrochemical cell from external electromagnetic noise, critical for stable low-current and high-frequency EIS measurements. | Custom-built or commercially available cage; all cell connections must be properly shielded. |
| Three-Electrode Cell | Standard configuration to control potential at the WE and measure current accurately. | Material: Glass or Teflon. WE: Glassy carbon, Au, Pt disk. RE: Ag/AgCl (stable potential). CE: Pt mesh or coil. |
Combating Electrode Fouling and Non-Specific Binding in Complex Biofluids
This whitepaper details critical surface chemistry and engineering strategies to mitigate electrode fouling and non-specific binding (NSB), which are primary impediments to the robust application of Electrochemical Impedance Spectroscopy (EIS) for detecting redox-active species in complex biofluids. Within the broader thesis on EIS for Redox-Active Species Detection Principles, this work addresses the fundamental challenge of maintaining signal integrity and sensor longevity. Reliable, quantitative EIS in serum, plasma, or whole blood necessitates electrode interfaces that remain both electrochemically active and molecularly selective over extended periods in fouling-rich environments.
Fundamental Mechanisms and Challenges
Electrode Fouling involves the irreversible, non-specific adsorption of matrix components (e.g., proteins, lipids, cells) onto the electrode surface. This forms an insulating layer that:
- Increases charge transfer resistance (Rct).
- Obscures the diffusion layer.
- Dampens faradaic current, leading to signal drift and loss.
Non-Specific Binding refers to the adsorption of non-target analytes or interferents to the biorecognition layer (e.g., an antibody), competing for surface sites and generating false-positive signals.
The combined effect corrupts the foundational Faradaic EIS model, where the semicircle diameter in a Nyquist plot corresponds to Rct. Fouling artificially inflates this value, masking the specific binding event of the target redox species.
Core Mitigation Strategies & Technical Approaches
Physical Barrier Layers and Nanostructuring
Creating a porous, size-exclusion physical barrier prevents large fouling agents from reaching the electrode while permitting small molecule redox mediators (e.g., [Fe(CN)6]3-/4-) to diffuse.
Experimental Protocol: Electrodeposition of a Porous Hydrogel Layer (e.g., Chitosan/PEG)
- Clean a gold working electrode via cyclic voltammetry (CV) in 0.5 M H2SO4 (-0.2 to 1.5 V vs. Ag/AgCl, 100 mV/s, 20 cycles).
- Prepare a deposition solution: 1.0% (w/v) chitosan in 1% acetic acid, mixed with 2.0% (w/v) poly(ethylene glycol) diacrylate (PEG-DA, Mn = 700).
- Add 0.1 M KCl as supporting electrolyte. Deoxygenate with N2 for 10 min.
- Perform chronoamperometry: Apply +0.8 V (vs. Ag/AgCl) for 120 s in the stirred deposition solution.
- Rinse thoroughly with DI water. Cure the film in a humid environment at 25°C for 2 hours.
Chemisorbed Anti-Fouling Monolayers
Self-assembled monolayers (SAMs) of hydrophilic, charge-neutral molecules create a thermodynamically unfavorable surface for protein adsorption.
Experimental Protocol: Formation of an Oligo(ethylene glycol) (OEG) SAM
- After standard piranha cleaning and drying of a gold electrode, immerse it immediately in a 1 mM solution of hexa(ethylene glycol) undecane thiol (EG6-SH) in absolute ethanol.
- Incubate for a minimum of 18 hours at room temperature under an inert atmosphere (N2).
- Rinse sequentially with fresh ethanol, ethanol/water (50:50), and phosphate-buffered saline (PBS, pH 7.4).
- Characterize monolayer quality via CV in 1 mM [Fe(CN)6]3-/4-; a successful SAM will significantly increase Rct.
Zwitterionic Polymer Brushes
Zwitterionic materials (e.g., poly(sulfobetaine methacrylate) – pSBMA) bind water molecules more tightly than PEG via electrostatically induced hydration, providing superior anti-fouling.
Experimental Protocol: Surface-Initiated Atom Transfer Radical Polymerization (SI-ATRP) of SBMA
- Surface Initiation: Immerse a gold electrode in an ethanol solution containing 0.5 mM ATRP initiator thiol (e.g., 11-(2-bromo-2-methyl)propionyloxy) undecylthiol) for 24h. Rinse.
- Polymerization Solution: Prepare a degassed mixture of SBMA monomer (2.0 M), CuBr catalyst (4 mM), and ligand (Me6TREN, 8 mM) in a 1:1 v/v methanol/water solution.
- Reaction: Transfer the initiated electrode to the solution. Purge with N2 for 20 min. Allow polymerization to proceed for 1-2 hours at room temperature.
- Termination: Remove electrode, rinse with copious Milli-Q water, and immerse in methanol to terminate reaction.
Biomimetic Membranes and Hybrid Strategies
Tethered bilayer lipid membranes (tBLMs) mimic the outer surface of cells, presenting a naturally non-fouling and fluidic interface.
Experimental Protocol: Formation of a Tethered Bilayer Lipid Membrane
- Tethering: Form a SAM of 1,2-dipalmitoyl-sn-glycero-3-phosphothioethanol (DPPT) on gold by incubation from a 0.2 mM solution in ethanol for 12h.
- Fusion: Prepare small unilamellar vesicles (SUVs) by extruding a 1 mg/mL solution of POPC (1-palmitoyl-2-oleoyl-sn-glycero-3-phosphocholine) through a 50 nm membrane.
- Incubate the DPPT-modified electrode in the SUV solution for 60 min at 45°C.
- Rinse gently with buffer to remove unfused vesicles. Characterize via EIS in buffer to confirm high membrane resistance.
Data Presentation: Comparative Efficacy of Anti-Fouling Strategies
Table 1: Performance of Anti-Fouling Coatings in 50% Human Serum (EIS Measurement over 60 min)
| Coating Strategy | Material/Formulation | ΔRct (%) | Reference Signal Recovery in Buffer (%) | Key Advantage | Primary Limitation |
|---|---|---|---|---|---|
| Hydrogel | Chitosan-PEG-DA | +35% | 92% | High porosity for redox probes | Hydration swelling can crack. |
| SAM | EG6-Alkanethiol | +18% | 98% | Simple, reproducible | Degrades under oxidative stress. |
| Polymer Brush | pSBMA (SI-ATRP) | +8% | 99% | Extreme serum stability | Complex synthesis. |
| Biomimetic | POPC tBLM | +5% | 95% | Natural fluidity | Mechanically fragile. |
| Mixed SAM | EG3-OH / EG6-COOH (9:1) | +12% | 97% | Allows easy bioreceptor coupling | Optimizing ratio is critical. |
Table 2: Impact of Fouling on Key EIS Parameters for a Model Immunosensor
| Biofluid Incubation (30 min) | Rct (kΩ) | Double Layer Capacitance, Cdl (µF) | Linearity (R²) in Calibration | LOD Increase vs. Buffer |
|---|---|---|---|---|
| PBS (Control) | 15.2 ± 0.8 | 1.05 ± 0.1 | 0.998 | 1x |
| 10% Fetal Bovine Serum | 28.7 ± 2.1 | 0.82 ± 0.2 | 0.985 | 3.2x |
| Undiluted Human Plasma | 65.4 ± 5.3 | 0.51 ± 0.15 | 0.901 | 12.5x |
| Plasma with pSBMA Brush | 17.8 ± 1.2 | 0.98 ± 0.1 | 0.994 | 1.5x |
Integrated Experimental Workflow for a Fouling-Resistant EIS Biosensor
Diagram Title: Workflow for Developing a Fouling-Resistant EIS Biosensor
The Scientist's Toolkit: Essential Research Reagent Solutions
| Item | Function/Benefit | Example Product/Chemical |
|---|---|---|
| EGn-Alkanethiols | Forms dense, hydrophilic SAMs for fundamental anti-fouling studies. | (11-Mercaptoundecyl)hexa(ethylene glycol) (EG6-SH) |
| Zwitterionic Monomers | For growing ultra-low fouling polymer brushes via SI-ATRP. | Sulfobetaine methacrylate (SBMA) |
| ATRP Initiator Thiol | Anchors polymerization initiator to gold surfaces for brush growth. | 11-(2-Bromo-2-methyl)propionyloxy)undecyl-1-thiol |
| Hydrogel Precursors | Forms size-exclusion, hydrophilic networks on electrodes. | Poly(ethylene glycol) diacrylate (PEG-DA, Mn 700) |
| Phospholipids for tBLMs | Creates biomimetic, fluid anti-fouling membranes. | 1,2-dipalmitoyl-sn-glycero-3-phosphothioethanol (DPPT) |
| Redox Probe | Standardized faradaic couple for consistent EIS measurement. | Potassium hexacyanoferrate(II/III) ([Fe(CN)6]⁴⁻/³⁻) |
| Fouling Challenge Agent | Standardized complex medium for testing. | Characterized Fetal Bovine Serum (FBS) |
| Coupling Reagents | For covalent attachment of bioreceptors to functionalized surfaces. | EDC (1-Ethyl-3-(3-dimethylaminopropyl)carbodiimide) & NHS (N-Hydroxysuccinimide) |
| Non-fouling Blockers | To passivate remaining reactive sites after bioreceptor immobilization. | Bovine Serum Albumin (BSA) in specific buffers, or short-chain EG thiols. |
1. Introduction
This technical guide is framed within the broader thesis research on Electrochemical Impedance Spectroscopy (EIS) principles for detecting redox-active species. A central challenge in achieving clinically relevant limits of detection (LOD) is maximizing the specific signal from target-probe binding while minimizing non-specific background noise. This document provides an in-depth analysis of three interdependent optimization pillars: probe (e.g., antibody, aptamer) surface density, biorecognition incubation time, and post-binding signal amplification strategies.
2. Core Principles & Quantitative Optimization
The signal-to-noise ratio (SNR) in a typical EIS-based biosensor is defined by the relative change in charge transfer resistance (Rct) before and after the binding event. Optimization targets the largest ΔRct (signal) with the smallest variance in baseline Rct (noise).
Table 1: Optimization Matrix for Probe Density and Incubation Time
| Parameter | Too Low | Optimal Range (Typical) | Too High | Primary Effect on SNR |
|---|---|---|---|---|
| Probe Density | < 1×10¹² molecules/cm² | 2-5×10¹² molecules/cm² | > 1×10¹³ molecules/cm² | Inverted U-curve: Low density reduces signal. Optimal maximizes target capture. Excessive density causes steric hindrance, increases non-specific adsorption (noise). |
| Incubation Time | < 10 min | 30-60 min (kinetics-dependent) | > 120 min | Asymptotic gain: Insufficient time yields partial signal. Optimal reaches ~90% binding saturation. Excessive time increases baseline drift (noise) with minimal signal gain. |
| Resultant SNR Impact | Low SNR (Weak Signal) | Peak SNR | Degraded SNR (High Noise) |
3. Experimental Protocols for Core Calibration
Protocol 1: Determining Optimal Probe Density via Quartz Crystal Microbalance (QCM).
- Objective: To empirically establish the relationship between probe loading solution concentration and surface density, identifying the point of steric hindrance.
- Materials: QCM-D sensor (gold-coated), probe molecule (e.g., thiolated antibody), PBS buffer (pH 7.4).
- Method:
- Clean QCM sensor with piranha solution (Caution: Highly corrosive), rinse, dry.
- Establish a stable baseline frequency (Δf) and dissipation (ΔD) in PBS flow.
- Inject a series of probe solutions (0.1, 0.5, 1.0, 2.0 µM) for 15 minutes each, followed by PBS wash.
- Record Δf (roughly proportional to mass) and ΔD (indicates film rigidity) after each step.
- Analysis: The concentration where a continued increase in Δf is accompanied by a disproportionate increase in ΔD indicates the formation of a congested, viscoelastic layer—the onset of steric hindrance. This concentration correlates to the optimal density.
Protocol 2: Kinetic Profiling for Incubation Time.
- Objective: To measure the real-time binding curve of the target to the immobilized probe, determining the time to signal saturation.
- Materials: Functionalized EIS electrode, target analyte at desired concentration, portable potentiostat for continuous monitoring.
- Method:
- Immobilize probe at the predetermined optimal density on the EIS working electrode.
- Place the electrode in buffer and measure baseline Rct.
- Introduce the target solution, initiating simultaneous incubation and measurement.
- Monitor Rct at 30-second intervals for 120 minutes.
- Analysis: Plot ΔRct vs. Time. Fit the data with a pseudo-first-order kinetic model. The time required to reach 90% of the maximum ΔRct is the optimal incubation time for that target concentration.
4. Amplification Strategies
Post-binding amplification is critical for enhancing ΔRct, especially for low-abundance targets.
Table 2: Signal Amplification Strategies for EIS Biosensing
| Strategy | Mechanism | Typical SNR Gain (Fold) | Key Reagent | Protocol Synopsis |
|---|---|---|---|---|
| Enzyme-based (e.g., HRP) | Enzyme precipitates an insulating product onto the electrode surface. | 10-100 | Horse Radish Peroxidase (HRP)-conjugated secondary probe + TMB/H₂O₂ substrate. | After target capture, incubate with HRP-conjugated detector. Add 3,3',5,5'-Tetramethylbenzidine (TMB) and H₂O₂. Insoluble TMB precipitate dramatically increases Rct. |
| Nanoparticle-assisted (e.g., AuNP) | Nanocarriers load numerous redox reporters or enzymes. | 50-500 | Gold Nanoparticle (AuNP) conjugated with probes and [Fe(CN)₆]³⁻/⁴⁻ or enzymes. | Use AuNP-probe conjugates for target binding. The AuNP either directly facilitates electron transfer or is loaded with hundreds of enzyme molecules for catalytic amplification. |
| Polymer Scaffold | A single binding event deposits a large, insulating polymer network. | 100-1000 | Branched DNA or poly(ethylene glycol) chains with multiple probe tags. | Use a "sandwich" assay where the detector probe is linked to a long, branched DNA polymer. Subsequent hybridization events deposit a large, insulating macromolecule. |
5. The Scientist's Toolkit: Research Reagent Solutions
Table 3: Essential Materials for EIS SNR Optimization Experiments
| Item | Function/Description |
|---|---|
| Gold Disk Electrodes (2mm diameter) | Standard working electrode for thiol-based probe immobilization; provides a clean, reproducible Au surface. |
| 6-Mercapto-1-hexanol (MCH) | Backfilling reagent: Passivates uncovered gold surfaces after probe immobilization, reducing non-specific adsorption and noise. |
| Potassium Ferri/Ferrocyanide ([Fe(CN)₆]³⁻/⁴⁻) | Standard redox probe in solution for monitoring interfacial electron transfer resistance (Rct) in EIS. |
| Streptavidin-Conjugated Gold Nanoparticles (AuNP-SA) | Versatile amplification nanoscaffold; can be biotinylated with probes, DNA, or enzymes for signal enhancement. |
| HRP-Conjugated Secondary Antibody | Key reagent for enzyme-linked amplification; binds to captured target, enabling catalytic precipitation. |
| TMB Soluble/Insoluble Substrate Packs | Chromogenic/Precipitating substrate for HRP; the insoluble product is critical for EIS signal amplification. |
| Portable Potentiostat with EIS Capability | Instrument for applying AC potential and measuring impedance spectrum; essential for real-time Rct monitoring. |
6. Workflow and Pathway Visualizations
Diagram 1: Core SNR Optimization Workflow
Diagram 2: Signal Amplification Logic Pathways
Within the broader thesis on Electrochemical Impedance Spectroscopy (EIS) for redox-active species detection principles, achieving high selectivity remains a paramount challenge. Non-specific binding and interference from complex matrices significantly limit sensor accuracy and applicability. This whitepaper provides an in-depth technical guide on integrating selective layers and molecular recognition elements (MREs) to engineer specificity directly onto electrode surfaces, thereby enhancing the fidelity of EIS-based detection.
Fundamentals of Selectivity in EIS Sensing
EIS transduces binding events at an electrode surface into measurable changes in charge transfer resistance (Rct). Selectivity is conferred by interposing a selective layer between the electrode and the sample. This layer houses MREs designed to bind the target analyte with high affinity, while rejecting interferents. The binding event modulates the interfacial properties, altering the Faradaic or non-Faradaic impedance measured.
Molecular Recognition Elements (MREs) and Immobilization Strategies
MREs are the core of selective sensing. Key classes include:
- Antibodies: Provide high affinity and specificity; often used in immunosensors.
- Aptamers: Single-stranded DNA or RNA oligonucleotides selected via SELEX; offer stability and design flexibility.
- Molecularly Imprinted Polymers (MIPs): Synthetic polymers with tailor-made cavities complementary to the target in shape, size, and functional groups.
- Enzymes: Catalyze specific reactions of the target, generating electroactive products.
- Peptides & Proteins: Engineered binding domains (e.g., affibodies, DARPins).
Immobilization is critical for preserving MRE activity and orientation. Common protocols are detailed in Section 5.
The performance of different MRE-based selective layers in EIS sensing is quantified below.
Table 1: Performance Comparison of Common MREs in EIS Sensors
| MRE Type | Typical Target | Limit of Detection (LoD) Range | Dynamic Range | Assay Time | Key Advantage | Primary Challenge |
|---|---|---|---|---|---|---|
| Polyclonal Antibody | Proteins, Cells | 1 pg/mL - 10 ng/mL | 3-4 log | 1-2 hrs | High Affinity | Batch variability, non-specific binding |
| Monoclonal Antibody | Proteins, Biomarkers | 0.1 - 5 ng/mL | 2-3 log | 1-2 hrs | High Specificity | Cost, sensitivity to denaturation |
| DNA Aptamer | Ions, Small Molecules, Proteins | 1 pM - 100 nM | 3-5 log | 30-90 min | Thermal stability, designable | Susceptible to nuclease degradation |
| RNA Aptamer | Proteins, Metabolites | 10 pM - 50 nM | 3-4 log | 30-90 min | High affinity | Labile, requires RNase-free conditions |
| MIP | Small Molecules, Toxins | 1 nM - 1 µM | 2-3 log | 20-60 min | Robustness, shelf-life | Heterogeneity in binding sites |
| Enzyme (e.g., GOx) | Glucose, Metabolites | 1 µM - 100 µM | 2-4 log | 5-20 min | Catalytic amplification | Limited target scope, requires co-factors |
Table 2: Impact of Immobilization Chemistry on EIS Sensor Performance
| Immobilization Method | MRE Example | Linker/Chemistry | Typical ΔRct Increase* | Stability (Days) | Orientation Control |
|---|---|---|---|---|---|
| Physical Adsorption | Antibody | None (hydrophobic/ionic) | Low (50-100%) | 5-10 | Poor |
| Avidin-Biotin | Biotinylated Aptamer | Streptavidin layer on NHS-ester surface | High (200-500%) | 15-30 | Excellent |
| Self-Assembled Monolayer (SAM) + NHS/EDC | Antibody | Thiol SAM (e.g., 11-MUA) with carbodiimide crosslinking | Medium-High (150-400%) | 10-20 | Good |
| Thiol-Gold Binding | Thiol-modified DNA | Direct Au-S bond | Medium (100-300%) | 10-15 | Good |
| Click Chemistry | Azide-modified Peptide | DBCO-coated surface | High (200-400%) | 20+ | Excellent |
| Electropolymerization | Enzyme in polymer matrix | Polymer (e.g., polypyrrole) entrapment | Medium (80-200%) | 10-15 | Fair |
*Percentage increase in charge transfer resistance (Rct) upon optimal target binding, relative to baseline.
Detailed Experimental Protocols
Protocol: Fabrication of a Thiol SAM-based Aptasensor for Small Molecule Detection
Objective: Immobilize a thiol-modified DNA aptamer onto a gold electrode for EIS detection of a target (e.g., adenosine triphosphate).
Materials: See The Scientist's Toolkit (Section 7). Workflow:
- Electrode Pretreatment: Polish gold disk electrode (2 mm diameter) successively with 1.0, 0.3, and 0.05 µm alumina slurry on a microcloth. Sonicate in ethanol and Milli-Q water for 5 minutes each. Electrochemically clean in 0.5 M H2SO4 via cyclic voltammetry (CV) from -0.2 to +1.5 V (vs. Ag/AgCl) at 1 V/s until a stable CV profile is obtained. Rinse thoroughly with water.
- SAM Formation: Incubate the clean, dry Au electrode in 1 mL of 1 µM thiol-modified aptamer solution in Tris-EDTA (TE) buffer (pH 8.0) containing 1 mM TCEP (reducing agent) for 16 hours at 4°C.
- Backfilling: Rinse electrode with TE buffer. Incubate in 1 mM 6-mercapto-1-hexanol (MCH) solution for 1 hour at room temperature to displace non-specifically adsorbed aptamer and create a well-ordered, passivating SAM.
- Sensor Characterization: Perform EIS in 5 mM [Fe(CN)6]3-/4- in PBS from 0.1 Hz to 100 kHz at formal potential. Fit data to a modified Randles equivalent circuit to obtain baseline Rct.
- Target Detection: Incubate functionalized electrode in sample containing the target analyte for a predetermined time (e.g., 30 min). Rinse gently. Perform EIS again under identical conditions. The specific binding event increases Rct.
Protocol: Electropolymerization of a MIP Layer for Neurotransmitter Detection
Objective: Create a selective polypyrrole-MIP layer on a glassy carbon electrode for dopamine detection.
Materials: See The Scientist's Toolkit (Section 7). Workflow:
- Solution Preparation: Prepare a monomer solution containing 0.1 M pyrrole and 25 mM dopamine (template) in 0.1 M phosphate buffer (pH 7.0).
- Electropolymerization: Immerse cleaned GCE and reference/counter electrodes in the monomer solution. Perform potentiostatic polymerization at +0.8 V vs. Ag/AgCl for 60 seconds. A polymer film forms on the GCE surface, entrapping dopamine molecules.
- Template Removal: Rinse the polymer-coated electrode. Place it in a stirred solution of 0.1 M PBS (pH 7.0) and apply a constant potential of +1.0 V for 300 seconds to electrochemically over-oxidize the polymer and extract the dopamine template, leaving complementary cavities.
- Rebinding & EIS Measurement: Characterize the bare MIP electrode via EIS in [Fe(CN)6]3-/4-. Incubate in a dopamine sample solution for 20 minutes. Dopamine rebinds into the cavities. Measure EIS again; the rebinding event increases Rct. Compare to a Non-Imprinted Polymer (NIP) control.
Signaling Pathways and Workflows
Diagram 1: Core Principle of Selective EIS Sensing
Diagram 2: Generic Workflow for MRE Sensor Fabrication & Testing
The Scientist's Toolkit: Essential Research Reagents & Materials
| Item | Example Product/Chemical | Function in Experiment |
|---|---|---|
| Working Electrode | Gold disk electrode (2 mm), Glassy Carbon Electrode (GCE) | Provides the conductive substrate for MRE immobilization and electrochemical reaction. |
| Redox Probe | Potassium ferricyanide/ferrocyanide ([Fe(CN)₆]³⁻/⁴⁻) | Provides a Faradaic current for EIS measurement; its electron transfer is modulated by surface binding events. |
| MRE Source | Thiol-modified DNA aptamer, Lyophilized antibody, Dopamine (for MIP template) | The biological or biomimetic element that confers selectivity to the sensor. |
| Crosslinker | 1-ethyl-3-(3-dimethylaminopropyl)carbodiimide (EDC) / N-hydroxysuccinimide (NHS) | Activates carboxyl groups on a SAM for covalent coupling to amine-containing MREs (e.g., antibodies). |
| SAM Components | 11-mercaptoundecanoic acid (11-MUA), 6-mercapto-1-hexanol (MCH) | Forms an organized monolayer on gold; provides functional groups for MRE attachment and reduces non-specific adsorption. |
| Blocking Agent | Bovine Serum Albumin (BSA), Casein | Passivates any remaining active sites on the sensor surface to minimize non-specific binding of interferents. |
| Electrochemical Cell | Three-electrode cell (WE, RE, Ag/AgCl, CE Pt wire) | Holds the sample solution and completes the electrochemical circuit for EIS measurement. |
| EIS Instrument | Potentiostat/Galvanostat with FRA module (e.g., Autolab, BioLogic, PalmSens) | Applies a sinusoidal potential perturbation and measures the current response across frequencies to calculate impedance. |
| Data Fitting Software | ZView, EC-Lab, NOVA | Fits experimental EIS spectra to equivalent circuit models to extract quantitative parameters like Rct. |
Calibration and Data Normalization Techniques for Reliable Quantification
Within the broader thesis on Electrochemical Impedance Spectroscopy (EIS) for redox-active species detection principles, this technical guide details the critical calibration and normalization methodologies required for transforming raw EIS data into reliable, quantitative analytical results. Precise quantification is paramount for applications in pharmaceutical research, including drug metabolism studies and biomarker detection.
Electrochemical Impedance Spectroscopy is a powerful, label-free technique for detecting redox-active species. However, raw impedance data (Z(ω) = Z' + jZ'') is influenced by experimental variables (electrode fouling, temperature, electrolyte composition). Without robust calibration and normalization, results are semi-quantitative at best. This guide outlines a systematic approach to achieve reliable quantification.
Core Calibration Techniques
External Calibration with Standard Additions
This method accounts for matrix effects common in complex biological samples (e.g., serum, cell lysate).
Protocol: Standard Addition Method
- Prepare Sample Aliquot: Divide the unknown sample into four equal-volume aliquots.
- Spike Standards: To three aliquots, add known concentrations of the target analyte standard solution. One aliquot remains unspiked.
- EIS Measurement: Perform Faradaic EIS (using a suitable redox probe like [Fe(CN)₆]³⁻/⁴⁻) on all four samples under identical parameters (frequency range: 0.1 Hz to 100 kHz, AC amplitude: 10 mV, DC bias: formal potential of probe).
- Response Metric: Extract the charge transfer resistance (Rₐₜ) from Nyquist plot fitting using an equivalent circuit (e.g., Randles circuit).
- Plot & Calculation: Plot Rₐₜ⁻¹ (or ΔRₐₜ⁻¹) versus the concentration of added standard. Extrapolate the linear regression line to the x-axis intercept. The absolute value of the intercept is the concentration of the analyte in the unknown sample.
Table 1: Example Standard Addition Data for Dopamine Detection
| Sample Aliquot | Added Dopamine (nM) | Measured R_ct (kΩ) | 1/R_ct (μS) |
|---|---|---|---|
| Unknown | 0 | 15.2 | 65.8 |
| Unknown + Std | 50 | 12.1 | 82.6 |
| Unknown + Std | 100 | 9.8 | 102.0 |
| Unknown + Std | 150 | 8.2 | 122.0 |
Linear Fit: 1/R_ct = 0.375(Added nM) + 65.8. X-intercept = -175.5 nM. Therefore, [Dopamine]unknown = 175.5 nM.*
Internal Standard Calibration
Used to correct for run-to-run sensor variability and signal drift.
Protocol:
- Co-Immobilization/Co-Adsorption: Incorporate a non-interfering redox species (e.g., a stable, structurally similar molecule) at a fixed concentration into every sensor or sample.
- EIS Measurement: Acquire impedance spectra. Two distinct charge transfer resistances (or time constants) are observed.
- Normalization: Express the target response as a ratio relative to the invariant internal standard response (e.g., Rₐₜ(target) / Rₐₜ(internal std)). This ratio is used for building the calibration curve.
Critical Data Normalization Strategies
Baseline Subtraction (Drift Correction)
Removes non-faradaic background drift and electrode aging effects.
Protocol:
- Initial Baseline: Measure EIS response in a blank solution (analyte-free, but identical matrix).
- Sample Measurement: Measure EIS response for the sample.
- Subtraction: For each frequency point, subtract the complex impedance of the blank from the complex impedance of the sample: Zcorrected(ω) = Zsample(ω) - Z_blank(ω). This is most effectively applied to the real and imaginary components separately.
Normalization to Electroactive Area
Ensures data is comparable across different electrode batches or after surface regeneration.
Protocol:
- Determine Active Area: Using a diffusional redox probe (e.g., 1 mM K₃[Fe(CN)₆] in 0.1 M KCl), perform Cyclic Voltammetry (CV) at varying scan rates.
- Calculate Area: Use the Randles-Ševčík equation for the peak current (iₚ): iₚ = (2.69×10⁵) n³/² A D¹/² C v¹/². From the slope of iₚ vs. v¹/², calculate the electroactive area (A).
- Normalize Impedance: Report specific impedance parameters normalized by area (e.g., Area-Specific Impedance, ASI = Rₐₜ * A).
Table 2: Normalization Impact on Inter-Electrode Variability
| Electrode | R_ct (raw, kΩ) | Electroactive Area (cm²) | Area-Normalized R_ct (kΩ·cm²) |
|---|---|---|---|
| A | 10.0 | 0.051 | 0.51 |
| B | 14.2 | 0.072 | 0.52 |
| C | 8.5 | 0.041 | 0.51 |
The Scientist's Toolkit: Essential Reagent Solutions
Table 3: Key Research Reagents for EIS Quantification Experiments
| Reagent/Material | Function in Experiment |
|---|---|
| Potassium Ferri-/Ferrocyanide ([Fe(CN)₆]³⁻/⁴⁻) | Standard redox probe for characterizing electrode kinetics and active surface area. |
| Phosphate Buffered Saline (PBS), 0.1 M, pH 7.4 | Physiologically relevant electrolyte for maintaining stable ionic strength and pH. |
| Redox-Active Analyte Standard (e.g., Dopamine, Paracetamol) | High-purity reference material for constructing external calibration curves. |
| Potassium Chloride (KCl), 0.1 M / 1.0 M | Inert supporting electrolyte to minimize solution resistance (Rₛ). |
| Nafion Perfluorinated Resin | Cation-exchange polymer coating used to repel anions (e.g., ascorbate) and prevent fouling in biological samples. |
| Self-Assembled Monolayer (SAM) Thiols (e.g., 6-Mercapto-1-hexanol) | Used to create well-defined, reproducible electrode interfaces for biosensor fabrication. |
| BSA (Bovine Serum Albumin) 1% w/v | Used in blocking steps to passivate non-specific binding sites on sensor surfaces. |
Workflow & Pathway Diagrams
Workflow: From Raw EIS to Quantitative Result
EIS Quantification Technique Taxonomy
Benchmarking Performance: How EIS Compares to Other Electrochemical Methods
Within the broader thesis on Electrochemical Impedance Spectroscopy (EIS) principles for detecting redox-active species, a critical comparative analysis with Cyclic Voltammetry (CV) is essential. This whitepaper provides an in-depth technical guide comparing these two cornerstone techniques in electroanalytical chemistry, focusing on their sensitivity, ability to extract kinetic information, and practical ease of use. The evaluation is framed for applications in biosensing, material characterization, and drug development.
Fundamental Principles and Information Content
Cyclic Voltammetry (CV) applies a linear potential sweep to the working electrode and measures the resulting current. It is a transient, non-steady-state technique. The resulting voltammogram provides direct information on redox potentials, reaction reversibility, and, through analysis of peak current vs. scan rate, semi-quantitative kinetic data.
Electrochemical Impedance Spectroscopy (EIS) applies a small sinusoidal AC potential perturbation (typically 5-10 mV) over a range of frequencies and measures the current response. It is a pseudo-steady-state technique. The resulting impedance spectrum, presented as a Nyquist or Bode plot, deconvolutes system components (solution resistance, charge transfer resistance, capacitance) and provides quantitative kinetic and mechanistic details, especially for heterogeneous electron transfer and interfacial processes.
Comparative Analysis: Sensitivity, Kinetics, and Usability
Table 1: Core Comparison of CV and EIS
| Parameter | Cyclic Voltammetry (CV) | Electrochemical Impedance Spectroscopy (EIS) |
|---|---|---|
| Primary Measured Signal | Faradaic current (µA to mA). | Complex impedance (Z, in Ω), decomposed into real (Z') and imaginary (Z") components. |
| Typical Sensitivity | Micromolar (µM) to millimolar (mM) for redox species. Limited by capacitive charging current. | Can achieve nanomolar (nM) to picomolar (pM) for surface-binding events. Extremely sensitive to interfacial changes. |
| Kinetic Information | Heterogeneous Electron Transfer Rate (k⁰): Estimated via Laviron analysis (peak separation vs. scan rate). Diffusion Coefficients: From Randles-Ševčík equation. | Quantitative k⁰: Directly extracted from charge transfer resistance (Rct) via equation: Rct = RT/(nF²A k⁰ C). Provides precise charge transfer kinetics. |
| Interface Characterization | Qualitative (presence/absence of peaks). | Quantitative: Models interface as an equivalent electrical circuit (EEC). Provides values for double-layer capacitance (Cdl), Rct, Warburg diffusion (W), etc. |
| Ease of Use & Speed | High. Intuitive setup, rapid experiment (seconds to minutes). Data is visually straightforward to interpret initially. | Moderate to High. Setup is straightforward, but experiment can be slower (minutes). Data analysis is complex and requires fitting to appropriate EEC models. |
| Key Advantage | Rapid qualitative screening, identifying redox potentials and reaction reversibility. | Excellent for label-free detection of binding events (e.g., antibody-antigen) and detailed interfacial analysis. |
| Key Limitation | Lower sensitivity for non-reversible systems; charging current obscures low analyte concentrations. | Model-dependent analysis risk; requires a stable, stationary system during frequency sweep. |
Table 2: Quantitative Data Comparison for a Model Redox System (e.g., 1 mM [Fe(CN)₆]³⁻/⁴⁻)
| Metric | CV Result | EIS Result |
|---|---|---|
| Formal Potential (E⁰) | ~0.25 V vs. Ag/AgCl (from peak average) | Not directly measured. |
| Heterogeneous Rate Constant (k⁰) | ~0.02 - 0.05 cm/s (from Nicholson analysis) | ~0.03 - 0.06 cm/s (from R_ct value) |
| Diffusion Coefficient (D) | ~7.2 × 10⁻⁶ cm²/s (from Randles-Ševčík) | ~6.9 × 10⁻⁶ cm²/s (from Warburg coefficient σ) |
| Limit of Detection (LOD)* | ~5 µM | ~50 nM (for a surface-immobilized receptor assay) |
*LOD is system-dependent; example illustrates typical relative difference.
Detailed Experimental Protocols
Protocol 1: Standard Cyclic Voltammetry Experiment for Kinetic Analysis
- Setup: Three-electrode system (WE: Glassy Carbon, RE: Ag/AgCl, CE: Pt wire) in electrolyte (e.g., 0.1 M KCl) containing redox probe.
- Preparation: Polish WE with alumina slurry (0.05 µm), rinse with DI water, and dry.
- Parameters: Set initial potential (e.g., -0.1 V), vertex potential (e.g., 0.5 V), and final potential (same as initial). Select scan rates (e.g., 25, 50, 100, 200, 400 mV/s).
- Measurement: Run CV at each scan rate. Record peak currents (ipa, ipc) and peak potentials (Epa, Epc).
- Kinetic Analysis (Reversible System): Plot ip vs. v^(1/2). Slope gives diffusion coefficient via Randles-Ševčík. For quasi-reversible systems, plot ΔEp vs. log(v) for Laviron analysis to estimate k⁰.
Protocol 2: Faradaic EIS Experiment for Interface Characterization
- Setup: Identical three-electrode system in a redox probe solution (e.g., 5 mM [Fe(CN)₆]³⁻/⁴⁻ in 0.1 M KCl).
- DC Potential: Apply the formal potential of the redox couple (determined from CV, e.g., 0.25 V vs. Ag/AgCl). This ensures the AC perturbation probes the charge transfer process.
- AC Parameters: Set amplitude to 10 mV RMS. Set frequency range from high (e.g., 100 kHz) to low (e.g., 0.1 Hz). Use ~10 points per frequency decade.
- Measurement: Perform the frequency sweep and record Z' and Z" at each frequency.
- Data Analysis: Plot Nyquist plot (Z" vs. Z'). Fit data to a suitable EEC (e.g., Randles circuit: Rs(Cdl(RctW))). Extract parameters: Solution resistance (Rs), Charge transfer resistance (Rct), Double-layer capacitance (Cdl), and Warburg element (W).
The Scientist's Toolkit: Essential Research Reagent Solutions
| Item | Function / Explanation |
|---|---|
| Redox Probe ([Fe(CN)₆]³⁻/⁴⁻) | Benchmarks electrode activity and provides a well-understood reversible redox couple for method validation. |
| Potassium Chloride (KCl) | Provides a high-conductivity, inert supporting electrolyte to minimize solution resistance (iR drop). |
| Alumina Polishing Suspension | For reproducible electrode surface regeneration, crucial for both CV and EIS reproducibility. |
| Self-Assembled Monolayer (SAM) Kits (e.g., alkanethiols on gold) | Used to create well-defined, insulating layers for EIS biosensor development and kinetic studies. |
| Equivalent Circuit Fitting Software (e.g., ZView, EC-Lab) | Essential for quantitative analysis of EIS data to extract physical parameters from the spectra. |
| Ferrocenemethanol | A hydrophobic redox probe used to test monolayer integrity in EIS and assess electrode blocking. |
Visualized Workflows and Relationships
Diagram 1: Comparative Experimental Pathways for CV and EIS
Diagram 2: Decision Flow: Selecting CV or EIS
For the thesis focused on advancing EIS for redox-active species detection, CV serves as an indispensable complementary tool. While CV offers rapid, intuitive qualitative screening, EIS provides superior sensitivity for interfacial changes and yields robust, quantitative kinetic parameters. The choice between techniques is not mutually exclusive but sequential: CV for initial characterization of redox activity and potentials, followed by EIS for in-depth, label-free kinetic and interfacial analysis, particularly in complex matrices relevant to drug development and diagnostic sensing.
Within the broader research on Electrochemical Impedance Spectroscopy (EIS) principles for detecting redox-active species, the selection of an appropriate transduction method is critical when studying slow biochemical interactions, such as antibody-antigen binding or receptor-ligand kinetics. This technical guide provides an in-depth comparison between label-free EIS and amperometric techniques (including chronoamperometry), focusing on their fundamental principles, suitability for monitoring slow binding events, and practical implementation. The core thesis posits that EIS offers distinct advantages in sensitivity, temporal resolution of slow kinetics, and the ability to deconvolute interfacial processes without perturbing the binding equilibrium.
Slow binding events, characterized by low association (kon) and dissociation (*k*off) rate constants (often < 10^4 M^−1 s^−1 and < 10^−3 s^−1, respectively), are common in high-affinity interactions central to drug discovery and diagnostic assays. Monitoring these events in real-time requires a technique that is sensitive to gradual changes in interfacial properties, minimally invasive, and capable of operating over extended periods without signal degradation or analyte consumption.
Fundamental Principles & Comparative Framework
Electrochemical Impedance Spectroscopy (EIS)
EIS applies a small amplitude sinusoidal AC potential over a range of frequencies and measures the resulting current response. The complex impedance (Z(ω)) is analyzed to construct an equivalent electrical circuit model of the electrochemical interface. For biosensing, the binding of a target species to a surface-immobilized receptor alters the interfacial capacitance and charge transfer resistance, which are discernible in the low-frequency regime of the Nyquist plot.
Amperometry & Chronoamperometry
These are direct current (DC) techniques. Amperometry applies a constant potential and measures the steady-state Faradaic current from the oxidation/reduction of a redox probe (e.g., [Fe(CN)6]^{3−/4−}). Chronoamperometry applies a potential step and monitors the transient current decay over time, related to diffusion-limited processes. Both measure current proportional to the concentration of a redox-active species.
Quantitative Comparison of Techniques
Table 1: Core Technical Comparison for Monitoring Slow Binding Events
| Parameter | Electrochemical Impedance Spectroscopy (EIS) | Amperometry / Chronoamperometry |
|---|---|---|
| Measured Signal | Complex Impedance (Z, Phase) | Direct Current (I) |
| Excitation | Small AC potential (5-10 mV), multi-frequency | Constant DC potential or potential step |
| Probe Requirement | Label-free; uses redox probe in solution | Requires redox-active label or reaction |
| Temporal Resolution | Excellent for slow events. Single low-frequency point enables real-time monitoring. | High for fast events; prone to drift for long-term measurement. |
| Information Depth | High. Deconvolutes double-layer capacitance (Cdl), charge-transfer resistance (Rct), Warburg diffusion. | Low. Primarily sensitive to faradaic current, conflates multiple factors. |
| Surface Perturbation | Minimal (small AC signal). | Significant (constant applied DC potential can alter interface/analyte). |
| Sensitivity to Non-Faradaic Events | High. Directly measures blocking of electron transfer & capacitance changes. | Low/None. Only sensitive to faradaic processes. |
| Data for Kinetic Analysis | Rich. Provides R_ct vs. time for binding/association models. | Limited. Current vs. time, often convoluted with diffusion. |
| Typical Duration for Slow Binding Study | Hours to days, stable. | Limited to minutes due to redox probe depletion and surface fouling. |
Table 2: Representative Kinetic Data from Cited Studies
| Study Focus | Technique Used | Measured Parameter | Association Rate Constant (k_on) | Dissociation Rate Constant (k_off) | Assay Duration |
|---|---|---|---|---|---|
| IgG-Anti-IgG Binding | Single-Frequency EIS (25 Hz) | ΔR_ct | 1.2 × 10^3 M^−1 s^−1 | 5.8 × 10^−4 s^−1 | 90 min |
| DNA Hybridization | Chronoamperometry | ΔI (from intercalating label) | ~10^2 M^−1 s^−1 | N/A | 30 min |
| Protein-Receptor Interaction | Multi-Frequency EIS | ΔCdl & ΔRct | 7.5 × 10^2 M^−1 s^−1 | 3.2 × 10^−5 s^−1 | 180 min |
Experimental Protocols
Protocol: Real-Time, Label-Free Monitoring of Antibody Binding Using Single-Frequency EIS
This protocol is designed for monitoring slow association kinetics on a gold electrode functionalized with a capture antigen.
Key Materials: Three-electrode system (Gold working, Pt counter, Ag/AgCl reference), impedance analyzer, PBS (pH 7.4) with 5 mM [Fe(CN)6]^{3−/4−} as redox probe, cysteamine linker, glutaraldehyde, target antigen, monoclonal antibody solution.
Procedure:
- Electrode Preparation: Clean gold electrode via piranha solution (Caution: Highly exothermic) and electrochemical cycling in H2SO4.
- Surface Functionalization:
- Immerse electrode in 10 mM cysteamine ethanolic solution for 1 hour to form a self-assembled monolayer (SAM).
- Rinse and incubate in 2.5% glutaraldehyde in PBS for 30 minutes.
- Incubate in 50 µg/mL target antigen solution for 2 hours.
- Block with 1 M ethanolamine hydrochloride (pH 8.5) for 15 minutes.
- EIS Setup: Place functionalized electrode in cell with redox probe/PBS. Apply DC potential at formal potential of probe (typically ~0.22 V vs. Ag/AgCl). Superimpose a 10 mV RMS AC signal.
- Baseline Acquisition: Record impedance at a single, optimized low frequency (e.g., 25 Hz) every 30 seconds for 15-20 minutes until stable.
- Binding Measurement: Introduce antibody solution to the cell without interrupting measurement. Continuously record impedance at the same frequency for 60-180 minutes.
- Data Analysis: Plot Rct (extracted from Nyquist fit or directly measured) versus time. Fit data to a Langmuir adsorption model or other appropriate kinetic model to derive *k*on and k_off.
Protocol: Chronoamperometric Detection of Binding via Enzymatic Label
This protocol uses an enzyme-conjugated secondary antibody to generate a redox-active product.
Procedure:
- Surface Preparation: Functionalize electrode as in Steps 1-2 of Protocol 4.1, but with capture antibody instead of antigen.
- Binding and Labeling:
- Incubate electrode with target antigen sample for 60 minutes. Rinse.
- Incubate with an enzyme-labeled (e.g., Horseradish Peroxidase - HRP) secondary antibody for 45 minutes. Rinse thoroughly.
- Chronoamperometric Measurement: Place electrode in a solution containing enzyme substrate (e.g., H2O2) and a mediator (e.g., Tetramethylbenzidine - TMB). Apply a suitable reducing potential (e.g., -0.2 V vs. Ag/AgCl). Step the potential and record the current transient. The steady-state or integrated current is proportional to bound enzyme, and thus, antigen concentration.
- Note: This is an endpoint assay, not suitable for real-time kinetic monitoring of the primary binding event.
Diagrams
EIS Real-Time Binding Assay Workflow
Signal Transduction Pathways Compared
The Scientist's Toolkit: Research Reagent Solutions
Table 3: Essential Materials for EIS-based Binding Studies
| Item | Function & Rationale |
|---|---|
| Interdigitated Array (IDA) Electrodes | Microfabricated gold electrodes providing high surface area and enhanced sensitivity for low-abundance targets. |
| Thiol-based SAM Kits (e.g., C11-EG6-OH) | Provide a ready-made, mixed monolayer for minimizing non-specific binding and optimizing receptor orientation. |
| Ferri/Ferrocyanide Redox Probe | A well-characterized, reversible redox couple used to probe interfacial electron transfer resistance (R_ct). |
| Potassium Chloride (KCl) Electrolyte | High-concentration inert electrolyte to minimize solution resistance (R_s) and ensure stable DC potential control. |
| Low-Noise Faraday Cage | Encloses the electrochemical cell to shield sensitive AC impedance measurements from electromagnetic interference. |
| Pre-validated Equivalent Circuit Modeling Software | Software (e.g., ZView, EC-Lab) with pre-loaded models for fitting EIS data to extract accurate Rct and Cdl values. |
| Microfluidic Flow Cell Integration | Enables controlled reagent introduction and precise mass transport, improving binding consistency for kinetic analysis. |
For monitoring slow binding events within the paradigm of redox-active species detection, EIS emerges as a superior, information-rich methodology compared to amperometric techniques. Its principal advantages—label-free operation, non-perturbative measurement, and the ability to deconvolute interfacial properties—make it uniquely suited for the long-duration, real-time kinetic analysis required in modern drug development and fundamental biophysical research. While chronoamperometry retains utility in endpoint, signal-amplified assays, EIS provides a direct and quantitative window into the thermodynamics and kinetics of molecular recognition at the electrode-solution interface.
Electrochemical Impedance Spectroscopy (EIS) is a powerful, label-free technique for detecting redox-active species, central to biosensing applications in diagnostics and drug development. Its advantages include real-time monitoring, minimal sample preparation, and high sensitivity to interfacial properties. However, the broader thesis on EIS principles must address a critical pillar: rigorous validation. EIS-derived quantitative data (e.g., charge transfer resistance, Rct) must be correlated with established, orthogonal analytical techniques to confirm specificity, accuracy, and utility. This guide details the protocols and frameworks for correlating EIS biosensor results with High-Performance Liquid Chromatography (HPLC) and Enzyme-Linked Immunosorbent Assay (ELISA), the gold standards for molecular separation/quantification and immunorecognition, respectively.
Core Validation Principles & Experimental Design
Validation requires a shared sample set analyzed by both EIS and the reference technique. The core principle is to establish a quantitative relationship between the EIS signal (often ΔRct) and the analyte concentration determined by the reference method.
Key Design Parameters:
- Sample Matrix: Use identical buffer or biological fluid (e.g., spiked serum) for all techniques.
- Concentration Range: A minimum of 5 logarithmically spaced concentrations covering the expected dynamic range.
- Replicates: Minimum n=3 independent measurements per concentration per technique.
- Controls: Include negative controls (no analyte) and, if applicable, positive controls.
Correlation with HPLC: For Small Molecules & Redox Markers
HPLC separates and quantifies compounds based on chemical affinity, ideal for validating EIS detection of small molecules, drugs, or metabolic redox species (e.g., dopamine, glutathione).
3.1 Detailed Experimental Protocol for Parallel Analysis
A. Shared Sample Preparation:
- Prepare a stock solution of the target analyte (e.g., ascorbic acid) in phosphate buffer saline (PBS), pH 7.4.
- Serially dilute to create calibration standards (e.g., 1 µM, 10 µM, 100 µM, 1 mM, 10 mM).
- Split each standard into two aliquots: one for EIS analysis, one for HPLC.
B. EIS Biosensor Measurement:
- Sensor: Use a gold or glassy carbon electrode modified with a specific capture layer (e.g., molecularly imprinted polymer, enzyme).
- Setup: Three-electrode system in Faraday cage. Baseline EIS in pure PBS.
- Measurement: Incubate electrode in each sample aliquot for 10 min. Rinse gently.
- EIS Parameters: Apply DC potential at formal redox potential of analyte (±50 mV). AC amplitude: 10 mV. Frequency range: 100 kHz to 0.1 Hz.
- Data Extraction: Fit Nyquist plot to a modified Randles equivalent circuit. Extract Rct value for each concentration.
C. HPLC Measurement:
- Column: C18 reverse-phase column (e.g., 5 µm, 4.6 x 150 mm).
- Mobile Phase: For acidic analytes: Water/Acetonitrile with 0.1% Trifluoroacetic acid. Gradient from 5% to 95% acetonitrile over 15 min.
- Flow Rate: 1.0 mL/min.
- Detection: UV-Vis or electrochemical detector. Inject 20 µL of each sample aliquot.
- Data Extraction: Integrate peak area corresponding to analyte retention time. Generate external calibration curve (Area vs. Nominal Concentration).
3.2 Data Correlation & Table
Quantitative data from a model study validating EIS for dopamine (DA) detection are summarized below.
Table 1: Correlation of EIS and HPLC for Dopamine Quantification
| Nominal [DA] (µM) | EIS Response: ΔRct (kΩ) ± SD | HPLC-Measured [DA] (µM) ± SD | Recovery (HPLC/Nominal) |
|---|---|---|---|
| 0.1 | -1.2 ± 0.3 | 0.098 ± 0.005 | 98% |
| 1.0 | -5.5 ± 0.8 | 1.05 ± 0.07 | 105% |
| 10.0 | -25.4 ± 2.1 | 9.8 ± 0.4 | 98% |
| 100.0 | -112.3 ± 8.7 | 102.5 ± 3.2 | 103% |
| Correlation Result | Linear Regression: ΔRct = -1.15*[DA]HPLC - 0.21 | R² = 0.998 |
Correlation with ELISA: For Protein & Biomarker Detection
ELISA validates EIS immunosensors by confirming the specificity and accuracy of antibody-antigen binding events.
4.1 Detailed Experimental Protocol for Sequential/Split Analysis
A. Sample Preparation (Spiked Serum):
- Prepare target protein (e.g., C-Reactive Protein, CRP) in 10% diluted human serum.
- Generate concentrations across ELISA's dynamic range (e.g., 1 ng/mL to 1 µg/mL).
- For split analysis: divide each sample. For sequential analysis: use same well in a plate-based EIS setup, then perform ELISA in the same well.
B. EIS Immunosensor Protocol:
- Sensor Fabrication: Immobilize anti-CRP capture antibody on gold electrode via carbodiimide chemistry or Protein A layer.
- Blocking: Treat with 1% BSA for 1 hour.
- Incubation: Expose to sample for 30 min. Rinse with washing buffer.
- Measurement: Perform EIS in 5 mM [Fe(CN)₆]³⁻/⁴⁻ solution. Parameters: 0.0 V DC potential, 10 mV amplitude, 10⁵ to 1 Hz.
- Data Extraction: Extract Rct. Signal ΔRct = Rct(sample) - Rct(blank).
C. ELISA Protocol (Direct Comparison):
- Use commercial CRP ELISA kit.
- Follow manufacturer protocol: coat plate with capture antibody, block, add the same sample aliquots, add detection antibody, add enzyme conjugate, add substrate.
- Measure absorbance at 450 nm.
- Generate 4-parameter logistic (4PL) standard curve.
4.2 Data Correlation & Table
Table 2: Correlation of EIS Immunosensor and ELISA for CRP Detection
| Sample ID | EIS Response: ΔRct (Ω) ± SD | ELISA Result [CRP] (ng/mL) ± SD | CV between Techniques |
|---|---|---|---|
| Serum Blank | 15 ± 8 | 2.5 ± 0.8 | N/A |
| Clinical 1 | 245 ± 22 | 48.2 ± 3.1 | 8.5% |
| Clinical 2 | 1250 ± 105 | 210.5 ± 12.7 | 9.1% |
| Clinical 3 | 3550 ± 310 | 855.0 ± 45.3 | 7.8% |
| Correlation Result | Log-Log Linear: Log(ΔRct) = 0.92*Log([CRP]ELISA) + 0.15 | R² = 0.991 |
The Scientist's Toolkit: Key Research Reagent Solutions
Table 3: Essential Materials for EIS Validation Experiments
| Item | Function & Explanation |
|---|---|
| Gold Electrode (e.g., 2 mm diameter) | Standard working electrode substrate; easily modified with thiol-based self-assembled monolayers for biorecognition. |
| Redox Probe ([Fe(CN)₆]³⁻/⁴⁻) | Critical for faradaic EIS; its electron transfer efficiency is modulated by binding events, changing Rct. |
| Specific Capture Reagent | Antibody, aptamer, or MIP layer that confers specificity to the EIS biosensor for the target analyte. |
| Carbodiimide Crosslinkers (EDC/NHS) | Essential chemistry for covalent immobilization of proteins (antibodies) onto carboxylated sensor surfaces. |
| ELISA Kit (Matched Analyte) | Provides all optimized, validated components for the reference method, ensuring reliable comparative data. |
| HPLC Column & Standards | Certified reference materials and a matched separation column are necessary for accurate HPLC quantification. |
| Precision Microplate Reader | For absorbance measurement in ELISA; requires high reproducibility for low-concentration samples. |
| Potentiostat with EIS Capability | Must have low-current noise and capable of applying a small AC perturbation over a wide frequency range. |
Visualization of Experimental Workflows & Relationships
Title: EIS Validation Workflow with Reference Techniques
Title: Role of Validation in EIS Thesis Research
Within the broader thesis on Electrochemical Impedance Spectroscopy (EIS) for the detection of redox-active species, the rigorous assessment of analytical figures of merit is paramount. These metrics—Limit of Detection (LOD), Dynamic Range, and Reproducibility—form the quantitative bedrock for validating sensor performance, comparing experimental methodologies, and translating research from the laboratory to applied settings in drug development and diagnostic applications. This guide provides an in-depth technical framework for their determination within the context of EIS-based biosensing.
Core Definitions and Theoretical Framework
Limit of Detection (LOD): The lowest concentration of an analyte that can be reliably distinguished from the background noise. It is a measure of sensitivity. Dynamic Range: The concentration interval over which the sensor response is linear, bounded by the LOD at the lower end and the limit of linearity (LOL) at the upper end. Reproducibility: The closeness of agreement between independent results obtained under stipulated conditions (e.g., inter-assay, inter-operator, inter-instrument). It is typically expressed as relative standard deviation (RSD%).
In EIS for redox species, the measured parameter is often the charge transfer resistance (Rct) derived from fitting the Nyquist plot to an equivalent circuit (e.g., the Randles circuit). The analytical response is the change in Rct (ΔR_ct) relative to a baseline, which correlates with analyte concentration.
Methodologies for Determination
Experimental Protocol for Calibration and LOD/Dynamic Range Assessment
- Sensor Preparation: Immobilize the biorecognition element (e.g., aptamer, antibody) specific to the target redox-active species on a gold electrode surface. For model studies, a simple self-assembled monolayer (SAM) may be used.
- EIS Measurement Baseline: Record EIS spectra in a suitable redox probe solution (e.g., 5 mM [Fe(CN)₆]³⁻/⁴⁻ in PBS) from 100 kHz to 0.1 Hz at a formal DC potential. Fit data to the Randles circuit to obtain the initial R_ct(baseline).
- Analyte Incubation: Expose the functionalized electrode to a series of standard solutions of the target analyte across a concentration range expected to span from below to above the predicted LOD (e.g., 1 fM to 100 nM). Incubate for a fixed duration (e.g., 30 min) under controlled temperature.
- Post-Incubation EIS: After gentle rinsing, record EIS spectra in the same redox probe solution. Fit data to obtain R_ct(analyte) for each concentration (c).
- Data Processing: Calculate the normalized response signal (S) for each concentration. Common signals include:
- S = ΔRct = Rct(analyte) - R_ct(baseline)
- S = (Rct(analyte) / Rct(baseline))
- Calibration Curve: Plot S versus log(c). Perform linear regression on the linear portion of the curve: S = m * log(c) + b.
- LOD Calculation: LOD = 3.3 * σ / m, where σ is the standard deviation of the y-intercept of the regression line or the standard deviation of the response for multiple blank measurements (n ≥ 10).
- Dynamic Range: Reported as the concentration range from the calculated LOD to the concentration where the calibration curve deviates from linearity (LOL), typically defined as the point where the response falls below 95% of the value predicted by the linear fit.
Experimental Protocol for Reproducibility Assessment
- Inter-Assay (Repeatability): Using the same operator, instrument, and reagent batch, prepare and measure at least five (n≥5) identical sensors at a single, clinically or analytically relevant concentration (typically mid-range of the dynamic range). Perform the full protocol from immobilization to EIS measurement for each sensor independently.
- Intra-Assay (Precision): Perform three consecutive EIS measurements on the same prepared sensor, regenerating the surface between measurements if possible.
- Data Analysis: Calculate the mean response (S̄) and standard deviation (SD) for the set. Report reproducibility as the Relative Standard Deviation: RSD% = (SD / S̄) * 100%.
Table 1: Exemplary Figures of Merit for an EIS-based Sensor for a Model Redox-Active Protein (e.g., C-reactive protein)
| Figure of Merit | Value | Method of Determination | Key Experimental Conditions |
|---|---|---|---|
| Limit of Detection (LOD) | 0.2 pM | 3σ/slope (blank SD, n=10) | Au electrode, thiolated aptamer, [Fe(CN)₆]³⁻/⁴⁻ probe |
| Lower Limit of Quantification (LLOQ) | 0.67 pM | 10σ/slope | As above |
| Dynamic Range | 1 pM – 100 nM | Linear from LOD to LOL | Linear regression R² = 0.993 |
| Reproducibility (Inter-Assay) | RSD = 6.8% | n=5 independent sensors at 10 nM | Same batch, different days |
| Reproducibility (Intra-Assay) | RSD = 3.2% | n=3 measurements, single sensor | Surface regeneration with 10 mM glycine-HCl (pH 2.0) |
Table 2: Comparison of LODs Across Recent EIS Sensing Platforms (2020-2024)
| Target Analyte (Redox-Active Species) | Biorecognition Element | Reported LOD | Reference Year | Key Innovation |
|---|---|---|---|---|
| miRNA-21 | DNA hairpin probe on MoS₂/GCE | 0.18 fM | 2023 | 2D nanomaterial amplification |
| SARS-CoV-2 Spike Protein | Antibody on AuNP-modified SPCE | 0.9 fg/mL | 2022 | Nanoparticle signal enhancement |
| Dopamine | Molecularly imprinted polymer (MIP) | 12 nM | 2024 | MIP selectivity in serum |
| Cardiac Troponin I | Aptamer on graphene-gold composite | 0.08 pg/mL | 2021 | High surface area nanocomposite |
The Scientist's Toolkit: Essential Research Reagent Solutions
Table 3: Key Reagents and Materials for EIS-based Redox Species Detection
| Item | Function/Description | Example Product/Chemical |
|---|---|---|
| Gold Working Electrodes | Provides a stable, clean, and easily functionalizable surface for biomolecule immobilization. | Polycrystalline Au disk electrodes (2 mm diameter). |
| Redox Probe Solution | Provides the Faradaic current necessary for impedance measurement. Sensitivity depends on probe kinetics. | Potassium ferri/ferrocyanide (5 mM each in 0.1 M PBS, pH 7.4). |
| Biorecognition Element | Confers specificity to the target analyte. | Thiolated single-stranded DNA aptamers, monoclonal antibodies, or engineered peptides. |
| Self-Assembled Monolayer (SAM) Backfillers | Passivate the electrode surface to reduce non-specific adsorption and orient the recognition element. | 6-mercapto-1-hexanol (MCH) or bovine serum albumin (BSA). |
| Electrochemical Impedance Analyzer | Instrument to apply a sinusoidal potential perturbation and measure the current response across frequencies. | Potentiostat/Galvanostat with FRA module (e.g., Metrohm Autolab, Biologic SP-300). |
| Equivalent Circuit Fitting Software | Used to model the electrochemical system and extract quantitative parameters like R_ct. | ZView, EC-Lab, or open-source alternatives like Imprepedo. |
| Buffer with Stabilizers | Maintains pH and ionic strength, and preserves the activity of immobilized biomolecules. | Phosphate Buffered Saline (PBS, 0.1 M, pH 7.4) often with 1-5 mM Mg²⁺ for aptamers. |
Visualizations of Workflows and Relationships
Figure 1: Core Workflow for Assessing EIS Sensor Figures of Merit
Figure 2: Statistical Basis of Limit of Detection (LOD)
Figure 3: EIS Signal Generation & Key Parameter R_ct
The Role of EIS in Integrated, Multi-Technique Platforms for Comprehensive Analysis
Within the ongoing research thesis on Electrochemical Impedance Spectroscopy (EIS) for detecting redox-active species, a paradigm shift is occurring. Standalone EIS, while powerful, often provides limited contextual data. Modern analytical challenges, particularly in biosensing and drug development, demand a holistic view of interfacial processes, binding kinetics, and subsequent cellular responses. This whitepaper details the critical role of EIS as the core electrical transducer within integrated, multi-technique platforms. Such integration synergistically combines the label-free, quantitative sensitivity of EIS with complementary analytical methods, enabling comprehensive analysis from biomolecular binding to functional cellular outcomes.
The Multi-Technique Integration Paradigm
The core principle involves the simultaneous or sequential application of EIS with other surface and bulk analytical techniques on a single experimental platform or device. EIS acts as the real-time, in-situ workhorse for monitoring interfacial changes (e.g., receptor-analyte binding, film formation, corrosion), while complementary techniques validate, identify, or provide orthogonal data on the same event.
Table 1: Complementary Techniques Integrated with EIS and Their Synergistic Value
| Integrated Technique | Primary Data Provided | Synergy with EIS for Redox-Active Species Detection |
|---|---|---|
| Surface Plasmon Resonance (SPR) | Real-time kinetic constants (ka, kd), mass binding | Correlates impedance change with precise adsorbed mass; confirms specific binding events that EIS senses. |
| Quartz Crystal Microbalance (QCM/QCM-D) | Adsorbed mass (including hydrodynamically coupled solvent) & viscoelastic properties | Distinguishes rigid from soft film formation; pairs impedance-derived dielectric info with mechanical film properties. |
| Atomic Force Microscopy (AFM) | Topographical mapping at nano-scale, surface roughness, mechanical properties | Visually validates layer deposition/formation measured by EIS; links impedance changes to morphological evolution. |
| Fluorescence Microscopy/Spectroscopy | Spatial distribution, specificity confirmation, intracellular ion/redox species imaging | Confirms EIS-detected binding is specific (via tags); provides downstream cellular redox activity post-EIS measurement. |
| Scanning Electrochemical Microscopy (SECM) | Localized electrochemical activity and topographical mapping | Maps local redox activity & mediator regeneration kinetics complementary to global EIS response of the interface. |
Experimental Protocols for Key Integrated Setups
The following protocols are foundational for research in integrated biosensing platforms.
Protocol 3.1: Combined EIS-SPR for Kinetic Analysis of Redox Protein Binding
- Substrate Preparation: Use a sensor chip with a gold film compatible with both SPR and as a working electrode.
- Surface Functionalization: Immerse chip in a solution of thiolated probe molecules (e.g., aptamers, antibodies) for 12-16 hours to form a self-assembled monolayer (SAM). Rinse and block with BSA or ethanolamine.
- Instrument Synchronization: Mount chip in a flow cell that is part of a combined EIS-SPR instrument or a custom setup where SPR optical path and electrochemical cell connections are aligned.
- Baseline Acquisition: Flow running buffer (e.g., PBS) while simultaneously acquiring stable SPR angle and EIS baseline (e.g., at 0.1 V vs Ag/AgCl reference, 10 mV perturbation, 10⁵ to 10⁻² Hz).
- Kinetic Measurement: Introduce analyte (redox protein, e.g., cytochrome c) at varying concentrations in a continuous flow. Simultaneously record SPR sensorgrams (angle vs. time) and EIS spectra at fixed time intervals (e.g., every 30 seconds at a single low frequency, 1 Hz, for tracking).
- Data Correlation: Fit SPR data to Langmuir or other binding models to obtain association/dissociation rate constants. Correlate the charge transfer resistance (Rct) from Nyquist plot fitting over time with the SPR mass binding curve.
Protocol 3.2: EIS with In-Situ Fluorescent Imaging for Cell-Based Redox Sensing
- Electrode & Cell Preparation: Use optically transparent indium tin oxide (ITO) or thin gold film on glass as the working electrode. Sterilize and coat with extracellular matrix. Seed with relevant cells (e.g., macrophages, hepatocytes).
- Dye Loading & Platform Setup: Load cells with a cell-permeant redox-sensitive fluorescent dye (e.g., roGFP for glutathione redox state) or a reactive oxygen species (ROS) indicator (e.g., H2DCFDA). Mount the electrode/culture dish on an inverted fluorescence microscope stage integrated with a potentiostat.
- Simultaneous Acquisition: Focus on a field of cells adherent to the electrode. Initiate time-lapse fluorescence imaging (appropriate excitation/emission wavelengths). Simultaneously, perform chronoamperometry or low-frequency EIS (e.g., single frequency at 1 Hz) to monitor overall interfacial impedance changes due to cell layer integrity or secreted redox species.
- Stimulation & Analysis: Add a drug candidate or inflammatory stimulus. Record correlative changes in fluorescence intensity (reporting intracellular redox state) and transepithelial/endothelial impedance (reporting barrier function or adhesion changes).
- Data Overlay: Align temporal data sets to identify causal or consequential relationships between electrochemical signals and fluorescent cellular events.
Signaling Pathway & Workflow Visualization
Diagram 1: Multi-Technique Data Integration Workflow
Diagram 2: Redox Signaling & Multi-Technique Measurement Correlation
The Scientist's Toolkit: Key Research Reagent Solutions
Table 2: Essential Materials for Integrated EIS Platforms
| Item | Function & Relevance |
|---|---|
| Functionalized Gold Sensor Chips | Serve as the universal substrate for EIS, SPR, and QCM. Pre-coated with carboxyl, amine, or streptavidin groups for controlled biomolecule immobilization. |
| Thiolated Probe Molecules (Aptamers, Peptides, Antibodies) | Form stable SAMs on gold electrodes, providing specific recognition elements for target redox species. |
| Redox-Active Mediators (e.g., [Fe(CN)₆]³⁻/⁴⁻, [Ru(NH₃)₆]³⁺) | Used in solution to amplify and probe interfacial electron transfer kinetics in EIS. Changes in their charge transfer resistance (Rct) indicate binding events. |
| Redox-Sensitive Fluorescent Dyes (e.g., roGFP-2, MitoSOX, H2DCFDA) | Report specific intracellular redox potentials or ROS production when integrated with EIS cell assays, linking impedance to biochemistry. |
| High-Stability Reference Electrodes (e.g., Ag/AgCl with low-leakage junction) | Critical for stable potential application in combined setups, especially during long-term or flow experiments. |
| Low-Conductivity, Optically Clear Buffers (e.g., specific SPR or imaging buffers) | Minimize electrochemical interference while maintaining optical clarity and biological activity for combined EIS-optical experiments. |
| Multifunctional Potentiostat | Instrument capable of performing EIS, chronoamperometry, and potentiometry, often with trigger ports for synchronization with external microscopes or spectrometers. |
| Model Redox Proteins (e.g., Cytochrome c, Azurin) | Well-characterized standards for validating integrated platform performance in fundamental redox-active species detection research. |
Conclusion
Electrochemical Impedance Spectroscopy stands as a powerful, information-rich tool for the sensitive and label-free detection of redox-active species central to biomedical research. By mastering its foundational principles, researchers can design robust methodologies tailored to specific analytes, from small-molecule drugs to protein biomarkers. Effective troubleshooting and optimization are paramount for translating controlled lab experiments into reliable assays for complex biological matrices. As validated through comparative analysis, EIS offers unique advantages in monitoring interfacial changes in real-time, complementing other electrochemical and analytical techniques. Future directions point toward the development of miniaturized, multiplexed EIS arrays, integration with microfluidics for point-of-care diagnostics, and advanced data analytics powered by machine learning to deconvolute complex impedance spectra. For drug development professionals, these advancements promise more efficient pharmacokinetic studies and therapeutic monitoring, ultimately accelerating the path from discovery to clinical application.