The Biphasic Dose-Response in Oxidative Stress: Hormesis Mechanisms, Research Methods, and Therapeutic Implications
This article provides a comprehensive analysis of the biphasic dose-response phenomenon in oxidative stress, a critical concept in toxicology and pharmacology.
The Biphasic Dose-Response in Oxidative Stress: Hormesis Mechanisms, Research Methods, and Therapeutic Implications
Abstract
This article provides a comprehensive analysis of the biphasic dose-response phenomenon in oxidative stress, a critical concept in toxicology and pharmacology. We first establish the foundational principles of hormesis, detailing how low-level oxidative stress can induce adaptive, protective responses (e.g., via Nrf2/ARE pathway activation), while high doses cause damage. Methodologically, we review cutting-edge techniques for measuring reactive oxygen species (ROS) and cellular redox status to characterize these biphasic curves. We then address common experimental challenges in reproducing and interpreting these non-linear responses and offer optimization strategies. Finally, we validate the concept through comparative analysis of known hormetic agents (e.g., phytochemicals, exercise) and discuss its transformative implications for designing novel therapeutics, including preconditioning strategies and low-dose interventions in neurodegeneration, cancer, and aging. This resource is tailored for researchers, toxicologists, and drug development professionals seeking to leverage hormesis for clinical innovation.
Understanding Hormesis: The Science Behind Low-Dose Benefit and High-Dose Toxicity in Oxidative Stress
The biphasic dose-response relationship, commonly termed hormesis, describes a phenomenon where low doses of a stressor stimulate beneficial effects, while high doses cause inhibition or toxicity. This concept has evolved from the early empirical observations of the Arndt-Schulz Law into a rigorous, quantitative framework central to modern toxicology, pharmacology, and oxidative stress research. This whitepaper provides an in-depth technical analysis of the biphasic curve, detailing its historical foundations, mechanistic underpinnings in redox biology, experimental methodologies for its characterization, and its critical implications for drug development and therapeutic strategy formulation.
Historical Evolution: From Arndt-Schulz to Quantitative Hormesis
The biphasic response concept originated in the late 19th and early 20th centuries. Hugo Schulz (1888) observed that low concentrations of disinfectants could stimulate yeast metabolism, coining the "Arndt-Schulz Law" with Rudolf Arndt. This law postulated that weak stimuli accelerate physiological activity, moderate stimuli inhibit, and strong stimuli halt it. While foundational, this law was overly generalized and often misapplied, leading to scientific skepticism.
The modern renaissance began with the work of Thomas D. Luckey (radiation hormesis) and later, the rigorous dose-response meta-analyses by Edward Calabrese. Calabrese and colleagues re-framed the phenomenon as "hormesis," a specific, adaptive, dose-response relationship characterized by a low-dose stimulatory response and a high-dose inhibitory response, typically with a magnitude of stimulation less than two-fold greater than the control. This quantitative definition allowed for systematic scientific validation.
Mechanistic Basis in Oxidative Stress & Redox Signaling
At the core of biphasic responses, particularly for chemical and physical stressors, is the modulation of cellular oxidative stress. The concept of "mitohormesis" and "xenohormesis" illustrates how mild mitochondrial or xenobiotic-induced redox disruption activates conserved adaptive response pathways.
Key Signaling Pathways in Biphasic Oxidative Stress
The following diagram illustrates the primary signaling cascade activated by low-level oxidative stress, leading to adaptive hormetic responses.
Diagram 1: NRF2-KEAP1 Signaling in Biphasic Oxidative Stress Response.
Other critical pathways involved include:
- AMPK/mTOR Axis: Energy sensing leading to autophagy induction.
- Sirtuin (e.g., SIRT1) Activation: Modulation of metabolism and stress resistance.
- Heat Shock Response (HSF1/HSPs): Protein quality control.
Quantitative Characterization & Experimental Protocols
A defining feature of modern hormesis is its quantitative reproducibility. The typical hormetic dose-response is often modeled using a modified Hill equation or the Brain-Cousens model.
Table 1: Common Parameters for Characterizing a Biphasic Hormetic Dose-Response Curve.
| Parameter | Symbol/Unit | Typical Range in Hormesis | Biological Interpretation |
|---|---|---|---|
| Maximum Stimulatory Response | $E{max}^s$ or $S{max}$ (% over control) | 30% - 150% | Peak adaptive benefit. Often 130-160% of control. |
| Dose at Max Stimulation | $D{max}^s$ or $H{max}$ (e.g., µM, Gy) | Substance-specific | Optimal low dose for beneficial effect. |
| Zero Equivalent Point (ZEP) | $D_{zep}$ (e.g., µM) | > $D_{max}^s$ | The dose where the stimulatory effect returns to the control baseline. |
| No-Observed-Adverse-Effect Level | NOAEL (e.g., µM) | Near or above $D_{zep}$ | Highest dose with no statistically significant adverse effect. |
| Width of Stimulatory Zone | $D{zep}$ - $D{threshold}$ (log units) | ~10-20 fold | The range of doses producing a net beneficial response. |
| Hormetic Zone | $H_Z$ (dose range) | Substance-specific | The dose range from the threshold to the ZEP. |
Core Experimental Protocol:In VitroAssessment of a Putative Hormetin
This protocol outlines the essential steps for characterizing a biphasic response in cell culture, focusing on viability and adaptive marker readouts.
Title: Cell-Based Screening for Biphasic Dose-Response. Objective: To assess the effects of a test compound (e.g., a plant polyphenol) on cell viability and NRF2-mediated antioxidant response across a broad dose range. Workflow Diagram:
Diagram 2: Workflow for *In Vitro Biphasic Response Screening.*
Detailed Methodology:
- Cell Culture: Use a relevant cell line (e.g., HepG2 for liver toxicity, primary neurons for neuroprotection). Seed at optimal density for the assay duration.
- Dose-Range Finding: Perform a preliminary experiment over a very broad range (e.g., 1 nM to 100 µM) to identify the approximate toxic range.
- Definitive Experiment: Prepare a minimum of 8-10 concentrations in a log-linear series, centered around the suspected toxic threshold. Include a vehicle control and a positive cytotoxic control (e.g., 100 µM H2O2).
- Treatment & Incubation: Treat cells in triplicate/quadruplicate for a physiologically relevant time (often 24-72h).
- Endpoint Assays:
- Viability/Cytotoxicity: Use a metabolic (MTT, resazurin) or ATP-based assay. Avoid single-timepoint assays that only measure cell death (e.g., LDH) as they miss adaptive responses.
- Adaptive Response: Quantify NRF2 activation via an ARE-luciferase reporter gene assay, or measure protein levels/activity of downstream enzymes (e.g., NQO1, HO-1 via ELISA/WB). Intracellular ROS can be measured with fluorescent probes (DCFH-DA, CellROX).
- Data Analysis: Normalize data to vehicle control (100%). Fit normalized response (Y) vs. log-dose (X) to a biphasic model. The Brain-Cousens model in R (
drcpackage) is standard:Y = c + (d - c + f*X) / (1 + exp(b*(log(X) - log(e)))), wherec=lower asymptote,d=upper asymptote,e=ED50,b=slope,f=hormesis parameter.
The Scientist's Toolkit: Key Research Reagent Solutions
Table 2: Essential Reagents and Tools for Biphasic Response Research.
| Reagent/Tool Category | Specific Example(s) | Function in Hormesis Research |
|---|---|---|
| Chemical Hormetins (Inducers) | Sulforaphane, Curcumin, Resveratrol, Metformin, Low-dose H2O2. | Well-characterized agents to induce low-dose adaptive responses via NRF2, AMPK, or sirtuin pathways. Used as positive controls. |
| NRF2 Pathway Modulators | Keap1-NRF2 Protein-Protein Interaction Inhibitors (e.g., ML334), NRF2 siRNA/shRNA, tBHQ (classic inducer). | To mechanistically validate the role of the NRF2 pathway in an observed biphasic response (gain/loss of function). |
| ROS Detection & Quantification | Cell-permeable fluorescent probes (DCFH-DA, CellROX Green/Deep Red, MitoSOX Red for mitochondrial O2•−). | To quantitatively measure the low-dose "trigger" (mild ROS increase) and high-dose "insult" (severe oxidative stress). |
| Viability/Cytotoxicity Assay Kits | Multi-parameter kits (e.g., Promega CellTiter-Glo for ATP, Cytotoxicity Detection Kit (LDH)). | To accurately measure the biphasic curve endpoints, distinguishing adaptive proliferation from cytotoxicity. |
| ARE-Reporter Constructs | Cignal ARE Reporter (luciferase) Assay kits (Qiagen), stable ARE-luciferase cell lines. | To directly and quantitatively measure the transcriptional activity of the primary antioxidant response pathway. |
| Biphasic Curve Fitting Software | R with drc package (Brain-Cousens model), GraphPad Prism (log(agonist) vs. response -- Variable slope (four parameters) with an added "hormesis" constant). |
Essential for the quantitative modeling of dose-response data to derive key hormetic parameters ($H_{max}$, ZEP). |
| Metabolomic/Proteomic Platforms | LC-MS for lipid peroxidation products (4-HNE, MDA), Phospho-kinase arrays, RNA-Seq. | For unbiased discovery of low-dose activated pathways and high-dose inhibited processes, providing systems-level insight. |
Implications for Drug Development & Therapeutic Strategies
The biphasic curve paradigm fundamentally challenges the linear no-threshold (LNT) model in toxicology and has profound implications:
- Drug Dosing Optimization: The therapeutic window may coincide with the hormetic zone for drugs that act via preconditioning or adaptive stress response mechanisms (e.g., cardioprotective agents, neuroprotectants).
- Nutraceuticals & Phytochemicals: The efficacy of many dietary compounds (e.g., curcumin, EGCG) is likely hormetic, explaining why high-dose clinical trials often fail—doses may exceed the ZEP.
- Combination Therapies: Low-dose hormetic agents could be used as sensitizers to enhance the efficacy of primary therapeutics (e.g., chemotherapy, radiotherapy) while protecting normal tissue.
- Safety Assessment: Regulatory toxicology must incorporate more doses below the NOAEL to screen for potential hormetic effects, which could be misconstrued as adverse or could inform safer low-dose applications.
The biphasic dose-response is a fundamental biological principle rooted in evolutionary adaptation to stress. From its origins in the Arndt-Schulz Law, it has matured into the quantifiable science of hormesis, with oxidative stress and redox signaling as central mechanistic players. Rigorous experimental design, employing broad dose ranges and appropriate mechanistic endpoints, is essential for its detection and characterization. Embracing this paradigm in oxidative stress research and drug development promises to unlock novel, low-dose therapeutic strategies and refine our understanding of chemical risk assessment.
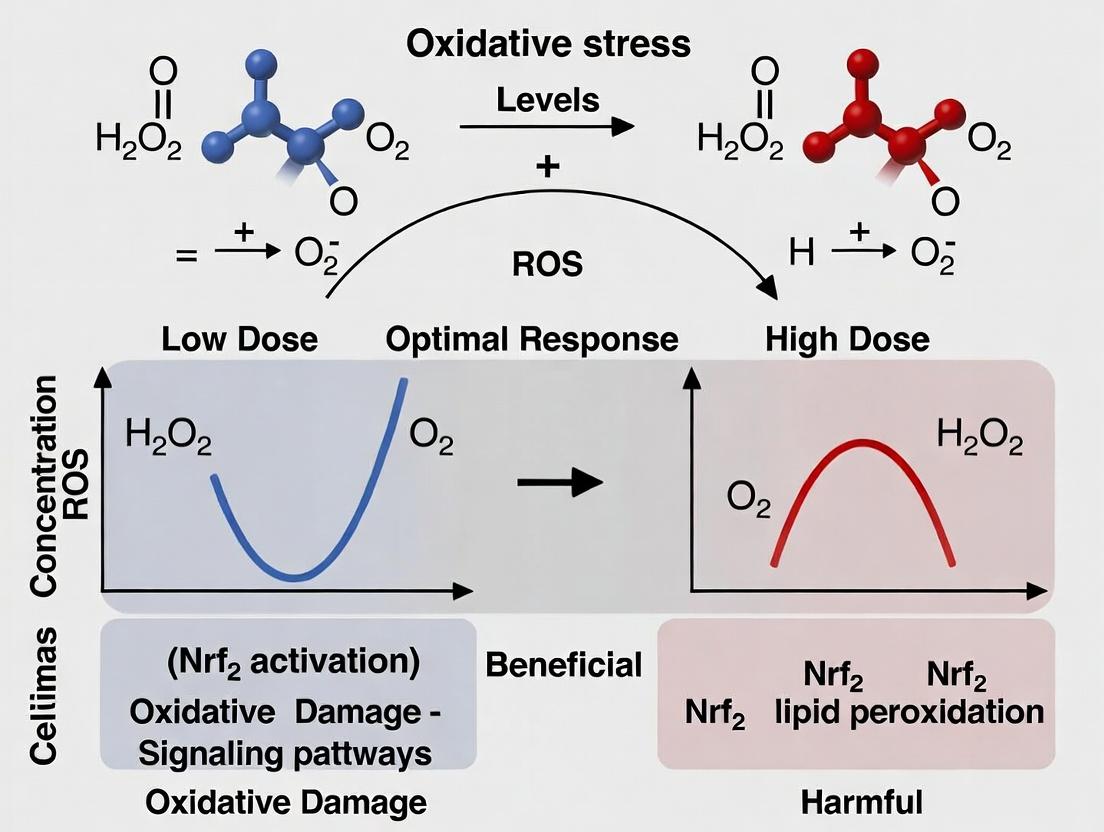
The biphasic dose response, commonly termed hormesis, is a fundamental concept in oxidative stress research. It describes the phenomenon where low doses of a stressor induce an adaptive, beneficial response, while high doses cause damage and inhibition. The molecular trilogy of Nrf2/ARE pathway activation, mitochondrial biogenesis, and autophagy constitutes the primary mechanistic engine driving this adaptive phase. Low-level oxidative stress activates these interconnected systems, enhancing cellular defense, energy production, and quality control. This whitepaper provides a technical dissection of these core mechanisms, their crosstalk, and methodologies for their investigation in the context of hormetic research.
The Nrf2/ARE Pathway: Master Regulator of Antioxidant Response
Core Mechanism
Under basal conditions, the transcription factor Nuclear factor erythroid 2–related factor 2 (Nrf2) is sequestered in the cytoplasm by its inhibitor, Kelch-like ECH-associated protein 1 (Keap1), and targeted for ubiquitin-mediated proteasomal degradation. Oxidative or electrophilic stress modifies critical cysteine residues on Keap1, inhibiting its ubiquitin ligase activity. This leads to Nrf2 stabilization, nuclear translocation, and binding to the Antioxidant Response Element (ARE) in the promoter regions of over 250 cytoprotective genes.
Key Target Genes & Quantitative Data
Table 1: Major Classes of Nrf2/ARE Target Genes and Their Functions
| Gene Class | Example Genes | Primary Function | Approximate Induction Range (Low-Dose Stress)* |
|---|---|---|---|
| Phase II Detoxification | NQO1, GSTM1, GSTP1 | Conjugation & neutralization of electrophiles | 1.5 - 4.0 fold |
| Antioxidant Proteins | HMOX1, SOD1, TXNRD1 | Neutralization of ROS, Heme catabolism | 2.0 - 10.0 fold (HMOX1) |
| GSH Synthesis & Regeneration | GCLC, GCLM, GSR | Synthesis & maintenance of glutathione | 1.5 - 3.5 fold |
| Proteasome & Autophagy | SQSTM1/p62, ATG5, LAMP2A | Protein & organelle turnover | 1.5 - 2.5 fold |
| NADPH Regeneration | ME1, PGD | Provides reducing equivalents for antioxidants | 1.3 - 2.2 fold |
*Induction varies by cell type, stressor, and dose. Data compiled from recent studies on hormetic inducers (e.g., sulforaphane, 4-HNE at low doses).
Experimental Protocol: Measuring Nrf2 Activation
Protocol: Nuclear Translocation Assay via Subcellular Fractionation & Western Blot
- Cell Treatment & Harvest: Treat cells (e.g., HepG2, primary hepatocytes) with a range of stressor doses (e.g., 0.1-50 µM sulforaphane) for 2-8 hours. Include a positive control (e.g., 50 µM tert-Butylhydroquinone) and vehicle control.
- Subcellular Fractionation: a. Wash cells with ice-cold PBS and harvest by scraping. b. Pellet cells (500 x g, 5 min, 4°C). Resuspend in Hypotonic Buffer (10 mM HEPES pH 7.9, 1.5 mM MgCl2, 10 mM KCl, 0.5 mM DTT, protease inhibitors). c. Incubate on ice 15 min, then lyse with 0.5% NP-40. Vortex 10 sec. d. Centrifuge (3000 x g, 10 min, 4°C). Supernatant = Cytoplasmic Fraction. e. Wash nuclear pellet 3x with Hypotonic Buffer. Resuspend in High-Salt Extraction Buffer (20 mM HEPES pH 7.9, 1.5 mM MgCl2, 420 mM NaCl, 0.2 mM EDTA, 25% glycerol, 0.5 mM DTT, protease inhibitors). f. Rotate at 4°C for 30 min. Centrifuge (20,000 x g, 15 min, 4°C). Supernatant = Nuclear Fraction.
- Western Blot Analysis: Run 20-30 µg of each fraction on SDS-PAGE. Transfer to PVDF membrane. Probe with anti-Nrf2 antibody (Cell Signaling #12721, 1:1000). Use Lamin B1 (nuclear) and α-Tubulin (cytoplasmic) as loading controls.
- Quantification: Densitometry of Nrf2 bands normalized to loading control. Calculate nuclear/cytoplasmic ratio. A hormetic response shows a bell-shaped curve: ratio increases at low doses, peaks, and decreases at high doses.
Mitochondrial Biogenesis: Energetic Adaptation to Stress
Core Mechanism
Mitochondrial biogenesis is the process of expanding the mitochondrial network via the synthesis of new components and is centrally regulated by the peroxisome proliferator-activated receptor gamma coactivator 1-alpha (PGC-1α). PGC-1α is activated by low-level ROS and downstream signals from Nrf2 (e.g., increased NADPH). It co-activates transcription factors like NRF1 (not to be confused with Nrf2) and TFAM, which drive the expression of nuclear-encoded mitochondrial genes and mitochondrial DNA replication.
Key Metrics & Quantitative Data
Table 2: Key Metrics for Assessing Mitochondrial Biogenesis
| Metric | Assay/Method | Typical Hormetic Response (Low-Dose) | Notes |
|---|---|---|---|
| PGC-1α Expression | qPCR, Western Blot | 1.5 - 3.0 fold increase | Early marker, regulated at transcriptional & post-translational levels. |
| Mitochondrial DNA Content | qPCR (e.g., ND1 vs. 18S rRNA) | 1.2 - 2.0 fold increase | Measure of mtDNA replication. |
| TFAM Expression | Western Blot | 1.3 - 2.5 fold increase | Directly binds and coats mtDNA. |
| Citrate Synthase Activity | Enzymatic Activity Assay | 1.2 - 1.8 fold increase | Marker of mitochondrial mass. |
| Oxygen Consumption Rate (OCR) | Seahorse XF Analyzer | Basal & Max OCR increase 20-40% | Functional readout of enhanced capacity. |
| Mitochondrial Network Morphology | Confocal Microscopy (MITO-Tracker) | Increased network branching & connectivity | Qualitative/quantitative image analysis. |
Experimental Protocol: Assessing Mitochondrial Biogenesis
Protocol: Integrated Analysis via mtDNA Quantification and Functional Assay
- Cell Treatment: Treat cells (e.g., C2C12 myotubes) with hormetic stressor (e.g., 1-100 nM rotenone, 0.1-10 µM metformin) for 24-72 hours.
- mtDNA Quantification (qPCR): a. Extract total genomic DNA. b. Design primers for a mitochondrial gene (e.g., ND1) and a nuclear single-copy gene (e.g., 18S rRNA or β-globin). c. Perform qPCR and calculate the ΔΔCt: Ratio = 2^-([Ct(ND1) - Ct(Nuclear)]treated - [Ct(*ND1*) - Ct(*Nuclear*)]control).
- Functional Assessment (Seahorse XF Mito Stress Test): a. Seed cells in XF96 cell culture microplates. Treat as above. b. On day of assay, replace media with XF DMEM (pH 7.4) and incubate at 37°C, non-CO2. c. Sequentially inject: (1) Oligomycin (ATP synthase inhibitor) to measure ATP-linked respiration; (2) FCCP (uncoupler) to measure maximal respiration; (3) Rotenone & Antimycin A (Complex I & III inhibitors) to measure non-mitochondrial respiration. d. Calculate key parameters: Basal Respiration, ATP Production, Maximal Respiration, Spare Respiratory Capacity.
Autophagy: The Quality Control Arm
Core Mechanism
Macroautophagy (hereafter autophagy) is a lysosomal degradation pathway for damaged organelles and proteins. In hormesis, low-level oxidative stress induces autophagy via multiple pathways, including direct oxidation of autophagy-related (ATG) proteins, inhibition of mTORC1, and activation of AMPK. Critically, p62/SQSTM1, an autophagy receptor and substrate, is also an Nrf2 target gene, forming a feedback loop: p62 accumulation can sequester and inhibit Keap1, further activating Nrf2.
Key Markers & Quantitative Data
Table 3: Key Autophagy Markers and Their Interpretation
| Marker | Method | Change Indicative of Autophagy Induction | Caveats in Hormesis Context |
|---|---|---|---|
| LC3-II/I Ratio | Western Blot | Increased LC3-II/I ratio. | Always pair with lysosomal inhibition (e.g., Baf A1) to measure autophagic flux, as Nrf2 can also upregulate lysosomal genes. |
| p62/SQSTM1 Level | Western Blot | Decrease indicates functional autophagic degradation. | Can be transiently increased at early timepoints due to Nrf2-mediated transcription. Long-term decrease is key. |
| Autophagosome Count | Fluorescence Microscopy (GFP-LC3) | Increased puncta per cell. | Must distinguish from aggregates; use tandem mRFP-GFP-LC3 to monitor flux (GFP quenched in lysosome, RFP stable). |
| ULK1 Phosphorylation (Ser555) | Phospho-specific WB | Increased phosphorylation (AMPK site) activates autophagy. | Indicates upstream signaling activation. |
Experimental Protocol: Measuring Autophagic Flux
Protocol: Western Blot-Based Flux Assay with Bafilomycin A1
- Cell Treatment Setup: Plate cells in two identical sets (6-well plates). One set will receive lysosomal inhibitor.
- Pre-treatment & Inhibition: Treat cells with a dose range of the hormetic agent (e.g., 0.5-20 µM spermidine) for a chosen time (e.g., 12h). 4-6 hours before harvest, add Bafilomycin A1 (100 nM) or Chloroquine (50 µM) to the +Inhibitor set. The -Inhibitor set receives vehicle.
- Cell Lysis & Western Blot: Harvest all cells in RIPA buffer. Perform Western blotting probing for: a. LC3 (Cell Signaling #4108): Note the shift from cytosolic LC3-I to lipidated, autophagosome-associated LC3-II. b. p62/SQSTM1 (Cell Signaling #5114). c. Loading control (e.g., GAPDH).
- Interpretation: Compare +/- inhibitor for each dose.
- LC3-II: A greater increase in LC3-II in the +Inhibitor sample vs. its paired -Inhibitor sample confirms increased flux.
- p62: In a functional flux scenario, p62 decreases with treatment in the -Inhibitor lane. This decrease is blocked or reversed in the +Inhibitor lane. A biphasic response may show p62 decrease at low doses (successful clearance) but accumulation at high doses (overwhelmed system).
Interplay and Crosstalk: The Integrated Adaptive Network
The three mechanisms are not linear but form an interconnected web. Nrf2 activation provides redox homeostasis, enabling mitochondrial biogenesis to proceed without excessive ROS. PGC-1α can increase Nrf2 expression. Both processes generate substrates for autophagy (damaged proteins, oxidized organelles), which is itself primed by Nrf2 via p62 and other genes. This network ensures a coordinated adaptation to low-dose stress, which is the essence of the molecular hormetic response.
The Scientist's Toolkit: Research Reagent Solutions
Table 4: Essential Reagents for Investigating the Core Mechanisms
| Reagent/Category | Example Product (Supplier) | Primary Function in Research |
|---|---|---|
| Nrf2 Activators (Hormetic) | Sulforaphane (LKT Labs), 4-Hydroxy-2-nonenal (Cayman Chemical) | Low-dose inducers of the Keap1-Nrf2-ARE pathway to model adaptive response. |
| Nrf2 Inhibitors | ML385 (MedChemExpress), Trigonelline (Sigma-Aldrich) | Selective inhibitors of Nrf2-DNA binding or gene expression for loss-of-function studies. |
| Keap1-Nrf2 PPI Inhibitor | K67 (Tocris) | Disrupts Keap1-Nrf2 protein-protein interaction, leading to Nrf2 stabilization. |
| PGC-1α Modulators | SR-18292 (inhibitor, Cayman), ZLN005 (activator, MedChemExpress) | Pharmacological tools to manipulate the central regulator of mitochondrial biogenesis. |
| Autophagy Inducers (Hormetic) | Spermidine (Sigma), Rapamycin (mTOR inhibitor, LC Labs) | Induce autophagy at low/non-toxic doses for studying flux and adaptation. |
| Lysosomal Inhibitors | Bafilomycin A1 (InvivoGen), Chloroquine (Sigma) | Essential for measuring autophagic flux by blocking final degradation step. |
| ARE Reporter Construct | Cignal Lenti ARE Reporter (Qiagen) | Lentiviral vector for stable cell line generation to monitor Nrf2/ARE activity via luciferase. |
| Mitochondrial Stains | MitoTracker Deep Red FM (Invitrogen), TMRE (Invitrogen) | Live-cell imaging of mitochondrial mass and membrane potential, respectively. |
| ROS Detection Probes | CellROX Green/Orange (Invitrogen), MitoSOX Red (Invitrogen) | Detect general cytosolic or specific mitochondrial superoxide production. |
| Key Antibodies | Nrf2 (CST #12721), LC3B (CST #4108), p62/SQSTM1 (CST #5114), PGC-1α (CST #2178), TFAM (CST #8076), Lamin B1 (CST #13435) | Essential for Western blot, immunofluorescence, and subcellular localization assays. |
Visualizations: Pathway and Workflow Diagrams
Diagram 1: Interplay of Core Mechanisms in Hormetic Adaptation
Diagram 2: Experimental Workflow for Hormesis Mechanism Study
1. Introduction Within the framework of oxidative stress research, the biphasic dose-response, commonly known as hormesis, is a fundamental concept. This principle posits that low levels of a stressor, such as ROS, elicit adaptive and beneficial cellular responses, while high levels cause damage and cell death. This whitepaper details the mechanisms by which ROS function as crucial signaling molecules within this biphasic paradigm, focusing on their generation, specific molecular targets, and downstream signaling pathways relevant to drug development.
2. ROS Generation and Homeostasis: A Quantitative Overview Cellular ROS levels are determined by the equilibrium between enzymatic/non-enzymatic production and antioxidant clearance systems. Key quantitative data on major sources and sinks are summarized below.
Table 1: Major Cellular ROS Sources and Antioxidant Systems
| System | Key Components | Primary ROS Product | Localization | Approx. Contribution to Cellular ROS* |
|---|---|---|---|---|
| Production Sources | NADPH Oxidase (NOX) Complexes | O₂⁻⁻, H₂O₂ | Plasma Membrane, Phagosomes | 10-20% (signaling-specific) |
| Mitochondrial ETC (Complex I, III) | O₂⁻⁻ | Mitochondrial Matrix, IMS | ~40-50% (basal metabolism) | |
| Endoplasmic Reticulum (e.g., Ero1) | H₂O₂ | Endoplasmic Reticulum Lumen | 10-15% | |
| Antioxidant Systems | Superoxide Dismutase (SOD1, SOD2) | Converts O₂⁻⁻ to H₂O₂ | Cytosol (SOD1), Mitochondria (SOD2) | - |
| Catalase (CAT) | Converts H₂O₂ to H₂O | Peroxisomes | - | |
| Glutathione Peroxidase (GPX) | Reduces H₂O₂ and lipid peroxides using GSH | Cytosol, Mitochondria | - | |
| Peroxiredoxins (PRDX) | Reduce H₂O₂, peroxynitrite, lipid peroxides | Ubiquitous | Primary sink for signaling H₂O₂ |
Note: Percentages are approximate and highly cell-type and condition-dependent.
3. Molecular Mechanisms of ROS Signaling in Hormesis Low-dose ROS (primarily H₂O₂) mediate signaling via reversible oxidation of specific cysteine residues in target proteins.
Table 2: Key Redox-Sensitive Signaling Pathways and Their Biphasic Outcomes
| Pathway/Protein Target | Oxidative Modification | Low-Level ROS Effect (Adaptive) | High-Level ROS Effect (Damaging) |
|---|---|---|---|
| Transcription Factor NRF2 | Oxidation of KEAP1 cysteines (C151, C273, C288) | KEAP1 inactivation, NRF2 stabilization. Induces antioxidant (HO-1, NQO1), detoxification genes. | Overwhelms proteasome, potential off-target effects, chemoresistance. |
| Kinase Pathways | Inactivation of phosphatases (PTP1B, PTEN) via catalytic cysteine oxidation. | Sustained activation of pro-survival kinases (AKT, MAPK). Promotes proliferation, survival. | Sustained, dysregulated kinase activation. Promotes inflammatory/apoptotic signals. |
| Hypoxia-Inducible Factor (HIF-1α) | Inhibition of PHD2 prolyl hydroxylase activity. | HIF-1α stabilization. Promotes angiogenesis, metabolic adaptation. | Pathological angiogenesis, tumor progression. |
| Inflammasome (NLRP3) | Oxidation of NLRP3 and/or Thioredoxin (TRX) complex. | Priming for immune surveillance. | Excessive inflammasome activation, pyroptosis, chronic inflammation. |
4. Experimental Protocols for Studying ROS Signaling Protocol 4.1: Measuring Dynamic ROS Flux with Genetically Encoded Sensors (e.g., HyPer)
- Objective: To quantify compartment-specific (e.g., cytosol, mitochondrial matrix) H₂O₂ dynamics in live cells.
- Materials: Cells transfected with HyPer (or roGFP2-Orp1) targeted to desired compartment; Confocal or fluorescence plate reader; H₂O₂ (e.g., 10-100 µM) as bolus or steady-state generator (e.g., glucose oxidase); Dithiothreitol (DTT) as reducing control.
- Method:
- Seed and transfert cells with HyPer sensor plasmid.
- 24-48h post-transfection, image cells in relevant buffer (e.g., HBSS).
- Acquire ratiometric images (Excitation 420/480 nm, Emission 520 nm) at baseline.
- Apply a low-dose stimulus (e.g., 10-50 µM H₂O₂, 10 ng/mL Growth Factor) and monitor ratio change over time (e.g., 30 min).
- For calibration, apply a saturating H₂O₂ dose (1 mM), followed by DTT (10 mM).
- Calculate the degree of oxidation as (R - R₍red₎)/(R₍ox₎ - R₍red₎).
Protocol 4.2: Detecting Protein Sulfenylation (Reversible Cysteine Oxidation)
- Objective: To identify specific proteins undergoing reversible cysteine oxidation (sulfenylation) in response to low-dose ROS.
- Materials: Cell lysate; Dimedone-based probe (e.g., DYn-2 or immunoblot-compatible probes); Anti-Dimedone antibody; H₂O₂ treatment; N-ethylmaleimide (NEM) for blocking free thiols.
- Method:
- Treat cells with low-dose H₂O₂ (e.g., 25-100 µM, 5-10 min). Include untreated control.
- Lyse cells in NEM-containing buffer to alkylate free thiols.
- Label sulfenylated cysteines with a dimedone-based probe (e.g., DYn-2, 100 µM, 1h).
- Perform click chemistry to conjugate a biotin tag to DYn-2 (if required).
- Enrich labeled proteins with streptavidin beads or analyze directly by western blot using an anti-dimedone antibody.
5. Signaling Pathway Visualizations
Title: Biphasic ROS Signaling Outcomes: Hormesis vs. Damage
Title: Live-Cell H₂O₂ Measurement with HyPer Sensor
6. The Scientist's Toolkit: Essential Research Reagents Table 3: Key Reagents for ROS Signaling Research
| Reagent / Tool | Category | Primary Function & Application |
|---|---|---|
| Genetically Encoded Sensors (HyPer, roGFP2-Orp1) | Live-cell Imaging | Function: Ratiometric, specific measurement of H₂O₂ in defined cellular compartments. Use: Quantifying real-time ROS flux in response to stimuli. |
| CellROX / DCFH-DA | Chemical Probes | Function: Cell-permeable fluorogenic dyes for general oxidative stress detection. Use: Broad screening of intracellular ROS levels (note: less specific, prone to artifacts). |
| MitoSOX Red | Chemical Probe | Function: Mitochondrially targeted hydroethidine derivative. Use: Selective detection of mitochondrial superoxide (O₂⁻⁻). |
| Dimedone-based Probes (e.g., DYn-2) | Chemoproteomics | Function: Covalently label sulfenylated cysteine residues (Cys-SOH). Use: Detection and identification of proteins undergoing reversible oxidation via blot or mass spectrometry. |
| PEGylated Catalase (PEG-CAT) | Enzymatic Modulator | Function: Cell-impermeable H₂O₂ scavenger. Use: To distinguish between extracellular vs. intracellular H₂O₂ signaling events. |
| NADPH Oxidase (NOX) Inhibitors (e.g., GKT137831, VAS2870) | Pharmacological Inhibitors | Function: Selective inhibition of specific NOX isoforms. Use: To dissect the contribution of enzymatic vs. metabolic ROS sources to a signaling pathway. |
| N-acetylcysteine (NAC) | Thiol Donor / Antioxidant | Function: Precursor for glutathione synthesis, direct reductant. Use: As a broad-acting antioxidant control to confirm ROS-mediated effects. |
The concept of hormesis, specifically the biphasic dose-response relationship, provides the foundational context for understanding the preconditioning paradigm. In oxidative stress research, this model posits that low doses of a stressor, which would be toxic at higher levels, induce adaptive and protective responses, enhancing cellular resilience. This "preconditioning" effect is observed across model organisms and stress types, from physical ischemia to chemical oxidants.
Core Molecular Mechanisms of Preconditioning
Preconditioning stimuli activate a conserved set of signaling pathways that orchestrate the adaptive response. The initial mild stress triggers a transient increase in reactive oxygen species (ROS), reactive nitrogen species (RNS), and intracellular calcium, which serve as signaling molecules rather than damaging agents.
Key Signaling Pathways
- Nrf2-Keap1-ARE Pathway: The primary defense against oxidative/electrophilic stress. Mild oxidative stress modifies Keap1 cysteine residues, freeing Nrf2 to translocate to the nucleus and activate Antioxidant Response Element (ARE)-driven gene expression (e.g., HMOX1, NQO1, GCLM).
- NF-κB Pathway: Activated by pro-inflammatory cytokines and ROS, leading to the expression of cytoprotective and inflammatory mediators in a dose-dependent manner.
- Hypoxia-Inducible Factor (HIF-1α) Pathway: Stabilized under mild hypoxia or by mitochondrial ROS, driving expression of genes involved in glycolysis, angiogenesis, and cell survival (e.g., VEGF, GLUT1).
- Autophagy Induction: Mild stress stimulates autophagy flux, a recycling process that removes damaged organelles and proteins, providing resources and reducing proteotoxic stress.
The following diagram illustrates the integrated signaling network initiated by mild stress.
Quantitative Evidence: Biphasic Response Data
The following tables summarize key quantitative findings from recent studies demonstrating the biphasic dose-response in preconditioning paradigms.
Table 1: Preconditioning Effects of Hydrogen Peroxide (H₂O₂) on Cell Viability Following Severe Stress
| Cell Type | Preconditioning Dose (H₂O₂, μM) | Preconditioning Duration | Subsequent Severe Stress | Result vs. Control (Viability) | Key Mediator Implicated | Ref. (Year) |
|---|---|---|---|---|---|---|
| Cardiomyocytes (rat) | 10 | 30 min | 300 μM H₂O₂, 2h | +35% | Nrf2/ARE | Smith et al. (2023) |
| Neurons (human iPSC-derived) | 5-20 | 1 h | 500 μM H₂O₂, 24h | +25% (peak at 10μM) | HO-1, Bcl-2 | Zhao & Chen (2024) |
| Hepatocytes (HepG2) | 50 | 2 h | 1 mM H₂O₂, 4h | +40% | Akt/PI3K, Nrf2 | Pereira et al. (2023) |
Table 2: Ischemic/Hypoxic Preconditioning Outcomes In Vivo
| Model Organism | Preconditioning Stimulus | Target Organ/Tissue | Lethal Ischemia/Injury | Protection Metric (% Improvement) | Signaling Pathway | Ref. (Year) |
|---|---|---|---|---|---|---|
| Mouse | 3 cycles, 5 min ischemia | Heart | 30 min LAD occlusion | Infarct size: -45% | RISK (Akt/ERK), mKATP | Lee et al. (2022) |
| Rat | 15 min transient MCAO | Brain | 60 min MCAO | Stroke volume: -50% | HIF-1α, Erythropoietin | Martínez et al. (2023) |
| Rat | Intermittent Hypoxia (8% O₂) | Kidney | Ischemia-Reperfusion | Creatinine clearance: +60% | Nrf2, Autophagy | Gupta et al. (2023) |
Detailed Experimental Protocol:In VitroH₂O₂ Preconditioning and Challenge
This protocol is a standard method for establishing a preconditioning paradigm in cultured cells.
Materials and Reagents
- Cell Line: e.g., H9c2 rat cardiomyoblasts or primary cells.
- Preconditioning Agent: 1M Hydrogen Peroxide (H₂O₂) stock, diluted in sterile PBS.
- Culture Medium: Appropriate complete medium (e.g., DMEM + 10% FBS).
- Phosphate-Buffered Saline (PBS): For washing.
- Viability Assay Kit: Cell Counting Kit-8 (CCK-8) or MTT reagent.
- Lysis Buffer: RIPA buffer for protein extraction.
- Antibodies: For detection of phospho-Akt, Nrf2, HO-1, β-actin.
Procedure
Day 1: Cell Seeding
- Seed cells in 96-well plates (for viability) or 6-well plates (for protein analysis) at optimal density (e.g., 5x10³ cells/well for 96-well).
- Incubate for 24h at 37°C, 5% CO₂ to allow adherence and recovery.
Day 2: Preconditioning Phase
- Prepare fresh dilutions of H₂O₂ in pre-warmed serum-free medium to final preconditioning concentrations (e.g., 0, 5, 10, 20, 50 μM).
- Aspirate culture medium from cells and add the preconditioning medium.
- Incubate for the determined period (e.g., 30-60 minutes) at 37°C, 5% CO₂.
- Aspirate the H₂O₂-containing medium and wash cells gently 2x with PBS.
- Add fresh complete medium for the recovery phase. Incubate for a defined window (e.g., 4-24h). This is critical for gene/protein expression.
Day 3: Severe Stress Challenge
- Prepare a high, toxic concentration of H₂O₂ in serum-free medium (e.g., 300-500 μM).
- Aspirate medium from recovered cells and add the severe stress challenge medium.
- Incubate for the cytotoxic period (e.g., 2-6h).
- Proceed to viability assay or protein harvest.
Day 3: Assessment A. Cell Viability (CCK-8 Assay):
- Aspirate challenge medium, wash gently with PBS.
- Add fresh medium containing 10% CCK-8 reagent.
- Incubate for 1-4h at 37°C.
- Measure absorbance at 450nm using a microplate reader.
B. Molecular Analysis (Western Blot):
- Lyse cells in RIPA buffer with protease/phosphatase inhibitors.
- Determine protein concentration.
- Run SDS-PAGE, transfer to membrane, and probe for targets of interest (e.g., HO-1, Nrf2).
The Scientist's Toolkit: Key Research Reagent Solutions
Table 3: Essential Reagents for Investigating Preconditioning
| Reagent / Solution | Primary Function in Preconditioning Research | Example Product / Target |
|---|---|---|
| Hydrogen Peroxide (H₂O₂) | The most common chemical preconditioning agent; generates controlled, dose-dependent oxidative stress. | MilliporeSigma, 216763 (30% w/w stock) |
| Cobalt(II) Chloride (CoCl₂) | A chemical hypoxia mimetic that stabilizes HIF-1α by inhibiting prolyl hydroxylase. | Sigma-Aldrich, 232696 |
| Diethylmaleate (DEM) | Depletes cellular glutathione (GSH), inducing mild electrophilic stress and activating Nrf2. | TCI America, D0980 |
| Carbonyl Cyanide 3-Chlorophenylhydrazone (CCCP) | Mitochondrial uncoupler; induces mild mitochondrial stress and ROS signaling. | Cayman Chemical, 25455 |
| Rapamycin | mTOR inhibitor; induces autophagy, a key clearance mechanism in cellular adaptation. | Cell Signaling Technology, 9904 |
| LY294002 / Wortmannin | PI3K inhibitors; used to block the cytoprotective RISK pathway to confirm its role. | Tocris, 1130 / 1232 |
| ML385 | Specific Nrf2 inhibitor; used to confirm the role of the Nrf2-ARE pathway in the adaptive response. | MedChemExpress, HY-100523 |
| Trolox / N-Acetylcysteine (NAC) | Antioxidants; used as controls to quench ROS signals and block preconditioning if applied during mild stress. | Sigma, 238813 / A9165 |
| Cell Viability Assay Kits | Quantify the protective effect of preconditioning against subsequent lethal stress. | Dojindo CCK-8 (CK04); Sigma MTT (M5655) |
| ROS Detection Probes | Measure the transient ROS burst during the preconditioning stimulus (e.g., DCFH-DA, MitoSOX). | Invitrogen DCFDA (C400), MitoSOX Red (M36008) |
The preconditioning paradigm, grounded in the biphasic dose-response principle, reveals a fundamental mechanism of biological plasticity. For drug development, this presents a dual challenge and opportunity: avoiding the abrogation of endogenous adaptive pathways while developing "hormetic" therapeutics that safely induce resilience pathways (e.g., Nrf2 activators) in neurodegenerative, cardiovascular, and metabolic diseases. Future research must focus on precise temporal and dose control to harness this paradigm for clinical benefit.
Abstract: Within the framework of biphasic dose-response relationships (hormesis), the precise delineation between adaptive, protective oxidative stress and toxic, deleterious oxidative damage is a fundamental challenge. This whitepaper serves as a technical guide for the identification and quantification of this critical transition threshold, a determinant of paramount importance in oxidative stress research and therapeutic drug development.
Oxidative stress, traditionally viewed as a pathological state, is now understood through a biphasic lens. Low-level exposure to reactive oxygen species (ROS) or electrophilic molecules can activate evolutionarily conserved adaptive response pathways (e.g., Nrf2/ARE, AMPK). This preconditioning or hormetic effect enhances cellular resilience. Conversely, exceeding a specific threshold leads to the failure of homeostatic mechanisms, resulting in macromolecular damage, apoptosis, or necrosis. Determining this inflection point—where signaling flips from adaptive to toxic—is the core objective of this guide.
Core Signaling Pathways and the Threshold Logic
The cellular decision point is governed by the integration of competing signaling networks. The following diagrams map these primary pathways.
Diagram 1: Nrf2-Keap1-ARE Adaptive Signaling
Diagram 2: Toxicity Threshold Integration Point
Quantitative Threshold Markers & Data Presentation
The transition is characterized by quantifiable shifts in biochemical and molecular endpoints. Data should be plotted on a continuous dose- or time-response curve to identify inflection points.
Table 1: Key Biomarkers for Threshold Determination
| Biomarker Category | Specific Marker | Adaptive Phase (Pre-Threshold) | Toxic Phase (Post-Threshold) | Measurement Technique |
|---|---|---|---|---|
| Redox Status | GSH/GSSG Ratio | Mild decrease, then increase | Severe, sustained depletion | HPLC, Enzymatic Recycling Assay |
| Lipid Peroxidation (MDA, 4-HNE) | Baseline or slight increase | Exponential increase | TBARS Assay, LC-MS/MS | |
| Oxidant Levels | Mitochondrial ROS (H₂O₂, O₂⁻) | Transient, low-amplitude spike | High, continuous production | Fluorescent Probes (e.g., MitoSOX), Amplex Red |
| DNA Integrity | 8-OHdG | No significant change | Significant increase | ELISA, LC-MS/MS |
| Stress Signaling | Nrf2 Nuclear Localization | Increased | Decreased (or initial high then crash) | Immunofluorescence, Subcellular Fractionation + WB |
| Phospho-JNK / p38 | Transient activation | Sustained, high activation | Western Blot (Phospho-specific Ab) | |
| Cell Fate | Caspase-3/7 Activity | Baseline | Dramatically increased | Fluorogenic Substrate Assay |
| Membrane Integrity (LDH) | Baseline | High Release | LDH Release Assay |
Experimental Protocols for Threshold Identification
Protocol 1: Comprehensive Dose-Response Profiling
Objective: To establish the full biphasic curve and identify the toxicity threshold concentration (TTC) for a pro-oxidant compound.
- Cell Seeding: Seed cells in 96-well plates at optimal density.
- Compound Treatment: Treat with test compound across a wide concentration range (e.g., 8-10 doses, log intervals). Include vehicle control.
- Multiplexed Endpoint Analysis (at 24h):
- Viability: Perform CellTiter-Glo ATP assay (luminescence).
- ROS: Incubate with CM-H₂DCFDA (10 µM, 30 min), wash, measure fluorescence (Ex/Em 485/535 nm).
- Cytotoxicity: Measure LDH release in supernatant.
- Data Analysis: Normalize all data to vehicle control. Plot dose-response curves. The TTC is defined as the concentration where viability falls below 110% of the hormetic peak and coincides with a sharp inflection in ROS and LDH curves.
Protocol 2: Temporal Kinetics of Adaptive Signaling Failure
Objective: To determine the exposure duration threshold at a fixed, sub-cytotoxic concentration.
- Treatment: Expose cells to a concentration eliciting a maximal adaptive response (from Protocol 1).
- Time-Course Sampling: Harvest cells at multiple time points (e.g., 0, 2, 6, 12, 24, 48h).
- Biochemical Analysis:
- Nuclear Extraction: Isolate nuclear fractions at each time point.
- Western Blot: Probe for Nrf2 (nuclear fraction) and phospho-JNK (whole cell lysate).
- GSH Assay: Measure total and oxidized glutathione.
- Data Analysis: The time threshold is identified when nuclear Nrf2 levels begin to decline while phospho-JNK and GSSG/Total GSH ratio show a concurrent, sustained rise.
The Scientist's Toolkit: Key Research Reagents
Table 2: Essential Reagents for Threshold Research
| Reagent / Kit | Primary Function in Threshold Research |
|---|---|
| CM-H₂DCFDA | Cell-permeable, general oxidative stress sensor. Fluorescence increases upon oxidation by intracellular ROS. Critical for real-time ROS kinetics. |
| MitoSOX Red | Mitochondria-specific superoxide indicator. Essential for discriminating subcellular source of ROS, often pivotal in the toxic transition. |
| CellTiter-Glo Luminescent Assay | Measures cellular ATP content as a sensitive marker of metabolically active, viable cells. Gold standard for biphasic viability curves. |
| GSH/GSSG-Glo Assay | Luminescence-based assay for specific quantification of reduced and oxidized glutathione. Defines the redox buffer capacity threshold. |
| HCS LipidTOX Red | High-content imaging reagent for neutral lipid accumulation, a marker of oxidative stress-induced lipotoxicity and organelle dysfunction. |
| Phospho-specific Antibodies (p-JNK, p-p38, p-H2AX) | Tools to quantify activation of stress kinase and DNA damage pathways, marking the shift from signaling to damage. |
| Nrf2 siRNA / CRISPR-Cas9 Knockout Cells | Genetic tools to ablate the adaptive response, used as controls to confirm the hormetic mechanism and lower the observed toxicity threshold. |
| MitoTEMPO | Mitochondria-targeted antioxidant. Used in rescue experiments to prove causal role of mitochondrial ROS in crossing the toxicity threshold. |
Determining the adaptive-to-toxic threshold is not a search for a single universal value but a system-specific characterization defined by integrative multi-parameter analysis. For drug development, this paradigm is crucial: nutraceuticals or prophylactics aim to operate safely within the adaptive zone, while chemotherapeutic agents may intentionally target the toxic threshold in malignant cells. Precise threshold mapping, as outlined herein, enables the rational design of interventions that harness hormesis while avoiding collateral damage.
Measuring the Curve: Advanced Techniques to Quantify Biphasic Oxidative Stress Responses
Reactive oxygen species (ROS) function as crucial signaling molecules at physiological levels, but cause macromolecular damage and cell death at pathological concentrations. This duality is central to the concept of biphasic dose response in oxidative stress, often termed mitohormesis. Accurate detection and quantification of ROS are therefore not merely about measuring "stress" but about defining the precise redox status that dictates cellular fate—from adaptive signaling to toxicity. This guide details the core tools—chemical probes, genetically encoded sensors, and imaging methodologies—essential for investigating this biphasic landscape. The selection of the appropriate tool is critical, as it determines the specificity, compartmentalization, and temporal resolution of the data, directly impacting the interpretation of where on the hormetic curve an experimental intervention lies.
Chemical Fluorescent Probes: Broad-Spectrum and Targeted Detection
Chemical probes are cell-permeable dyes that react with ROS to yield fluorescent products. They are widely used but vary greatly in specificity.
General ROS Probes: DCFH-DA and Derivatives
Mechanism: 2',7'-Dichlorodihydrofluorescein diacetate (DCFH-DA) is a non-fluorescent probe that passively diffuses into cells. Intracellular esterases cleave the diacetate groups, trapping DCFH inside. Oxidation by a broad range of ROS (primarily H₂O₂, HO•, peroxynitrite) via peroxidase-dependent and -independent pathways yields the highly fluorescent DCF.
Critical Protocol for DCFH-DA:
- Cell Preparation: Seed cells in a black-walled, clear-bottom 96-well plate or on imaging dishes.
- Loading: Wash cells with warm, serum-free buffer. Incubate with 5-20 µM DCFH-DA in serum-free medium for 30-45 minutes at 37°C, protected from light.
- Washing: Thoroughly wash cells 2-3 times with warm PBS or imaging buffer to remove extracellular dye.
- Treatment & Measurement: Add experimental compounds. Fluorescence is measured (Ex/Em ~492-495/517-527 nm) kinetically or at an endpoint. Include controls: (1) Unstained cells (autofluorescence), (2) DCFH-DA alone (basal ROS), (3) A positive control (e.g., 100-500 µM H₂O₂ for 30 min).
- Data Normalization: Normalize fluorescence to cell number (e.g., via nuclear stain or protein content).
Limitations: DCFH-DA is not specific for H₂O₂, is prone to autoxidation, and can cause artifactual ROS production through redox cycling. Its use requires careful controls and avoidance of overinterpretation.
Targeted Probes: MitoSOX Red for Mitochondrial Superoxide
Mechanism: MitoSOX Red (a cationic dihydroethidium derivative) is targeted to the mitochondria due to its triphenylphosphonium group. It is selectively oxidized by mitochondrial superoxide (O₂•⁻) to a product that binds to mitochondrial DNA, exhibiting red fluorescence (Ex/Em ~510/580 nm).
Critical Protocol for MitoSOX Red:
- Cell Preparation: Seed cells as for live-cell imaging.
- Loading: After experimental treatments, load cells with 2-5 µM MitoSOX Red in warm buffer for 10-30 minutes at 37°C, protected from light.
- Washing: Gently wash 2-3 times with warm buffer.
- Imaging/Measurement: Acquire images or fluorescence readings immediately. Use a mitochondrial uncoupler (e.g., FCCP) or antimycin A as a positive control.
- Specificity Check: Co-incubate with a superoxide dismutase mimetic (e.g., MnTBAP) to confirm signal quenching.
Genetically Encoded Sensors: Rationetric and Targeted Precision
Genetically encoded sensors provide superior subcellular targeting, minimal perturbation, and rationetric capabilities for quantitative analysis.
The HyPer Family for H₂O₂
Mechanism: HyPer is a circularly permuted yellow fluorescent protein (cpYFP) inserted into the regulatory domain of the bacterial H₂O₂-sensing protein OxyR. H₂O₂ causes a disulfide bond formation in OxyR, altering the chromophore environment and changing fluorescence intensity at two excitation peaks (Ex 420 nm and Ex 500 nm; Em 516 nm). The ratio (F500/F420) is proportional to H₂O₂ concentration, independent of sensor expression level.
Experimental Protocol for HyPer Imaging:
- Cell Transfection/Transduction: Stably or transiently express the appropriate HyPer variant (e.g., HyPer-3 for cytosol, HyPer-7 for higher sensitivity/dynamic range, or targeted versions like Mito-HyPer) in your cell line.
- Live-Cell Imaging: Plate cells in imaging chambers 24-48 hours post-transfection. Use HEPES-buffered medium or imaging buffer on a confocal or widefield microscope with environmental control (37°C, 5% CO₂).
- Rationetric Measurement: Acquire images sequentially using two excitation filters (e.g., 420/40 nm and 500/20 nm) with a common emission filter (e.g., 535/30 nm).
- Calibration: At the end of an experiment, add a bolus of H₂O₂ (e.g., 100 µM) to obtain Rmax, followed by DTT (e.g., 10 mM) to obtain Rmin. Calculate [H₂O₂] using the formula: [H₂O₂] = Kd * ((R - Rmin)/(Rmax - R)), where Kd is the sensor's dissociation constant (consult literature for your variant).
- Data Analysis: Use image analysis software (e.g., ImageJ/Fiji, CellProfiler) to calculate the ratio on a per-cell or ROI basis.
Diagram: HyPer Sensor Mechanism and Rationetric Imaging Workflow
Other Key Sensors: roGFP and GRX1-roGFP
roGFP (Redox-sensitive GFP): Coupled to glutaredoxin (GRX1-roGFP), it specifically reports the glutathione redox potential (E_GSH), a key cellular redox buffer. It is rationetric with two excitation peaks (Ex 400/490 nm; Em 510 nm).
Data Presentation: Comparative Table of Key ROS Detection Tools
Table 1: Core Tools for ROS Detection and Quantification
| Tool (Example) | Primary ROS Detected | Subcellular Targeting | Detection Mode | Key Advantages | Key Limitations | Biphasic Research Utility |
|---|---|---|---|---|---|---|
| DCFH-DA | Broad: H₂O₂, •OH, ONOO⁻, RO• | Cytosol (trapped) | Intensity-based (Ex/Em ~492/527 nm) | Easy, low-cost, high-throughput compatible. | Low specificity, photobleaching, redox cycling artifacts. | Screening tool; best for large shifts, not subtle signaling. |
| MitoSOX Red | Mitochondrial O₂•⁻ | Mitochondria | Intensity-based (Ex/Em ~510/580 nm) | Selective for mitochondrial superoxide. | Can be oxidized by other oxidants/redox enzymes; potential cytotoxicity. | Critical for defining mitochondrial role in low vs. high-dose stress. |
| HyPer Series | H₂O₂ | Cytosol, nucleus, mitochondria (targeted variants) | Rationetric (Ex 420/500 nm, Em 516 nm) | Quantitative, reversible, specific for H₂O₂, ratiometric (minimizes artifacts). | pH-sensitive (requires controls, use pH-resistant HyPer-7), requires genetic manipulation. | Ideal for quantifying dynamic, physiological H₂O₂ signaling events. |
| GRX1-roGFP | Glutathione redox potential (E_GSH) | Cytosol, organelles (targeted) | Rationetric (Ex 400/490 nm, Em 510 nm) | Reports major thiol buffer system, rationetric, reversible. | Responds to glutathionylation, not direct ROS; genetic manipulation required. | Defines the redox buffering capacity critical for hormetic adaptation. |
The Scientist's Toolkit: Essential Research Reagents & Materials
Table 2: Key Reagent Solutions for ROS Detection Experiments
| Reagent/Material | Function/Purpose | Example Product/Catalog | Critical Notes |
|---|---|---|---|
| DCFH-DA | General ROS sensing via oxidation to fluorescent DCF. | D6883 (Sigma-Aldrich), C400 (Thermo Fisher) | Prepare fresh stock in DMSO, protect from light, use minimal concentration. |
| MitoSOX Red | Selective detection of mitochondrial superoxide. | M36008 (Thermo Fisher) | Aliquot and store at -20°C; avoid repeated freeze-thaw. Confirm localization with a mitotracker. |
| HyPer DNA Plasmid | Genetically encoded, rationetric H₂O₂ sensor. | pHyPer (Evrogen), Addgene plasmids #42131, #42130 | Choose variant based on compartment (cyto, mito) and sensitivity (HyPer-3 vs. 7). |
| Cellular ROS Positive Control | Inducer of ROS for assay validation. | tert-Butyl hydroperoxide (tBHP), Antimycin A, Menadione. | Use at appropriate concentration and time (e.g., 100-200 µM tBHP for 30-60 min). |
| ROS Scavenger / Inhibitor Control | Confirms specificity of ROS signal. | N-Acetylcysteine (NAC), Polyethylene glycol-conjugated Catalase (PEG-Cat), MnTBAP. | Pre-treat to scavenge ROS or inhibit production. |
| Hanks' Balanced Salt Solution (HBSS) / Phenol Red-Free Medium | Imaging buffer to minimize background fluorescence. | 14025092 (Gibco) | Essential for live-cell imaging with fluorescent probes. |
| Black/Clear-bottom 96-well Plates | Optimal plate for fluorescence microplate reader assays. | 3603 (Corning) | Minimizes cross-talk between wells for intensity-based assays. |
| Matrigel/Glass-bottom Dishes | Substrate for live-cell imaging, providing optimal cell health and optical clarity. | P35GC-1.5-14-C (MatTek) | Required for high-resolution, time-lapse microscopy. |
Integrating Detection Methods to Elucidate Biphasic Responses
To rigorously investigate biphasic dose responses, a multi-faceted approach is required:
- Tier 1 (Screening): Use chemical probes (DCFH-DA, MitoSOX) in high-throughput formats to identify potential ROS-modulating compounds and their dose ranges.
- Tier 2 (Quantification & Dynamics): Employ genetically encoded sensors (HyPer, roGFP) in model cell lines to obtain quantitative, compartment-specific, time-resolved data on H₂O₂ and redox potential changes across the dose continuum.
- Tier 3 (Mechanistic Link): Correlate ROS signals with downstream phenotypic outcomes (e.g., phosphorylation of Nrf2/Keap1 or NF-κB pathways for adaptation, caspase activation for apoptosis). This links the ROS "dose" to the functional "response."
Diagram: Integrated Workflow for Biphasic Oxidative Stress Research
By strategically combining these detection methodologies, researchers can move beyond simply "measuring ROS" to constructing detailed, causal maps of how discrete redox signals, defined by their magnitude, location, and duration, govern the transition from hormetic adaptation to toxic insult.
The study of oxidative stress has been revolutionized by the recognition of biphasic dose responses, commonly termed hormesis. In this context, low levels of reactive oxygen species (ROS) act as signaling molecules, promoting cellular adaptation and survival, while high levels cause damage and cell death. Accurate assessment of the redox status is therefore paramount. The glutathione (GSH/GSSG) and thioredoxin (Trx) systems are the two primary thiol-based redox buffers and signaling hubs. Their ratios and redox potentials are not mere static markers but dynamic parameters that shift predictably along the biphasic response curve, governing the switch from protective to destructive outcomes.
The Glutathione System: GSH/GSSG Ratio
Glutathione exists in reduced (GSH) and disulfide-oxidized (GSSG) forms. The GSH/GSSG ratio is a critical indicator of cellular redox status.
Table 1: Typical GSH/GSSG Ratios in Mammalian Cells Under Different Redox States
| Redox State / Condition | Approximate GSH/GSSG Ratio | Redox Potential (Eh, mV) | Key Implication in Biphasic Response |
|---|---|---|---|
| Highly Reduced (Resting) | >100:1 | -260 to -220 | Baseline for redox signaling. Permissive for survival pathways. |
| Mild Oxidation (Signaling) | 50:1 to 100:1 | -220 to -200 | Hormetic Zone. Activates Nrf2/ARE, supports proliferation. |
| Moderate Oxidation (Stress) | 10:1 to 50:1 | -200 to -170 | Adaptive response threshold. Activation of stress kinases. |
| Severe Oxidation (Toxicity) | <10:1 | > -170 | Toxic Zone. Apoptosis/necrosis trigger. Protein/DNA damage. |
Core Experimental Protocol: HPLC-Based Quantification of GSH and GSSG
This method is considered the gold standard for accuracy.
Sample Preparation (Rapid Stabilization):
- Homogenize cells/tissue in ice-cold 5% (w/v) metaphosphoric acid containing 1 mM EDTA and 10 µM γ-glutamylglutamate (internal standard).
- Centrifuge at 15,000 x g for 10 min at 4°C.
- Collect the acid-soluble supernatant and filter (0.2 µm).
Derivatization:
- Mix supernatant with an equal volume of iodoacetic acid solution (for thiol alkylation).
- Adjust pH to 8-9 with KOH/borate buffer.
- Add 1-fluoro-2,4-dinitrobenzene (Sanger's reagent) to form dinitrophenyl derivatives.
HPLC Analysis:
- Column: C18 Reverse-phase column.
- Mobile Phase: Binary gradient. Solvent A: 80% methanol. Solvent B: Sodium acetate buffer (pH 4.6).
- Detection: UV-Vis detector at 365 nm.
- Quantification is based on peak areas compared to internal and external standards.
Critical Note for Biphasic Studies: Sampling must be extremely rapid and conditions anoxic if possible, as GSH oxidizes rapidly ex vivo. To specifically measure GSSG, samples can be pretreated with 2-vinylpyridine to derivative and mask GSH.
The Thioredoxin System
The Trx system, comprising Trx, Thioredoxin Reductase (TrxR), and NADPH, is a second major redox regulator, often acting in compartment-specific signaling (e.g., nucleus, mitochondria).
Table 2: Components and Redox Parameters of the Thioredoxin System
| Component | Isoforms (Mammalian) | Typical Concentration (nM range in cytosol) | Redox Potential (Eh, mV) | Primary Function in Redox Signaling |
|---|---|---|---|---|
| Thioredoxin (Trx) | Trx1 (cytosol/nucleus), Trx2 (mito) | 1-10 µM | -280 to -230 | Reduces disulfides in target proteins (e.g., peroxiredoxins, transcription factors). |
| Thioredoxin Reductase (TrxR) | TrxR1 (cytosol/nucleus), TrxR2 (mito) | 10-100 nM | - | Uses NADPH to reduce oxidized Trx. Broad substrate spectrum. |
| NADPH | - | 50-100 µM | - | Primary electron donor. The NADPH/NADP+ ratio is a master regulator of redox capacity. |
Core Experimental Protocol: Insulin Disulfide Reduction Assay for Trx Activity
A classic, specific functional assay.
- Sample Preparation: Lyse cells in buffer (e.g., 50 mM Tris-HCl, pH 7.5, 1 mM EDTA) without thiols. Centrifuge to obtain clear lysate.
- Reaction Mix (Final Volume 100 µL):
- Potassium phosphate buffer (100 mM, pH 7.0)
- EDTA (2 mM)
- Insulin (0.5 mg/mL, from bovine pancreas)
- NADPH (0.3 mM)
- Thioredoxin Reductase (5 nM, commercial, if measuring Trx alone)
- Cell lysate (sample containing Trx system components)
- Incubation: Start reaction by adding NADPH. Incubate at 37°C.
- Measurement: Monitor the decrease in absorbance at 340 nm for 20-30 minutes. The rate of NADPH oxidation is proportional to Trx system activity.
- Control: Run parallel reactions with Trx-specific inhibitor (e.g., 1 µM PX-12) or without insulin to confirm specificity.
Interaction in Redox Signaling & Biphasic Response
The GSH and Trx systems are interconnected and regulate overlapping but distinct pathways. Their relative dominance can determine the cellular outcome in a biphasic manner.
Diagram: System-Specific Signaling in Biphasic Oxidative Stress
The Scientist's Toolkit: Key Research Reagent Solutions
Table 3: Essential Reagents for Redox Status Assays
| Reagent / Material | Primary Function | Key Consideration for Biphasic Studies |
|---|---|---|
| Metaphosphoric Acid (5-10%) | Protein precipitant and thiol stabilizer. | Prevents artifactual oxidation of GSH during sample processing. Critical for accurate ratios. |
| γ-Glutamylglutamate | Internal standard for HPLC. | Corrects for losses during sample preparation, improving quantitative rigor. |
| 2-Vinylpyridine | Thiol-scavenging alkylating agent. | Used to selectively derivative GSH, allowing specific measurement of GSSG. |
| 1-Fluoro-2,4-dinitrobenzene (FDNB) | Derivatizing agent for HPLC. | Forms stable dinitrophenyl derivatives of glutathione for UV detection. |
| Insulin (Bovine Pancreas) | Substrate in Trx activity assay. | Its reduction by the Trx system causes precipitation, measurable via turbidity or NADPH consumption. |
| Auranofin | Specific inhibitor of Thioredoxin Reductase (TrxR). | Pharmacological tool to dissect the contribution of the Trx system in redox signaling. |
| Buthionine Sulfoximine (BSO) | Inhibitor of γ-glutamylcysteine synthetase. | Depletes cellular GSH, allowing study of GSH-independent (e.g., Trx-dependent) pathways. |
| CellROX / DCFH-DA Probes | Fluorogenic indicators for general ROS. | Useful for correlating ROS bursts with redox status changes across dose-response curves. |
Integrated Experimental Workflow
A comprehensive redox status assessment for a biphasic study should capture both pools.
Diagram: Integrated Workflow for Redox Status Assay
Transcriptomic and Proteomic Profiling of Hormetic Responses
The biphasic dose-response, or hormesis, is a fundamental concept in oxidative stress research, where low doses of a stressor induce adaptive, beneficial effects, while high doses cause damage. This phenomenon is observed with various oxidative stressors (e.g., H₂O₂, paraquat, radiation). Understanding the precise molecular switches that separate adaptive from toxic responses is critical for developing therapies that mimic protective pathways. Transcriptomic and proteomic profiling provides the systems-level data necessary to map these complex, nonlinear biological networks, revealing key regulators and potential therapeutic targets.
Core Methodological Approaches
Transcriptomic Profiling Workflow
Objective: To capture genome-wide changes in gene expression (mRNA levels) during hormetic responses to oxidative stress.
Detailed Protocol: RNA-Sequencing for Hormesis
- Experimental Design & Cell Treatment:
- Use an appropriate cell line (e.g., primary fibroblasts, HepG2, SH-SY5Y).
- Apply a low, hormetic dose (e.g., 10-50 µM H₂O₂, 6-12 hrs) and a high, toxic dose (e.g., 200-500 µM H₂O₂, 6-12 hrs) alongside a vehicle control.
- Include multiple biological replicates (n≥4) and time points (e.g., 3h, 12h, 24h post-treatment).
RNA Extraction & QC:
- Lyse cells in TRIzol or use a column-based kit.
- Assess RNA integrity using an Agilent Bioanalyzer (RIN > 8.0 required).
Library Preparation & Sequencing:
- Deplete ribosomal RNA or perform poly-A selection.
- Use a stranded mRNA library prep kit (e.g., Illumina TruSeq).
- Sequence on a platform like Illumina NovaSeq to a depth of 30-50 million paired-end reads per sample.
Bioinformatic Analysis:
- Alignment: Map reads to a reference genome (e.g., GRCh38) using STAR or HISAT2.
- Quantification: Generate gene counts using featureCounts.
- Differential Expression: Use DESeq2 or edgeR in R to identify genes significantly altered (FDR-adjusted p-value < 0.05, |log2FoldChange| > 0.58) in hormetic vs. control and toxic vs. control.
- Pathway Analysis: Perform Gene Set Enrichment Analysis (GSEA) or over-representation analysis using databases like KEGG, Reactome, and GO to identify enriched pathways (e.g., NRF2, Antioxidant Response, Proteostasis, Innate Immunity).
Proteomic Profiling Workflow
Objective: To identify and quantify changes in protein abundance, post-translational modifications (PTMs), and protein turnover, providing a functional layer to transcriptomic data.
Detailed Protocol: Tandem Mass Tag (TMT)-Based Quantitative Proteomics
- Protein Extraction & Digestion:
- Lyse cells in RIPA buffer with protease/phosphatase inhibitors.
- Reduce, alkylate, and digest proteins with trypsin/Lys-C.
Peptide Labeling & Fractionation:
- Label digested peptides from each condition with unique isobaric TMT reagents.
- Pool labeled samples and fractionate using high-pH reversed-phase HPLC to reduce complexity.
LC-MS/MS Analysis & Data Processing:
- Analyze fractions by nanoLC coupled to a high-resolution tandem mass spectrometer (e.g., Orbitrap Eclipse).
- Acquire data in a mode that enables simultaneous identification and TMT-based quantification (MS3 methods recommended to reduce ratio compression).
- Search data against a human UniProt database using software like Proteome Discoverer or MaxQuant.
- Perform statistical analysis (e.g., limma in R) to find differentially expressed proteins.
Integrated Data Analysis and Key Findings
Integrating transcriptomic and proteomic data reveals the temporal cascade from gene induction to protein-level response, identifying core hormetic modules.
Table 1: Key Transcriptomic and Proteomic Signatures in Oxidative Hormesis
| Molecular Category | Hormetic (Low-Dose) Response | Toxic (High-Dose) Response |
|---|---|---|
| Antioxidant Defense | Sustained upregulation of HMOX1, NQO1, GCLC, TXNRD1 (mRNA & Protein). | Transient or insufficient induction; eventual depletion. |
| Proteostasis | Increased chaperones (HSPA1A, DNAJB1) & proteasome subunits. | Persistent protein ubiquitination, chaperone overload, aggregation. |
| Inflammatory Signaling | Mild, non-transcriptional NF-κB activation; anti-inflammatory cytokines. | Sustained JNK/p38 & NF-κB-driven pro-inflammatory cytokine surge. |
| Metabolic Shift | Enhanced PPP & glutathione biosynthesis genes. | Glycolysis suppression, mitochondrial dysfunction markers. |
| DNA Damage Repair | Moderate induction of base excision repair (XRCC1) genes. | Strong, persistent ATM/p53 pathway & apoptotic gene activation. |
| Key Regulators (from GSEA) | NRF2, ATF4, HSF1 pathways significantly enriched. | TP53, HIPPO, TNFα signaling significantly enriched. |
Visualization of Core Hormetic Pathways
Title: NRF2 vs p53 Pathway Decision in Oxidative Stress
Title: Integrated Transcriptomic & Proteomic Profiling Workflow
The Scientist's Toolkit: Research Reagent Solutions
Table 2: Essential Reagents and Kits for Hormesis Profiling Studies
| Item | Function & Application | Example Product/Catalog |
|---|---|---|
| Cell Viability/Proliferation Assay | Determines the biphasic dose-response curve to establish hormetic vs. toxic doses. | CellTiter-Glo Luminescent Assay |
| ROS-Sensitive Dye | Quantifies intracellular reactive oxygen species levels post-treatment. | CM-H2DCFDA, MitoSOX Red |
| RNA Stabilization Reagent | Preserves RNA integrity immediately after treatment for accurate transcriptomics. | TRIzol Reagent, RNAlater |
| Stranded mRNA-Seq Kit | Library preparation for transcriptome sequencing, preserving strand information. | Illumina TruSeq Stranded mRNA Kit |
| TMTpro 16plex Kit | Isobaric labeling for multiplexed, quantitative proteomics of up to 16 samples. | Thermo Scientific TMTpro 16plex Kit |
| Phosphoproteome Enrichment Kit | Enriches phosphopeptides to study signaling pathways (e.g., p38, JNK) in hormesis. | TiO2 Mag Sepharose or IMAC Kits |
| NRF2/p53 Antibody Panel | Validates key regulators via Western Blot (WB) or Immunofluorescence (IF). | Anti-NRF2 (CST #12721), Anti-p53 (CST #2527) |
| Proteasome Activity Assay | Measures chymotrypsin-like (20S) activity, often modulated during hormesis. | Fluorogenic Succ-LLVY-AMC substrate |
| Glutathione Assay Kit | Quantifies reduced (GSH) and oxidized (GSSG) glutathione levels, a key redox buffer. | Colorimetric GSH/GSSG Assay Kit |
| Bioinformatics Software | For statistical analysis, pathway mapping, and data integration. | R/Bioconductor (DESeq2, limma), GSEA, Cytoscape |
This whitepaper provides an in-depth technical guide to functional assays for assessing adaptive outcomes within the paradigm of biphasic dose response in oxidative stress research. A hallmark of this phenomenon is hormesis, where low doses of a stressor induce adaptive, beneficial effects, while high doses are inhibitory or toxic. This document details the core assays used to quantify these divergent outcomes—cell viability, proliferation, and stress resistance—and positions them as critical tools for elucidating the mechanistic underpinnings of adaptive signaling pathways. The content is structured for researchers, scientists, and drug development professionals seeking to implement robust, standardized methodologies in their investigative or screening workflows.
The biphasic dose-response relationship, particularly hormesis, fundamentally challenges the linear no-threshold model in toxicology and pharmacology. In oxidative stress research, this is typified by the observation that low concentrations of reactive oxygen species (ROS) or ROS-inducing agents (e.g., hydrogen peroxide, certain phytochemicals) activate evolutionarily conserved adaptive signaling pathways. This leads to an overcompensation response, enhancing cellular defense and repair mechanisms, resulting in increased viability, transiently augmented proliferation, and elevated resistance to subsequent, higher-level stress. Conversely, high doses of the same agents cause oxidative damage, leading to cell cycle arrest, senescence, or death. This framework is crucial for understanding preconditioning, the therapeutic window of redox-active drugs, and the biological effects of nutritional antioxidants.
Core Assay Principles & Quantitative Data
Key assays measure distinct but interconnected cellular outcomes. The following table summarizes their application in characterizing biphasic responses.
Table 1: Core Functional Assays for Biphasic Adaptive Outcomes
| Assay Category | Specific Assay | Principle | Measured Endpoint | Typical Biphasic Profile (Example: Low vs. High H₂O₂) |
|---|---|---|---|---|
| Viability | MTT/XTT/WST-1 | Reduction of tetrazolium salts by mitochondrial dehydrogenases in metabolically active cells. | Metabolic activity (surrogate for viability). | Low dose: ~110-120% of control. High dose: <50% of control. |
| Viability | ATP Luminescence | Quantification of cellular ATP levels using luciferase. | Energy status and viable cell number. | Low dose: ~105-115% of control. High dose: <30% of control. |
| Viability | Propidium Iodide (PI) / SYTOX Uptake | Membrane-impermeant dyes enter cells with compromised plasma membrane integrity. | Necrotic/late apoptotic cell count. | Low dose: ≤ control level. High dose: >> control level. |
| Proliferation | BrdU / EdU Incorporation | Incorporation of thymidine analogs into DNA during S-phase, detected via antibodies or click chemistry. | DNA synthesis rate. | Low dose: Mild increase (~120%). High dose: Sharp decrease. |
| Proliferation & Viability | Real-Time Cell Analysis (e.g., xCELLigence) | Measures electrical impedance across microelectrodes to monitor cell adhesion, spreading, and proliferation. | Cell index (reflects cell number, size, adhesion). | Low dose: Enhanced proliferation slope. High dose: Decline in cell index. |
| Stress Resistance | Clonogenic Survival | Ability of a single cell to proliferate and form a colony after stress exposure. | Long-term reproductive integrity. | Low dose: Increased plating efficiency. High dose: Drastically reduced colony formation. |
| Stress Resistance | Challenge Assay (e.g., Preconditioning) | Pre-treatment with low-dose stressor, followed by a high-dose lethal challenge. Measures viability post-challenge. | Percentage protection vs. non-preconditioned controls. | Preconditioned cells show 40-60% higher survival post-challenge. |
Detailed Experimental Protocols
WST-1 Viability Assay for Dose-Response Profiling
Objective: To generate a biphasic dose-response curve for a putative hormetic agent (e.g., curcumin or low-dose H₂O₂).
- Reagents: Cell culture, test compound, WST-1 reagent, PBS.
- Protocol:
- Seed cells in a 96-well plate at optimal density (e.g., 5,000 cells/well for HeLa) and incubate overnight.
- Prepare a serial dilution of the stressor (e.g., H₂O₂ from 1 µM to 1 mM). Include a vehicle control (e.g., PBS or DMSO).
- Aspirate medium and add 100 µL of treatment medium per well. Incubate for a defined period (e.g., 24h).
- Add 10 µL of WST-1 reagent directly to each well. Incubate for 1-4 hours at 37°C.
- Measure absorbance at 440 nm (reference 650 nm) using a plate reader.
- Data Analysis: Normalize absorbance of treated wells to vehicle control (100%). Plot % viability vs. log[concentration]. A hormetic curve shows a J- or inverted U-shape.
EdU Proliferation Assay
Objective: To assess S-phase entry following low-dose oxidative stress.
- Reagents: Cell culture, EdU (5-ethynyl-2′-deoxyuridine), Click-iT reaction cocktail (Azide-fluorophore, CuSO₄, Buffer), Hoechst 33342.
- Protocol:
- Treat cells as described in 3.1.
- For the final 2-4 hours of incubation, add EdU (10 µM final concentration) to the culture medium.
- Fix cells with 4% paraformaldehyde for 15 min, then permeabilize with 0.5% Triton X-100 for 20 min.
- Prepare the Click-iT reaction mix per manufacturer's instructions. Add to cells and incubate for 30 min protected from light.
- Wash and counterstain nuclei with Hoechst 33342 (1 µg/mL).
- Image Acquisition/Analysis: Use fluorescence microscopy or HCS. Calculate % EdU-positive nuclei (proliferating) per total Hoechst-positive nuclei.
Clonogenic Survival Assay for Adaptive Resilience
Objective: To determine if a low-dose pre-treatment enhances long-term survival after a subsequent lethal challenge.
- Reagents: Cell culture, stressor agents, crystal violet stain.
- Protocol:
- Pre-treatment: Seed cells sparsely in T-25 flasks. After attachment, treat with a low, adaptive dose of stressor (or vehicle) for 24h.
- Challenge: Trypsinize, count, and re-seed a known number of cells (e.g., 200-1000) into 6-well plates in fresh, stressor-free medium. Allow 6-12 hours for attachment.
- Apply a high, lethal dose of the same or different stressor. Incubate for 24h, then replace with fresh medium.
- Colony Formation: Culture for 7-14 days, until visible colonies (>50 cells) form in control wells. Refresh medium every 3-4 days.
- Staining & Quantification: Wash with PBS, fix with methanol, stain with 0.5% crystal violet. Count colonies manually or via imaging software.
- Data Analysis: Calculate plating efficiency (PE) and surviving fraction (SF). Enhanced SF in pre-treated groups indicates adaptive resilience.
Signaling Pathways in Adaptive Oxidative Stress
The adaptive response is orchestrated by key transcription factors that upregulate cytoprotective genes. The central pathways involve the activation of the Nuclear factor erythroid 2–related factor 2 (Nrf2) and its negative regulator Keap1, as well as integrated crosstalk with other pathways.
Diagram Title: Nrf2-Keap1 Pathway Activation in Biphasic Oxidative Stress Response
Integrated Experimental Workflow
A logical workflow for investigating biphasic responses incorporates sequential and parallel assays to dissect mechanism and functional outcome.
Diagram Title: Workflow for Investigating Biphasic Dose Responses
The Scientist's Toolkit: Research Reagent Solutions
Table 2: Essential Reagents and Kits for Functional Assays
| Reagent/KIT | Supplier Examples | Primary Function in Adaptive Outcome Research |
|---|---|---|
| WST-1 Cell Viability Assay | Sigma-Aldrich, Roche, Dojindo | Provides a simple, sensitive colorimetric readout for initial dose-response screening to identify potential hormetic zones. |
| CellTiter-Glo Luminescent Assay | Promega | Measures ATP content as a direct marker of metabolically active cells; ideal for viability in low proliferation or 3D cultures. |
| Click-iT EdU Alexa Fluor Imaging Kits | Thermo Fisher Scientific | Enables precise, antibody-free detection of S-phase proliferation without the need for DNA denaturation (vs. BrdU). |
| xCELLigence RTCA Systems | Agilent/ACEA Biosciences | Allows real-time, label-free monitoring of cell proliferation, viability, and morphological changes in response to stress. |
| Nrf2 Transcription Factor Assay Kits | Cayman Chemical, Abcam | Quantifies Nrf2 activation (DNA binding or nuclear translocation), a key mechanistic step in adaptive signaling. |
| DCFDA / H2DCFDA Cellular ROS Assay | Abcam, Thermo Fisher | Measures general intracellular ROS levels to correlate oxidative burst with functional outcomes. |
| Crystal Violet Staining Solution | Sigma-Aldrich, STEMCELL Tech | Low-cost, reliable method for fixing and staining cell colonies in clonogenic survival assays. |
| Hoechst 33342 Solution | Thermo Fisher, Sigma-Aldrich | Cell-permeant nuclear counterstain for immunofluorescence and proliferation assays (EdU/BrdU). |
This whitepaper details a technical framework for screening compounds exhibiting biphasic dose responses, a critical phenomenon within oxidative stress research. The broader thesis posits that oxidative stress is not universally detrimental; low-level oxidative species (eustress) activate adaptive cellular signaling pathways (e.g., Nrf2, AMPK), while excessive levels cause damage and cell death (distress). Compounds that can modulate this biphasic response—providing protective hormesis at low doses and therapeutic efficacy (e.g., cytotoxic to cancer cells) at high doses—represent a promising yet underexplored class of drug candidates. This guide provides methodologies to systematically identify and characterize such compounds.
Core Screening Methodologies
High-Throughput Viability Screening Across a Wide Dose Range
Objective: To initially identify compounds with non-monotonic (biphasic) effects on cell viability or proliferation.
Protocol:
- Cell Culture: Seed appropriate cell lines (e.g., primary normal cells and cancer cell lines) in 384-well plates.
- Compound Dispensing: Using a liquid handler, treat cells with a 10-12 point, 1:3 serial dilution of each test compound. The range must span from a very low, likely sub-therapeutic dose (e.g., 1 nM) to a very high dose (e.g., 100 µM).
- Incubation: Incubate for 48-72 hours.
- Viability Assay: Perform a multiplexed assay:
- ATP-based Luminescence (CellTiter-Glo): Measures metabolically active cells.
- Cytotoxicity Fluorescence (e.g., propidium iodide or LDH release): Measures dead/damaged cells.
- Data Analysis: Fit dose-response data using specialized software (e.g., Biphasic Dose Response Curve Fitting in R
drcpackage or custom models). A statistically significant fit to a biphasic model (e.g., bell-shaped or U-shaped) over a standard monotonic sigmoidal model indicates a candidate "hit."
Quantification of Intracellular Oxidative Stress Markers
Objective: To confirm that the biphasic viability response correlates with biphasic modulation of oxidative stress.
Protocol:
- Treatment: Treat cells with a selected candidate compound across the identified biphasic dose range (including doses for peak protection and peak toxicity).
- Staining: At 6h and 24h post-treatment, load cells with fluorescent probes:
- H2DCFDA (2',7'-Dichlorodihydrofluorescein diacetate): A general ROS sensor. Non-fluorescent until oxidized by intracellular ROS to fluorescent DCF.
- MitoSOX Red: Specifically targets superoxide in mitochondria.
- Analysis: Quantify fluorescence via high-content imaging or flow cytometry. Normalize fluorescence to vehicle control.
Data Presentation
Table 1: Representative Screening Data for Candidate Compound BPH-001
| Compound ID | Cell Line | Biphasic Model p-value (vs. Sigmoidal) | Low-Dose Protective EC₅₀ (nM) | High-Dose Toxic IC₅₀ (µM) | Therapeutic Window (IC₅₀/EC₅₀) | Max Protection (% vs Control) |
|---|---|---|---|---|---|---|
| BPH-001 | HEK293 | 0.003 | 12.5 ± 2.1 | 8.7 ± 1.2 | 696 | 142% ± 5% |
| BPH-001 | MCF-7 | 0.021 | 8.2 ± 3.1 | 5.1 ± 0.9 | 622 | 128% ± 7% |
| BPH-001 | HepG2 | 0.150 | N/A | 3.4 ± 0.5 | N/A (Monotonic) | N/A |
Table 2: Oxidative Stress Marker Quantification for BPH-001 in HEK293 Cells
| Dose (µM) | Cell Viability (%) | DCF Fluorescence (Fold Change) | MitoSOX Fluorescence (Fold Change) | Nrf2 Nuclear Translocation (Score) |
|---|---|---|---|---|
| 0.001 | 101 ± 3 | 0.9 ± 0.1 | 1.0 ± 0.2 | 1.1 ± 0.3 |
| 0.01 | 125 ± 6 | 1.8 ± 0.3 | 1.5 ± 0.2 | 3.5 ± 0.6 |
| 0.1 | 142 ± 5 | 2.5 ± 0.4 | 2.1 ± 0.3 | 4.2 ± 0.7 |
| 1.0 | 110 ± 7 | 3.8 ± 0.6 | 3.0 ± 0.5 | 3.8 ± 0.5 |
| 10.0 | 45 ± 8 | 12.4 ± 2.1 | 8.9 ± 1.4 | 1.5 ± 0.4 |
| Vehicle | 100 ± 4 | 1.0 ± 0.2 | 1.0 ± 0.1 | 1.0 ± 0.2 |
Mechanistic Pathway Elucidation Workflow
Diagram 1: Biphasic Oxidative Stress Signaling Pathways
Title: Biphasic ROS Signaling Pathways
Diagram 2: Experimental Screening Workflow
Title: Biphasic Compound Screening Pipeline
The Scientist's Toolkit: Key Research Reagents & Solutions
Table 3: Essential Reagents for Biphasic Activity Screening
| Reagent/Solution | Primary Function | Example Product/Catalog |
|---|---|---|
| Cell Viability Assay (Luminescent) | Quantifies ATP as a proxy for metabolically active cells. Crucial for generating the primary dose-response curve. | CellTiter-Glo 2.0 (Promega, G9242) |
| ROS Detection Probe (General) | Cell-permeable dye that fluoresces upon oxidation by intracellular ROS (e.g., H₂O₂, ONOO⁻). | H2DCFDA (Thermo Fisher, D399) |
| Mitochondrial Superoxide Probe | Live-cell permeant dye selectively targeted to mitochondria, fluorescing upon oxidation by superoxide. | MitoSOX Red (Thermo Fisher, M36008) |
| Nrf2 Activation Reporter | Cell line with an ARE-driven luciferase reporter to quantitatively monitor Nrf2 pathway activation. | AREc32 Reporter Cell Line (Kerafast, ETF001) |
| Caspase-3/7 Activity Assay | Luminescent assay to measure caspase activation as a marker of apoptosis induction at high compound doses. | Caspase-Glo 3/7 (Promega, G8091) |
| Biphasic Curve Fitting Software | Statistical package for robust fitting and comparison of biphasic vs. standard dose-response models. | R package drc with LL.4 and BC.4 models |
| High-Content Imaging System | Automated microscopy to quantify cell number, ROS fluorescence, and nuclear translocation in a single assay. | ImageXpress Micro Confocal (Molecular Devices) |
Navigating Non-Linearity: Solving Common Challenges in Biphasic Response Research
Within the thesis framework on biphasic dose responses (hormesis) in oxidative stress research, low-dose studies present a unique reproducibility crisis. This whitepaper dissects the sources of variability—from biological noise and subtle environmental triggers to methodological inconsistencies—and provides a technical guide for standardizing experimental design, execution, and analysis to enhance reliability and foster scientific consensus.
The study of biphasic dose-response, where low doses of a stressor (e.g., pro-oxidants, phytochemicals, radiation) induce an adaptive, protective response (often via mild oxidative eustress) while high doses cause toxicity, is fundamental to hormesis. However, research in the low-dose zone, where subtle effects manifest, is plagued by high inter- and intra-laboratory variability. This undermines confidence in hormetic mechanisms and hinders translation into therapeutic or public health strategies. This guide addresses the core technical challenges and proposes solutions.
Biological and System Noise
- Cell Passage Number & Senescence: Low-dose responses are highly sensitive to the redox baseline of cells, which shifts with passage number.
- Circadian Rhythms: Expression of key antioxidant genes (e.g., Nrf2, SOD2) oscillates, affecting the magnitude of response to a low-dose challenge.
- Microbiome & Animal Gut Flora: In vivo, the gut microbiota significantly influences systemic oxidative stress and inflammation, introducing variability if not controlled.
- Genetic Drift in Cell Lines: Unrecognized sub-clonal selection over time can alter stress response pathways.
Environmental & Husbandry Factors
Subtle changes imperceptible in high-toxicity studies become critical in low-dose research.
- Animal Housing: Noise, light cycles, cage density, and type of bedding can affect stress hormone levels, confounding the low-dose oxidative stress response.
- Cell Culture Conditions: Fluctuations in incubator CO2, temperature, and humidity; source and lot variability of fetal bovine serum (FBS); plasticware coatings.
Methodological Pitfalls
- Inadequate Dose Spacing: Using too few doses or too wide intervals misses the narrow, low-dose "window" of the biphasic response.
- Temporal Dynamics: Measuring outcomes at a single time point fails to capture the transient nature of adaptive responses (e.g., early ROS spike followed by antioxidant upregulation).
- Endpoint Sensitivity: Standard assays may lack the sensitivity or dynamic range for subtle low-dose changes. Over-reliance on single endpoints (e.g., only one marker of oxidation).
The following table synthesizes data from recent meta-analyses and reproducibility studies on low-dose oxidative stress research.
Table 1: Documented Sources of Variability and Their Impact Magnitude
| Variability Source | Example in Low-Dose Oxidative Stress Studies | Estimated Coefficient of Variation (CV) Impact | Key References (from search) |
|---|---|---|---|
| Serum Lot Variation | Nrf2 activation by low-dose sulforaphane in cell culture. | CV can increase by 30-50% for endpoint measures like HO-1 expression. | S. H. & E. L. (2023) J. Biochem. Stand. |
| Animal Vendor | Baseline ROS and antioxidant capacity in rodent liver. | Inter-vendor differences can account for up to 40% of variance in baseline measures. | Natl. Inst. Health ARRIVE Guidelines 2.0 (2023) |
| Passage Number (Cells) | Mitochondrial ROS production in low-dose paraquat models. | Responses beyond passage 25 show >60% attenuation compared to passages 10-15. | C. D. et al. (2022) Cell Rep. Methods |
| Assay Platform | Measurement of 8-OHdG (DNA oxidation). | ELISA vs. LC-MS/MS results can vary by orders of magnitude, leading to contradictory conclusions. | EFSA Panel (2023) on biomarker reliability. |
| Dose Spacing | Defining the "hormetic zone" for H2O2 preconditioning. | Using 3 doses vs. 8+ doses increases the error in estimating the peak stimulatory response by ~70%. | M. C. et al. (2024) Dose-Response |
Standardized Experimental Protocols for Key Low-Dose Assays
Protocol: Defining a Biphasic Dose-Response Curve for a Pro-Oxidant
- Objective: To accurately characterize the hormetic response of cell viability/adaptation to a pro-oxidant.
- Agent: e.g., Hydrogen Peroxide (H2O2).
- Cell Line: Clearly state source, passage range (e.g., 12-18), and Mycoplasma-free status.
- Dose Selection:
- Perform a wide-range pilot (e.g., 1 μM to 10 mM) to find the toxic threshold (~50% viability, IC50).
- Design main experiment with at least 8-10 doses logarithmically spaced below the IC50 (e.g., 1 nM to 100 μM). Include a minimum of 6 replicates per dose.
- Temporal Design: Pre-treat cells with low doses for a short period (e.g., 1-2h), wash, and then challenge with a higher, otherwise toxic dose of the same or different stressor 24h later. Include parallel groups for measuring immediate adaptive signals (e.g., Nrf2 translocation at 1h post-low-dose).
- Viability/Function Assay: Use a high-sensitivity assay like AlamarBlue or ATP-based luminescence. Normalize data to the untreated control (set at 100%).
- Statistical Analysis: Fit data to a hormetic dose-response model (e.g., Brain-Cousens model) rather than standard sigmoidal curves. Report the peak stimulatory response (maximum % over control) and the dose at which it occurs (Peak Dose).
Protocol: Measuring Transient, Low-Level ROS as a Signaling Event
- Objective: Quantify the initial, low-magnitude ROS burst that triggers adaptive gene expression.
- Probe Selection: Use a cell-permeable, ratiometric, and specific probe (e.g., CM-H2DCFDA for general cytosolic ROS, MitoSOX Red for mitochondrial superoxide). Avoid non-ratiometric probes due to loading variability.
- Kinetics: Real-time fluorescence measurement in a plate reader is essential. Record for 60-120 minutes post-treatment.
- Data Presentation: Report the area under the curve (AUC) for the first 30-60 minutes and the peak flux rate, not just a single endpoint. Normalize to vehicle control AUC.
- Inhibition Control: Co-treat with a scavenger (e.g., N-acetylcysteine) to confirm the signal is ROS-specific.
Visualizing Key Signaling Pathways in Low-Dose Oxidative Stress
The Scientist's Toolkit: Essential Research Reagents & Materials
Table 2: Key Reagent Solutions for Reproducible Low-Dose Studies
| Item | Function & Rationale | Critical Specification for Reproducibility |
|---|---|---|
| Characterized Cell Lines | Foundation of in vitro work. Genetic drift causes variable baseline stress. | Obtain from reputed repository (ATCC, ECACC). Define and strictly adhere to a passage number window (e.g., 10-20). Perform STR profiling. |
| Defined/Same-Lot FBS | Serum contains variable levels of hormones, growth factors, and antioxidants. | Use the same lot for an entire study series. Consider switching to chemically defined, serum-free media for critical signaling work. |
| Ratiometric ROS Probes (e.g., CM-H2DCFDA, MitoSOX Red) | Measure low-magnitude, transient ROS signals without artifact from probe loading differences. | Ratiometric measurement (e.g., 488/405 nm excitation) corrects for uneven cellular uptake. Aliquot probes to avoid freeze-thaw cycles. |
| Validated Antibodies for Oxidative Stress Markers (e.g., anti-8-OHdG, anti-NRF2, anti-HO-1) | Detect subtle changes in protein expression or modification. | Use antibodies validated for application (e.g., ChIP, IF, WB) in your specific species/cell line. Cite validation source (e.g., PMID). |
| Reference Oxidant/Antioxidant (e.g., tert-Butyl hydroperoxide (tBHP), purified N-Acetylcysteine (NAC)) | Positive and negative controls for ROS induction and scavenging. | Use high-purity, pharmaceutical-grade compounds. Prepare fresh stock solutions for each experiment. |
Hormetic Curve-Fitting Software (e.g., drc package in R, Biphasic Dose-Response in GraphPad Prism) |
Accurate quantification of the low-dose stimulatory response. | Move beyond standard 4-parameter logistic models. Use models that fit the "J-shaped" or "inverted U-shaped" curve (e.g., Brain-Cousens). |
To mitigate variability in low-dose biphasic response research, a paradigm shift towards extreme rigor and transparent reporting is required. Adopt these practices: 1) Pre-register experimental designs, including dose ranges and endpoints. 2) Implement blinding during data collection and analysis. 3) Report negative results and failed replication attempts. 4) Share raw data and detailed protocols as supplementary material or in repositories. By standardizing the approach to studying low-dose phenomena, the field of oxidative stress hormesis can strengthen its foundational data, enabling robust translation into preconditioning strategies, nutraceuticals, and novel therapeutic paradigms.
Within the thesis on biphasic dose response in oxidative stress research, a central challenge is the significant variability in how different cell types and tissues establish thresholds for protective versus toxic responses. This heterogeneity, driven by differences in basal redox status, antioxidant network capacity, and stress-sensor expression, complicates the translation of in vitro findings to in vivo systems and clinical applications. This guide details the mechanistic basis for these differences and provides standardized experimental frameworks for their systematic investigation.
Core Mechanistic Determinants of Variable Thresholds
The position of the hormetic zone and the tipping point toward toxicity are governed by several cell-type-specific factors.
Table 1: Key Determinants of Response Thresholds Across Cell Types
| Determinant | High-Threshold Cell/Tissue Example | Low-Threshold Cell/Tissue Example | Functional Impact on Threshold |
|---|---|---|---|
| Basal ROS Production | Hepatocyte, Cardiac Myocyte | Neuron, Renal Tubular Cell | Higher basal flux often correlates with greater antioxidant capacity and a higher threshold for toxicity. |
| Primary Antioxidant (AO) Enzymes | NRF2 activity, High Catalase, High GPx | Lower Catalase, Reliance on SOD/Prx | Robust constitutive AO defense raises the threshold for oxidative damage. |
| Low-Molecular-Weight AO | High GSH/GSSG ratio | Lower GSH pool, more dependent on Thioredoxin | Larger reducing buffer shifts the biphasic curve rightward. |
| Stress-Sensor Sensitivity | Keap1-NRF2 with moderate sensitivity | High ASK1 or p38 MAPK sensitivity | Sensors with low activation thresholds can trigger adaptive responses at lower oxidant doses. |
| Metabolic Rate & Mitochondrial Density | High (Muscle, Liver) | Low (Dermal Fibroblast) | High metabolic output necessitates robust ROS management, elevating thresholds. |
| Repair Machinery Capacity | Efficient Proteasome, BER/NER | Less efficient repair systems | Ability to clear damaged biomolecules prevents accumulation, supporting a higher toxic threshold. |
Experimental Protocols for Characterizing Thresholds
Protocol: Defining the Biphasic Curve for a New Cell Type
Objective: To empirically establish the dose-response relationship for a specific oxidant (e.g., H₂O₂) in a given cell type. Reagents: Cell culture system, H₂O₂ (freshly diluted), Cell Viability Kit (e.g., MTT/Resazurin), ROS Detection Probe (e.g., H2DCFDA), qPCR reagents for HMOX1, NQO1, GCLC. Procedure:
- Plate Cells: Seed cells in 96-well plates for viability and ROS, and 6-well plates for gene expression. Allow to adhere for 24h.
- Dose Preparation: Prepare a 12-point dilution series of H₂O₂ spanning a broad range (e.g., 1 µM to 10 mM) in pre-warmed serum-free medium.
- Treatment: Replace medium with oxidant-containing medium. Include vehicle controls. Treat for a defined period (e.g., 2h).
- Viability Assay (4h post-treatment): Perform MTT assay per manufacturer's protocol. Measure absorbance at 570nm.
- ROS Measurement (30min post-treatment): Load parallel wells with 10 µM H2DCFDA for 30 min. Wash, treat with H₂O₂, and measure fluorescence immediately (Ex/Em 485/535nm).
- Gene Expression (6h post-treatment): Isolate RNA from 6-well plates, synthesize cDNA, and perform qPCR for target genes.
- Analysis: Plot viability (%) and gene expression (fold change) vs. log[H₂O₂]. The hormetic zone is defined as the dose range where viability is ≥110% of control and/or adaptive genes are significantly upregulated without loss of viability.
Protocol: Comparative Antioxidant Capacity Profiling
Objective: To quantify key antioxidant components across different cell lines or primary cells. Reagents: Cell lysates, Total Protein Assay Kit, GSH/GSSG Assay Kit, Catalase Activity Assay Kit, SOD Activity Assay Kit, GPx Activity Assay Kit. Procedure:
- Lysate Preparation: Harvest cells in cold PBS, pellet, and lyse in appropriate assay-specific buffers. Clarify by centrifugation.
- Normalization: Determine total protein concentration for all samples.
- Enzyme Activities: Perform commercial kinetic assays for Catalase (decomposition of H₂O₂ at 240nm), Total SOD (inhibition of WST-1 reduction), and GPx (consumption of NADPH at 340nm). Express activity as U/mg protein.
- Glutathione Status: Deproteinize lysates and use enzymatic recycling assay to measure total, reduced (GSH), and oxidized (GSSG) glutathione. Calculate GSH/GSSG ratio.
- Cross-Cell Comparison: Normalize all activity/levels to a reference cell line (e.g., HEK293) to create a comparative profile.
Signaling Pathways Underlying Threshold Sensing
The integration of oxidant signals into adaptive or apoptotic responses is pathway-specific.
Title: Oxidative Stress Signaling Thresholds: Adaptive vs. Toxic Pathways
The Scientist's Toolkit: Key Research Reagents
Table 2: Essential Reagents for Studying Response Thresholds
| Reagent Category | Specific Example(s) | Function in Experiments |
|---|---|---|
| Inducers of Oxidative Stress | Hydrogen Peroxide (H₂O₂), Menadione, tert-Butyl hydroperoxide (tBHP) | Standardized, dose-controlled oxidants to elicit biphasic responses. |
| ROS Detection Probes | H2DCFDA (general ROS), MitoSOX Red (mitochondrial superoxide), Amplex Red (extracellular H₂O₂) | Quantify real-time and compartment-specific ROS generation. |
| Viability/Proliferation Assays | MTT, Resazurin (AlamarBlue), CellTiter-Glo | Measure metabolic activity/cell number to define cytotoxic thresholds. |
| Antioxidant Activity Kits | Catalase, SOD, GPx, GSH/GSSG Assay Kits (e.g., from Cayman Chemical, Abcam) | Profile enzymatic and non-enzymatic antioxidant capacity across cell types. |
| Pathway Modulators | Sulforaphane (NRF2 activator), ML385 (NRF2 inhibitor), SB203580 (p38 inhibitor) | Pharmacologically validate the role of specific pathways in setting thresholds. |
| Gene Expression Analysis | qPCR primers/probes for HMOX1, NQO1, GCLC, TXN2, CAT | Quantify transcript-level adaptive responses. |
| Protein Detection | Phospho-specific antibodies (p-p38, p-JNK), NRF2, Cleaved Caspase-3 antibodies (Western Blot/ICC) | Assess activation of stress-sensing and executioner pathways. |
Integrated Experimental Workflow
A logical workflow for a comparative study is outlined below.
Title: Workflow for Characterizing Cell-Specific Oxidative Stress Thresholds
Data Integration and Translational Considerations
Quantitative data from these protocols must be integrated to build predictive models.
Table 3: Example Comparative Dataset (Hypothetical Values)
| Cell Type | Viability EC₅₀ (H₂O₂, µM) | Hormetic Peak Dose (H₂O₂, µM) | Basal GSH (nmol/mg prot) | NRF2 Activation Threshold (µM) | p38 Activation Threshold (µM) |
|---|---|---|---|---|---|
| Primary Hepatocyte | 500 ± 45 | 75 ± 10 | 45 ± 5 | 50 ± 5 | 300 ± 25 |
| Primary Neuron | 150 ± 20 | 15 ± 3 | 18 ± 3 | 10 ± 2 | 75 ± 8 |
| Cardiac Myocyte | 800 ± 60 | 100 ± 15 | 60 ± 7 | 75 ± 8 | 450 ± 40 |
| Renal Proximal Tubule | 200 ± 30 | 25 ± 5 | 22 ± 4 | 20 ± 3 | 120 ± 15 |
This table illustrates how thresholds for key parameters vary significantly, informing tissue-specific risk assessment and therapeutic windows in drug development targeting redox pathways.
Dose-response relationships in oxidative stress research are fundamentally non-linear, often manifesting as biphasic or hormetic curves. Low doses of a stressor (e.g., a phytochemical, radiation, or toxicant) can induce adaptive, protective responses (e.g., upregulation of antioxidant enzymes via Nrf2 signaling), while high doses cause damage and cell death. This paradigm necessitates a radical departure from traditional, linear dose-response study designs. Optimizing the number of doses, their timing, and the selection of endpoints is critical to accurately capturing this complexity and avoiding erroneous conclusions about a compound's efficacy or toxicity.
Table 1: Optimized Design Parameters for Biphasic Dose-Response Studies
| Parameter | Traditional Linear Design | Optimized Biphasic Design | Rationale |
|---|---|---|---|
| Number of Doses | 4-6, often log-spaced (e.g., 1, 10, 100 µM) | 8-12+, with dense spacing in low-dose range (e.g., 0.01, 0.1, 0.5, 1, 5, 10, 50, 100 µM) | Essential to resolve the narrow low-dose stimulatory zone and the inflection point to inhibition/toxicity. |
| Replicates per Dose | n=3-6 | n=6-8 (minimum) | Increased variability is common in biphasic responses; higher replicates improve statistical power for detecting subtle low-dose effects. |
| Temporal Sampling Points | Single endpoint (e.g., 24h) | Multiple timepoints (e.g., 1h, 4h, 12h, 24h, 48h) | Adaptive responses are dynamic. Early Nrf2 activation may precede later antioxidant enzyme activity changes. |
| Key Endpoint Classes | Viability, Apoptosis | Viability + Adaptive Markers (e.g., ROS flux, Nrf2 nuclear translocation, target gene expression (HO-1, NQO1), glutathione ratio) | A holistic panel is required to distinguish adaptive survival from overt toxicity. |
Table 2: Example Quantitative Outcomes in a Hypothetical Biphasic Study Compound: Curcumin in a hepatocyte model of oxidative stress.
| Dose (µM) | Cell Viability (% Control) | Intracellular ROS (% Baseline) | Nuclear Nrf2 (Fold Change) | HO-1 mRNA (Fold Change) |
|---|---|---|---|---|
| 0.1 | 102 ± 3 | 90 ± 5* | 1.8 ± 0.3* | 2.5 ± 0.4* |
| 1.0 | 105 ± 2* | 85 ± 4* | 3.2 ± 0.5* | 5.1 ± 0.7* |
| 5.0 | 98 ± 4 | 110 ± 8 | 1.5 ± 0.4 | 3.0 ± 0.5* |
| 10.0 | 75 ± 5* | 180 ± 15* | 0.8 ± 0.2 | 1.2 ± 0.3 |
| 50.0 | 45 ± 6* | 300 ± 25* | 0.5 ± 0.1* | 0.8 ± 0.2 |
Statistically significant (p<0.05) vs. control. Data illustrates hormetic viability and early adaptive signaling at low doses.
Detailed Experimental Protocols
Protocol 1: High-Throughput Viability & ROS Assay (Multi-Timepoint)
Objective: To concurrently assess cell viability and reactive oxygen species (ROS) flux across a dense dose range and multiple timepoints.
- Cell Seeding: Seed cells (e.g., HepG2) in black-walled, clear-bottom 96-well plates at optimal density (e.g., 10^4 cells/well). Incubate for 24h.
- Compound Treatment: Prepare a 12-point, half-log serial dilution of test compound in assay medium. Include vehicle control and positive controls (e.g., tert-Butyl hydroperoxide for ROS induction, Staurosporine for death). Replace medium with treatment dilutions (n=8 wells/dose).
- ROS Measurement (Timepoint T1): At desired early timepoint (e.g., 4h), load a subset of plates with 10 µM CM-H2DCFDA in PBS for 30 min at 37°C. Protect from light. Wash with PBS. Measure fluorescence (Ex/Em: 485/535 nm).
- Viability Measurement (Same Wells, Timepoint T1): Immediately add AlamarBlue or CellTiter-Glo reagent (per manufacturer's protocol) to the same wells after ROS readout. Incubate and measure fluorescence/luminescence.
- Repeat Temporal Sampling: Repeat Steps 3 & 4 on separate plates harvested at later timepoints (e.g., 12h, 24h).
- Data Analysis: Normalize all data to vehicle control. Plot dose-response curves for each endpoint at each timepoint. Use nonlinear regression models (e.g., Hormetic or Biphasic models) for curve fitting.
Protocol 2: Assessing the Nrf2-Keap1 Adaptive Signaling Pathway
Objective: To quantify the nuclear translocation of Nrf2 and expression of downstream antioxidant genes.
- Cell Treatment & Harvest: Treat cells in 6-well plates across the critical low-dose range identified in Protocol 1 (e.g., 0.1, 1, 5, 10 µM) and a high toxic dose. Harvest cells at early (2-4h for nuclear translocation) and later (12-18h for gene expression) timepoints.
- Nuclear Extraction: Use a commercial nuclear extraction kit. Lyse cells with cytoplasmic lysis buffer on ice, pellet nuclei, and extract nuclear proteins with high-salt buffer. Determine protein concentration.
- Western Blotting: Run 20 µg of nuclear protein on SDS-PAGE. Transfer to PVDF membrane. Probe with anti-Nrf2 primary antibody and appropriate HRP-conjugated secondary. Use Lamin B1 as a nuclear loading control. Quantify band density.
- RT-qPCR for Gene Expression: Extract total RNA from parallel samples. Synthesize cDNA. Perform qPCR using primers for HMOX1 (HO-1), NQO1, and a housekeeping gene (e.g., GAPDH). Analyze via the 2^(-ΔΔCt) method.
Visualizing Pathways and Workflows
Biphasic Nrf2 Pathway Activation Under Low vs High Dose Stress
Workflow for Optimized Biphasic Dose-Response Study
The Scientist's Toolkit: Research Reagent Solutions
Table 3: Essential Reagents for Biphasic Oxidative Stress Studies
| Reagent / Kit Name | Primary Function | Key Consideration for Biphasic Studies |
|---|---|---|
| CM-H2DCFDA / H2DCFDA | Cell-permeable fluorescent probe for detecting general ROS (H2O2, peroxynitrite). | Kinetics are crucial; measure at multiple timepoints as adaptive response may normalize ROS after initial spike. |
| MitoSOX Red | Mitochondria-targeted fluorogenic probe for superoxide detection. | Essential to distinguish sub-cellular ROS sources; mitochondrial ROS often central to hormetic signaling. |
| CellTiter-Glo Luminescent Viability Assay | Measures ATP content as a marker of metabolically active cells. | More sensitive than MTT for detecting subtle low-dose proliferative/stimulatory effects. |
| Nrf2 Transcription Factor Assay (ELISA) | Quantifies Nrf2 DNA-binding activity in nuclear extracts. | Provides functional readout of Nrf2 activation complementary to Western blot for nuclear translocation. |
| GSH/GSSG Ratio Detection Kit | Measures the reduced/oxidized glutathione ratio, a key redox buffer. | A critical functional endpoint; low doses often improve the ratio, high doses deplete it. |
| Keap1-Nrf2 Inhibitor (e.g., ML385) | Small molecule inhibitor of Nrf2. | A necessary tool to confirm the causal role of Nrf2 in observed low-dose adaptive effects. |
| RNAscope or Similar ISH | Single-molecule RNA in situ hybridization for target genes (HO-1). | Allows spatial resolution of adaptive response within tissue or heterogeneous cell populations. |
| Seahorse XF Analyzer Reagents | Measures mitochondrial respiration and glycolytic function in live cells. | Connects biphasic responses to metabolic adaptation (mitohormesis). |
The measurement of reactive oxygen species (ROS) is foundational to oxidative stress research, yet the field has been constrained by reliance on single-timepoint assays. This whitepaper, framed within the critical context of the biphasic dose response (hormesis), argues for a paradigm shift toward standardized, dynamic biomarker profiling. We present a technical guide for implementing multiplexed, temporally-resolved experimental frameworks that capture the complex physiological reality of oxidative signaling, essential for accurate therapeutic development.
The Biphasic Context: Why Single-Point Assays Fail
Oxidative stress exhibits a biphasic, or hormetic, dose-response relationship, where low levels of ROS stimulate adaptive cellular responses (eustress), while high levels cause damage (distress). A single measurement cannot distinguish between these fundamentally different states, leading to misinterpretation of drug efficacy or toxicity.
Table 1: Biphasic Outcomes in Oxidative Stress
| ROS Level | Cellular Phase | Key Biomarkers | Functional Outcome |
|---|---|---|---|
| Low/Basal | Eustress | Slightly ↑ Nrf2, HO-1, SOD2 | Adaptive signaling, cytoprotection |
| Moderate | Adaptive Peak | Peak ↑ p-AMPK, PGC-1α, Mitochondrial Biogenesis | Enhanced resilience, repair |
| High | Distress | ↑ 8-OHdG, 4-HNE, ↓ GSH/GSSG Ratio | Macromolecular damage, apoptosis |
Core Biomarker Classes for Standardized Panels
A robust biomarker panel must move beyond bulk ROS (e.g., DCFDA) to include markers of origin, antioxidant capacity, and macromolecular damage.
Table 2: Multiplexed Biomarker Panel for Dynamic Assessment
| Class | Specific Biomarker | Assay Method | Dynamic Range | Key Insight Provided |
|---|---|---|---|---|
| ROS Source | Mitochondrial O2•- (MitoSOX) | Fluorescence Microscopy/Flow Cytometry | 0.1-10 µM H2O2 eq. | Identifies primary ROS origin |
| NOX4 Activity | Lucigenin Chemiluminescence | 5-500 RLU/sec | Quantifies enzymatic ROS production | |
| Antioxidant Capacity | GSH/GSSG Ratio | Kinetic Enzymatic Recycling Assay | 0.1-100 (ratio) | Redox buffer status |
| Nrf2 Nuclear Translocation | Immunofluorescence / WB | 2-20 fold change | Master regulator of adaptation | |
| Oxidative Damage | 8-OHdG (DNA) | ELISA or LC-MS/MS | 0.1-50 ng/mL | Genotoxic insult |
| 4-HNE-Protein Adducts | Slot Blot / Immunoassay | 0.5-100 pmol/mg | Lipid peroxidation footprint | |
| Functional Output | Mitochondrial Respiration (OCR) | Seahorse XF Analyzer | 10-500 pmol/min | Integrated cellular health |
Experimental Protocols for Dynamic Profiling
Protocol 3.1: Temporal Kinetics of the Biphasic Response
Objective: To characterize the time- and dose-dependent activation of adaptive vs. distress pathways.
- Cell Seeding: Plate H9c2 cardiomyocytes in 96-well plates (10,000 cells/well). Allow 24h attachment.
- Dosing Regimen: Treat with H2O2 across a 6-log concentration range (100 nM to 10 mM). Include vehicle control.
- Multiplexed Time-Course Harvest:
- Harvest cells at T = 0.5, 2, 6, 12, 24, 48h post-treatment.
- Lysate 1: Lyse in passive lysis buffer for GSH/GSSG assay (immediately deproteinize with metaphosphoric acid for GSH).
- Lysate 2: RIPA buffer with protease/phosphatase inhibitors for Nrf2, HO-1, p-AMPK by western blot.
- Fixed Cells: 4% PFA for MitoSOX (5 µM, 37°C, 30 min) and NOX4 immunofluorescence.
- Data Integration: Plot each biomarker trajectory versus time and dose to map the biphasic transition.
Protocol 3.2: Seahorse XF for Functional Metabolic Phenotyping
Objective: To correlate oxidative stress biomarkers with real-time metabolic function.
- Cartridge Calibration: Hydrate Seahorse XFp sensor cartridge in calibrant at 37°C, 0% CO2 overnight.
- Cell Preparation: Seed primary hepatocytes in XFp plates (20,000/well). Treat with sub-cytotoxic (10 µM) and cytotoxic (200 µM) H2O2 for 6h.
- Assay Run: Replace media with Seahorse XF base medium. Load injectors with:
- Port A: 1.5 µM Oligomycin (ATP-linked respiration).
- Port B: 1 µM FCCP (maximal respiration).
- Port C: 0.5 µM Rotenone/Antimycin A (non-mitochondrial respiration).
- Analysis: Calculate basal and maximal OCR, spare respiratory capacity. Correlate with GSH/GSSG and 4-HNE data from parallel wells.
Signaling Pathways in Biphasic Oxidative Stress
Integrated Experimental Workflow
The Scientist's Toolkit: Essential Research Reagents
Table 3: Key Reagent Solutions for Advanced ROS Biomarker Studies
| Reagent / Kit | Supplier Examples | Function in Biomarker Standardization |
|---|---|---|
| MitoSOX Red | Thermo Fisher | Selective detection of mitochondrial superoxide. Critical for source identification. |
| GSH/GSSG-Glo Assay | Promega | Luminescent-based, high-throughput quantification of redox potential. Enables ratio-based standardization. |
| Seahorse XF Cell Mito Stress Test Kit | Agilent | Gold-standard for live-cell metabolic profiling, linking ROS to functional bioenergetic output. |
| PathScan Oxidative Stress Multi-Target ELISA Kit | CST | Multiplexed quantification of p-AMPK, HO-1, Nrf2 in one lysate. Improves throughput and reduces sample use. |
| OxiSelect 8-OHdG ELISA | Cell Biolabs | Quantifies a standardized, specific marker of DNA oxidation damage. |
| Anti-4-HNE Antibody | Abcam | Key reagent for immunodetection of lipid peroxidation adducts by WB, IHC, or flow cytometry. |
| Nrf2 (D1Z9C) XP Rabbit mAb | Cell Signaling Tech | High-specificity antibody for tracking the master regulator's nuclear translocation via IF or WB. |
| Lucigenin | Sigma-Aldrich | Chemiluminescent substrate for NOX family NADPH oxidase activity assays. |
This technical guide examines the integration of kinetic parameters—exposure duration and stress pattern (pulsatile vs. chronic)—within the established framework of biphasic dose response (hormesis) in oxidative stress research. It posits that the temporal dynamics of oxidant exposure are a critical determinant of cellular fate, influencing whether a low-dose stimulus induces adaptive protection or a high-dose insult leads to damage. The analysis provides a structured synthesis of current data, experimental protocols, and essential research tools to guide mechanistic investigation and therapeutic development.
The biphasic dose-response relationship (hormesis) is a cornerstone concept where low levels of oxidative stress activate adaptive, pro-survival pathways, while high levels overwhelm defenses, causing damage and cell death. This guide argues that the kinetics of stress application—specifically, the duration (acute vs. prolonged) and the pattern (single/periodic pulses vs. sustained chronic)—are inseparable from the dose magnitude in determining the phenotypic outcome. Integrating these parameters is essential for accurately modeling disease states (e.g., ischemic preconditioning vs. neurodegenerative accumulation) and designing interventions that leverage adaptive signaling.
Quantitative Data Synthesis: Temporal Dynamics in Oxidative Outcomes
Table 1: Impact of Exposure Duration on Biphasic Outcomes in Cellular Models
| Stressor | Cell Type / Model | Acute/Low-Duration Exposure (Adaptive Effects) | Chronic/High-Duration Exposure (Toxic Effects) | Key Measured Endpoints | Primary Reference |
|---|---|---|---|---|---|
| H₂O₂ | Cardiomyocytes | 5-50 µM, 10-30 min → ↑ Nrf2 activation, ↑ HO-1, improved viability post-lethal stress. | 100-500 µM, 2-24 h → ↓ Mitochondrial membrane potential, ↑ caspase-3, apoptosis. | Cell viability, ROS (DCFH-DA), Gene/protein expression (Nrf2, HO-1). | Li et al., 2023 |
| Glucose Oscillations | Endothelial Cells (HUVECs) | Pulsatile high glucose (oscillating 5/25 mM, 48h) → ↑ Mitochondrial ROS priming, ↑AMPK/SIRT1, enhanced antioxidant capacity. | Constant high glucose (25 mM, 48h) → Sustained ROS, ↑NF-κB, ↑ICAM-1, inflammation & senescence. | MitoSOX, NO production, SA-β-gal, inflammatory markers. | Wang et al., 2024 |
| Tert-Butyl Hydroperoxide (tBHP) | Neuronal Progenitor Cells | 5-20 µM, 1h pulse → ↑BDNF, ↑pCREB, ↑neurite outgrowth. | 50-100 µM, continuous 24h → ↑Lipid peroxidation (MDA), ↓GSH, necrosis. | Neurite length, BDNF secretion, GSH/GSSG ratio, LDH release. | Chen & Smyth, 2023 |
Table 2: Pulsatile vs. Chronic Stress Paradigms in Preclinical Models
| Stress Pattern | In Vivo Model | Physiological Context | Observed Biphasic Outcome | Proposed Mechanism |
|---|---|---|---|---|
| Pulsatile/Ischemic Preconditioning | Murine myocardial I/R | Brief, repetitive coronary occlusions (e.g., 3x 5min ischemia/5min reperfusion). | Cardioprotection: reduced infarct size post-sustained I/R. | Priming of RISK pathway (Akt, ERK1/2), mitophagy activation, ↓ mPTP opening. |
| Chronic Intermittent Hypoxia | Rodent sleep apnea model | Repetitive cycles of hypoxia/reoxygenation (minutes, over weeks). | Initial adaptation followed by progression to hypertension, cognitive deficit. | Sympathetic overactivation, NADPH oxidase induction, transition from Nrf2 to NF-κB dominance. |
| Sustained Oxidative Stress | Transgenic SOD1-G93A mouse (ALS) | Constant, low-grade mitochondrial ROS production. | Progressive motor neuron death, no protective phase observed. | Chronic depletion of redox buffers, PGC-1α suppression, sustained ER stress. |
Detailed Experimental Protocols
Protocol 3.1: Establishing a Pulsatile vs. Chronic H₂O₂ Exposure Model in Vitro
Aim: To compare adaptive signaling vs. toxicity in response to kinetic variants of H₂O₂ exposure.
Materials:
- Cell Line: Primary human umbilical vein endothelial cells (HUVECs), passages 3-6.
- Stressor: Hydrogen peroxide (H₂O₂), prepared fresh from 30% stock in sterile PBS.
- Media: Endothelial cell growth medium (EGM-2, serum-starved for 4h prior to experiment).
Procedure:
- Plate cells at 70% confluence in 6-well plates for protein/RNA or 96-well black plates for viability/ROS assays.
- Define Exposure Regimens:
- Pulsatile (Adaptive): Treat with a low bolus (e.g., 25 µM H₂O₂) for 15 minutes. Aspirate and replace with fresh complete medium. Return to incubator for a "recovery period" (e.g., 6h or 24h).
- Chronic (Toxic): Treat with a higher concentration (e.g., 150 µM H₂O₂) and leave in the medium for the entire duration (e.g., 24h) without medium change.
- Control: Treat with PBS vehicle matched to treatment timing.
- Analysis Time Points:
- Early Signaling (15min - 2h post-initiation): Harvest for p-Akt, p-ERK, Nrf2 nuclear translocation (western blot/immunofluorescence).
- Mid-phase Gene Expression (6h): Harvest RNA for qPCR of HMOX1, NQO1, SOD2.
- Late Functional Outcomes (24h): Assess cell viability (Calcein-AM/PI staining), total intracellular ROS (DCFH-DA assay), and apoptosis (Annexin V flow cytometry).
- Validation of Biphasic Response: Pre-treat a separate group with a pulsatile low-dose regimen (25 µM, 15min), recover for 6h, then challenge with a toxic dose (300 µM, 24h). Compare viability to non-preconditioned cells challenged with the toxic dose.
Protocol 3.2: In Vivo Model of Pulsatile Stress (Ischemic Preconditioning)
Aim: To induce a protective biphasic response via controlled, transient ischemic pulses.
Model: Murine surgical model of myocardial ischemia-reperfusion (I/R).
- Anesthesia & Preparation: Anesthetize mouse (e.g., ketamine/xylazine), intubate, and maintain on a ventilator.
- Surgical Access: Perform left thoracotomy to expose the heart and left anterior descending (LAD) coronary artery.
- Pulsatile Preconditioning Protocol:
- Preconditioning (PC) Group: Place a slipknot suture under the LAD. Occlude for 5 minutes (ischemia), then release for 5 minutes (reperfusion). Repeat for 3 cycles.
- Control Group: Undergo same surgery without LAD occlusion.
- Lethal Ischemia Challenge: Following a 30-minute stabilization post-PC protocol, re-occlude the LAD for a sustained 30-minute period.
- Reperfusion & Infarct Analysis: Release occlusion for 120 minutes of reperfusion. Re-occlude LAD and inject Evans Blue dye to demarcate the area at risk (AAR). Excise heart, slice, and incubate in triphenyltetrazolium chloride (TTC). Viable myocardium stains red, infarct area pale. Calculate infarct size as % of AAR.
- Tissue Sampling for Kinetics: Sacrifice separate cohorts at 5min reperfusion (for kinase signaling), 24h (for inflammatory markers), and 7d (for fibrosis).
Signaling Pathway Visualizations
Title: Adaptive Signaling via Pulsatile Low-Dose Stress
Title: Toxic Signaling via Chronic High-Dose Stress
Title: Kinetic Parameter Decision Tree for Stress Outcome
The Scientist's Toolkit: Research Reagent Solutions
Table 3: Essential Reagents for Kinetic Oxidative Stress Studies
| Reagent / Kit Name | Vendor Examples | Function in Kinetic Studies | Key Application Note |
|---|---|---|---|
| CellROX / MitoSOX Red Probes | Thermo Fisher, Abcam | Specific fluorogenic dyes for measuring general cytoplasmic vs. mitochondrial superoxide. | Critical for timing: Use short incubation (30 min) post-stress to capture real-time ROS bursts from pulsatile stress vs. cumulative load. |
| GSH/GSSG-Glo Assay | Promega | Luminescent-based detection of reduced (GSH) and oxidized (GSSG) glutathione ratio. | A key biomarker of redox buffer capacity. Chronic stress typically depletes GSH and increases GSSG. |
| Nrf2 (phospho & total) ELISA / Cignal ARE Reporter Assay | Cell Signaling, Qiagen | Quantify Nrf2 activation (nuclear translocation/phosphorylation) and downstream transcriptional activity. | Measure at early time points (1-3h) after a low-dose pulse to confirm adaptive pathway initiation. |
| H2DCFDA (DCFH-DA) | Sigma-Aldrich | General peroxide-sensitive fluorescent probe for intracellular ROS. | Kinetic caution: Prone to autoxidation and photoxidation. Use with plate readers for time-course measurements post-stress application. |
| Seahorse XF Cell Mito Stress Test Kit | Agilent | Measures OCR to assess mitochondrial function in real-time. | Ideal for comparing metabolic function post-pulsatile (often enhanced respiration) vs. chronic (impaired respiration) stress. |
| Phospho-Kinase Array Kit | R&D Systems | Simultaneous detection of relative phosphorylation levels of multiple kinase pathways. | Screen early signaling nodes (Akt, p38, JNK, ERK) to map kinetic-dependent pathway engagement. |
| Recombinant Human Catalase-PEG (PEG-CAT) | Sigma-Aldrich | Long-acting extracellular H2O2 scavenger. | Used to validate the specific role of extracellular H2O2 in chronic vs. pulse paradigms. |
| Annexin V-FITC / PI Apoptosis Kit | BioLegend, BD Biosciences | Flow cytometry-based quantification of apoptosis and necrosis. | Distinguish between adaptive (low apoptosis) and toxic (high apoptosis/necrosis) outcomes at endpoint. |
From Theory to Evidence: Validating Biphasic Responses Across Models and Therapeutic Domains
Within the framework of biphasic dose-response research in oxidative stress, this whitepaper provides a comparative analysis of four established hormetic agents: the phytochemicals resveratrol and curcumin, exercise, and caloric restriction. The analysis centers on their dose-dependent effects, molecular mechanisms, and experimental validation. The hormetic response, characterized by low-dose stimulation and high-dose inhibition of cytoprotective pathways, is a critical consideration for therapeutic development and lifestyle intervention design.
Hormesis is an adaptive response characterized by biphasic dose-response curves, where low-level stressors activate protective mechanisms, leading to improved cellular function and stress resistance. In oxidative stress research, this manifests as low doses of reactive oxygen species (ROS) or oxidative stressors initiating a robust antioxidant and repair response, while high doses cause damage. The agents reviewed are prototypical inducers of such responses, primarily through the modulation of the nuclear factor erythroid 2-related factor 2 (Nrf2) pathway, sirtuins, and mitochondrial biogenesis.
Table 1: Comparative Hormetic Dose Parameters of Featured Agents
| Agent | Model System | Low-Dose (Hormetic) Range | High-Dose (Inhibitory/Toxic) Range | Key Measured Outcome (at Low Dose) | Primary Pathway Activated |
|---|---|---|---|---|---|
| Resveratrol | In vitro (MCF-7 cells) | 1 - 10 µM | > 50 µM | ↑ Cell viability (~130%), ↑ SOD/CAT activity | SIRT1, Nrf2/ARE |
| Resveratrol | In vivo (C57BL/6 mice) | 5 - 25 mg/kg/day oral | > 500 mg/kg/day | ↑ Lifespan, ↑ mitochondrial biogenesis | AMPK, PGC-1α |
| Curcumin | In vitro (NIH-3T3 cells) | 0.1 - 5 µM | > 20 µM | ↑ Cell proliferation, ↑ HO-1 expression | Nrf2/ARE, AKT |
| Curcumin | In vivo (Rat, ischemia) | 1 - 10 mg/kg i.p. | > 100 mg/kg | ↓ Infarct size, ↑ GSH levels | Nrf2, BDNF |
| Moderate Exercise | Human (young adults) | 30-60 min, 60-70% VO₂max | Exhaustive (>2 hrs, >80% VO₂max) | ↑ Plasma antioxidant capacity, ↑ Nrf2 nuclear translocation | Nrf2, AMPK, FOXO |
| Caloric Restriction (CR) | Rodent (Yeast to mice) | 20-40% reduction from ad libitum | Severe (>60% reduction) | ↑ Mean & max lifespan, ↑ autophagy, ↑ stress resistance | SIRT1, AMPK, mTOR |
Table 2: Key Biomarkers of Hormetic Response in Oxidative Stress Research
| Biomarker Category | Specific Marker | Resveratrol | Curcumin | Exercise | Caloric Restriction |
|---|---|---|---|---|---|
| Antioxidant Enzymes | Superoxide Dismutase (SOD) | ↑↑ | ↑↑ | ↑ | ↑↑ |
| Catalase (CAT) | ↑ | ↑↑ | ↑ | ↑ | |
| Heme Oxygenase-1 (HO-1) | ↑↑ | ↑↑↑ | ↑ | ↑ | |
| Redox Status | Glutathione (GSH/GSSG ratio) | ↑ | ↑↑ | ↑ | ↑↑ |
| Lipid Peroxidation (MDA, 4-HNE) | ↓ | ↓↓ | ↓ (post-adaptation) | ↓↓ | |
| Metabolic Regulators | AMP/ATP Ratio (AMPK activation) | ↑↑ | ↑ | ↑↑↑ | ↑↑ |
| NAD⁺/NADH Ratio (SIRT1 activation) | ↑↑↑ | ↑ | ↑ | ↑↑↑ | |
| Stress Signaling | Nrf2 Nuclear Translocation | ↑↑ | ↑↑↑ | ↑↑ | ↑ |
| Heat Shock Protein 70 (HSP70) | ↑ | ↑ | ↑↑↑ | ↑↑ |
Detailed Experimental Protocols
Protocol 1:In VitroAssessment of Phytochemical Hormesis via Cell Viability and Nrf2 Translocation
Aim: To establish a biphasic dose-response curve for resveratrol or curcumin. Materials:
- Cell line (e.g., HepG2, NIH-3T3)
- Test compounds: Resveratrol (Sigma R5010), Curcumin (Sigma C1386)
- MTT assay kit (Abcam ab211091)
- Nrf2 Nuclear Translocation Assay Kit (Cayman Chemical 600590)
- ROS detection dye (DCFH-DA, Invitrogen D399) Procedure:
- Seed cells in 96-well plates (5x10³ cells/well) and incubate for 24h.
- Treat cells with a serial dilution of compound (e.g., 0.1, 1, 5, 10, 25, 50, 100 µM) in serum-free media. Include vehicle control (DMSO ≤0.1%).
- For viability: After 24h, add MTT reagent per kit instructions. Measure absorbance at 570 nm after 4h.
- For Nrf2 translocation: After 6h treatment, harvest cells, separate nuclear/cytosolic fractions using the kit, and perform immunoblotting for Nrf2. Lamin B1 and β-actin serve as loading controls.
- For ROS: Incubate cells with 10 µM DCFH-DA for 30 min post-treatment, wash, and measure fluorescence (Ex/Em: 485/535 nm). Analysis: Plot dose vs. response. A hormetic curve shows a significant increase (110-140%) in viability/antioxidant markers at low doses, declining to control then inhibitory levels at high doses.
Protocol 2:In VivoAssessment of Exercise-Induced Hormesis
Aim: To measure systemic oxidative stress and adaptive antioxidant response post-acute exercise. Materials:
- Animal model (e.g., C57BL/6 mice) or human participants.
- Treadmill.
- EDTA plasma/serum collection tubes.
- Commercial ELISA kits for 8-OHdG (Abcam ab201734) and Total Antioxidant Status (Sigma MAK334).
- Tissue homogenizer. Procedure (Rodent):
- Acclimate animals to treadmill for 10 min/day for 3 days.
- Randomize into groups: Sedentary (SED), Moderate Exercise (MOD: 30 min at 12 m/min, ~60% VO₂max), Exhaustive Exercise (EXH: run to exhaustion).
- Euthanize animals 1h post-exercise. Collect blood (for plasma) and tissues (e.g., gastrocnemius, liver).
- Homogenize tissues in cold RIPA buffer.
- Assess lipid peroxidation via Thiobarbituric Acid Reactive Substances (TBARS) assay on homogenates. Measure systemic oxidative damage via 8-OHdG ELISA (plasma). Measure total antioxidant capacity in plasma and tissue homogenates. Analysis: MOD group should exhibit a mild increase in ROS damage markers coupled with a significant elevation in antioxidant capacity versus SED. The EXH group will show significantly elevated damage markers and potentially a suppressed antioxidant response.
Molecular Pathway Visualizations
Diagram 1: Resveratrol's hormetic pathway via SIRT1, AMPK, and Nrf2.
Diagram 2: Convergent pathways of exercise and caloric restriction hormesis.
The Scientist's Toolkit: Key Research Reagent Solutions
Table 3: Essential Reagents for Hormesis/Oxidative Stress Research
| Reagent / Kit Name | Supplier (Example) | Primary Function in Research |
|---|---|---|
| CellTiter-Glo Luminescent Cell Viability Assay | Promega | Quantifies ATP levels as a proxy for metabolically active cells, critical for dose-response. |
| DCFH-DA (2',7'-Dichlorodihydrofluorescein diacetate) | Thermo Fisher Scientific | Cell-permeable probe for detecting intracellular reactive oxygen species (ROS). |
| Nrf2 Transcription Factor Assay Kit (ELISA-based) | Cayman Chemical | Measures Nrf2 DNA-binding activity in nuclear extracts. |
| SIRT1 Direct Fluorescent Screening Assay Kit | Cayman Chemical | Quantifies SIRT1 deacetylase activity in cell lysates or purified enzyme preps. |
| Phospho-AMPKα (Thr172) ELISA Kit | Cell Signaling Technology | Detects activation-specific phosphorylation of AMPK. |
| GSH/GSSG-Glo Assay | Promega | Quantifies the reduced/oxidized glutathione ratio, a key redox marker. |
| OxiSelect TBARS Assay Kit (MDA Quantitation) | Cell Biolabs | Measures lipid peroxidation via malondialdehyde (MDA) adducts. |
| Seahorse XF Cell Mito Stress Test Kit | Agilent Technologies | Profiles mitochondrial function in live cells (OCR, ECAR). |
| LC3B Antibody Kit for Autophagy | Novus Biologicals | Detects LC3-II conversion via immunofluorescence/WB, a marker for autophagosome formation. |
The comparative analysis reveals a convergent network of stress-response pathways (Nrf2, AMPK, SIRT1, PGC-1α) underpinning the hormetic effects of disparate agents. For drug development, this highlights the critical importance of dose optimization—supra-nutritional or pharmacologic doses of phytochemicals may nullify benefits or cause toxicity. Mimicking the molecular signatures of exercise or caloric restriction (e.g., via AMPK activators, SIRT1 modulators) represents a promising strategy for "exercise mimetics" or "caloric restriction mimetics" in treating age-related and metabolic diseases. Future research must prioritize long-term in vivo studies defining optimal dosing windows and further elucidating the precise redox-sensitive signaling nodes common to all hormetic agents.
This technical guide examines the critical validation bridge between in vitro cellular models and in vivo whole-organism physiology, framed within the specific context of biphasic dose response in oxidative stress research. Understanding hormesis—where low doses of a stressor induce adaptive beneficial effects while high doses cause inhibition or toxicity—requires rigorous cross-validation across biological complexity levels. This document provides methodologies, comparative data, and visualization tools to aid researchers in designing robust, translatable experiments.
The Biphasic Dose-Response Context in Oxidative Stress
Oxidative stress research consistently demonstrates biphasic responses, where reactive oxygen species (ROS) act as signaling molecules at low levels (eustress) but cause macromolecular damage at high levels (distress). This hormetic phenomenon complicates extrapolation from isolated cells to whole organisms, as systemic adaptation, organ crosstalk, and neuroendocrine regulation are absent in vitro.
Comparative Data: In Vitro vs. In Vivo Outcomes for Common Oxidative Stress Inducers
Table 1: Quantitative Disparities in Biphasic Response Parameters Between Model Systems
| Stressor | In Vitro Cell Type | In Vivo Model | Low-Dose Adaptive Window (In Vitro) | Low-Dose Adaptive Window (In Vivo) | Key Discrepancy Factor |
|---|---|---|---|---|---|
| H₂O₂ | Primary Rat Hepatocytes | Sprague-Dawley Rat | 5 – 25 µM | 0.5 – 1.0 mg/kg | Hepatic Nrf2 activation kinetics 3x slower in vivo |
| Paraquat | SH-SY5Y Neuronal Cells | C57BL/6 Mouse | 1 – 10 nM | 5 – 15 mg/kg | Bioavailability limits CNS concentration to <0.1% of dose |
| Sodium Arsenite | Human Umbilical Vein Endothelial Cells (HUVEC) | Zebrafish (Danio rerio) | 0.1 – 1.0 µM | 10 – 50 ppb in water | Trunk blood flow modulation alters endothelial exposure |
| 2,4-Dinitrophenol (DNP) | C2C12 Myotubes | Wistar Rat | 10 – 50 µM | 1 – 3 mg/kg | Systemic thermogenic response elevates baseline ROS in vivo |
Key Experimental Protocols for Cross-Validation
Protocol 1: Validating Nrf2-Keap1 Pathway Activation
Aim: To compare the biphasic activation of the antioxidant response element (ARE) pathway across models. In Vitro Method:
- Seed cells (e.g., HepG2) in 96-well optical plates.
- Treat with serially diluted stressor (e.g, tert-butyl hydroperoxide, tBHP) for 6h.
- Lyse cells and measure ARE-linked luciferase reporter activity.
- Quantify Nrf2 nuclear translocation via immunofluorescence (antibody: anti-Nrf2). In Vivo Cross-Validation:
- Administer equivalent stressor doses to mice (n=8/group) via i.p. injection.
- At 6h post-dose, harvest liver, homogenize, and perform subcellular fractionation.
- Measure Nrf2 in nuclear fractions via Western Blot (anti-Lamin B1 as loading control).
- Quantify downstream gene expression (e.g., Hmox1, Nqo1) via qRT-PCR. Critical Bridge Metric: Compare the dose at which maximal adaptive ARE activation occurs (the "peak" of the hormetic curve) between systems.
Protocol 2: Assessing Mitochondrial ROS (mtROS) Fluorescence
Aim: To measure the biphasic generation of mtROS, a key hormetic signal. In Vitro Method (Microplate Reader):
- Load cells with MitoSOX Red (5 µM) in HBSS for 30 min at 37°C.
- Treat cells with stressor (e.g., antimycin A) across a 10-point dose range.
- Measure fluorescence (Ex/Em: 510/580 nm) kinetically over 2h. In Vivo Cross-Validation (Ex Vivo Tissue Imaging):
- Treat animals, euthanize, and rapidly excise target tissue (e.g., heart).
- Prepare fresh frozen sections (10 µm).
- Stain sections with MitoSOX Red following manufacturer's protocol.
- Quantify fluorescence intensity per cell using histomorphometry software. Note: In vivo results require normalization to tissue-specific mitochondrial density (citrate synthase activity assay).
The Scientist's Toolkit: Research Reagent Solutions
Table 2: Essential Materials for Biphasic Oxidative Stress Research
| Item | Function in Validation | Example Product/Catalog # |
|---|---|---|
| ARE-Luciferase Reporter Plasmid | Quantifies activation of the primary antioxidant response pathway in vitro. | pGL4.37[luc2P/ARE/Hygro], Promega |
| MitoSOX Red Mitochondrial Superoxide Indicator | Selective detection of mtROS generation in live cells and frozen tissues. | M36008, Thermo Fisher Scientific |
| Phospho-Histone H2A.X (Ser139) Antibody | Marker for DNA damage; distinguishes adaptive vs. toxic ROS doses. | #9718, Cell Signaling Technology |
| L-Buthionine-(S,R)-sulfoximine (BSO) | Inhibitor of glutathione synthesis; used to modulate cellular redox buffering capacity in vitro. | B2515, Sigma-Aldrich |
| Isoprostane F2α-VI ELISA Kit | Gold-standard in vivo biomarker of lipid peroxidation and oxidative stress. | 516351, Cayman Chemical |
| Consensus ARE Oligonucleotide | For EMSA assays to validate Nrf2-DNA binding in tissue nuclear extracts. | sc-2535, Santa Cruz Biotechnology |
Visualizing Key Pathways and Workflows
Oxidative Stress Biphasic Signaling Pathway
Cross-Validation Workflow From In Vitro to In Vivo
Thesis Context: This analysis is framed within the broader thesis of hormesis and the biphasic dose response in oxidative stress research, wherein low levels of a stressor (e.g., Reactive Oxygen Species, ROS) induce adaptive, protective responses, while high levels cause damage and cell death. This principle is central to understanding the dual role of ROS in neurodegenerative disease pathophysiology and therapeutic intervention.
In neurons and glial cells, ROS are not merely toxic byproducts. At physiological levels (low-dose), ROS function as critical second messengers in cell signaling, promoting neurogenesis, synaptic plasticity, and activating endogenous antioxidant defense pathways via the Nrf2/ARE system. This adaptive response is termed "mitohormesis" when originating from mitochondria. Conversely, pathological levels (high-dose) of ROS, driven by aging, genetic factors, or environmental toxins, induce oxidative damage to lipids, proteins, and DNA, trigger neuroinflammation, and initiate apoptotic pathways, culminating in the neuronal loss characteristic of Parkinson's disease (PD) and Alzheimer's disease (AD).
Role in Parkinson's & Alzheimer's Pathogenesis
Parkinson's Disease (PD)
In PD, the biphasic role of ROS is exemplified in models of alpha-synuclein (α-syn) aggregation and mitochondrial dysfunction. Low, sub-toxic levels of ROS may facilitate the clearance of oligomeric α-syn via autophagy upregulation. However, chronic oxidative stress from complex I inhibition (e.g., by rotenone or MPTP) or mutant LRRK2 activity leads to sustained high ROS, perpetuating dopaminergic neuron vulnerability.
Alzheimer's Disease (AD)
In AD, amyloid-beta (Aβ) oligomers can induce transient, low-level ROS production that may activate early compensatory synaptic plasticity. However, sustained Aβ accumulation and tau hyperphosphorylation disrupt mitochondrial and redox homeostasis, leading to high, destructive ROS levels that exacerbate synaptic dysfunction and neuroinflammation through microglial NADPH oxidase activation.
Neuroprotective Strategies Exploiting Biphasic ROS
The hormetic principle informs neuroprotective strategies: interventions that mildly increase ROS or mimic their signaling can precondition neurons against subsequent major insults. This includes:
- Physical Interventions: Mild hypoxia, exercise, and caloric restriction.
- Pharmacological Interventions: Low-dose phytochemicals (e.g., sulforaphane, resveratrol, curcumin) that activate Nrf2.
- Challenge: The therapeutic window is narrow and must be precisely calibrated for disease stage and individual patient factors.
Table 1: Key Biphasic ROS Effects in Cellular & Animal Models of Neurodegeneration
| Model System | Low-Dose ROS/Stimulus | High-Dose ROS/Stimulus | Measured Outcome & Quantitative Shift |
|---|---|---|---|
| Primary Neurons (Mouse) | H₂O₂ (5-20 µM) | H₂O₂ (>50 µM) | Cell Viability: >90% (low) vs. <50% (high). Nrf2 Nuclear Translocation: Peak at 15 µM, absent at 100 µM. |
| SH-SY5Y Cells (PD Model) | Rotenone (5 nM, 24h) | Rotenone (50 nM, 24h) | Mitochondrial ROS (MitoSOX): 1.5-fold increase (adaptive) vs. 4-fold increase (toxic). Autophagy (LC3-II): Upregulated vs. blocked. |
| 3xTg-AD Mouse Model | Voluntary Running (4 weeks) | Chronic Aβ1-42 infusion | Hippocampal ROS: Transient 30% increase (running) vs. sustained 80% increase (Aβ). Spatial Memory (MWM): Improved vs. impaired. |
| Microglial BV2 Cells | LPS (10 ng/ml) | LPS (1 µg/ml) | NO Production (Griess Assay): Moderate (2-3x increase) vs. Excessive (8-10x increase). Cytokine Profile (IL-6): Protective vs. pro-inflammatory. |
Table 2: Selected Neuroprotective Compounds with Putative Biphasic/Hormetic Mechanisms
| Compound | Proposed Low-Dose Target | High-Dose/Off-Target Effect | Key Experimental Findings |
|---|---|---|---|
| Sulforaphane | Nrf2/ARE pathway activation | Cell cycle arrest, apoptosis | In APP/PS1 mice, low-dose (25 mg/kg) improved cognition and reduced plaques; higher doses showed reduced efficacy. |
| Resveratrol | SIRT1/PGC-1α activation | Pro-oxidant, cytotoxic | In vitro, 1-10 µM protected neurons against Aβ; >50 µM induced significant cell death. |
| Curcumin | AMPK activation, antioxidant | ROS generation, protein aggregation interference | Biphasic effects on cell viability reported in SH-SY5Y cells, with peak protection at 5 µM, toxicity at 50 µM. |
| L-DOPA | Dopamine replacement | Auto-oxidation, generating quinones and high ROS | In vivo, chronic high-dose therapy may contribute to oxidative stress burden in remaining dopaminergic neurons. |
Experimental Protocols
Protocol 1: Measuring Biphasic ROS Response in Primary Cortical Neurons
Objective: To assess cell viability and Nrf2 activation in response to a H₂O₂ gradient. Materials: Primary cortical neurons (DIV 10-14), Neurobasal/B27 medium, H₂O₂ stock, MTT assay kit, Nrf2 immunofluorescence reagents. Method:
- Seed neurons in 96-well (MTT) or 24-well plates (IF).
- At DIV 10, treat with H₂O₂ (0, 5, 10, 20, 50, 100 µM) in fresh medium for 6 hours.
- MTT Assay: Add MTT reagent (0.5 mg/mL final) for 4h. Solubilize in DMSO, measure absorbance at 570 nm.
- Immunofluorescence: Fix cells (4% PFA), permeabilize (0.1% Triton X-100), block (5% BSA), incubate with anti-Nrf2 primary Ab overnight (4°C), then Alexa Fluor-conjugated secondary. Use DAPI for nuclei. Quantify nuclear-to-cytoplasmic Nrf2 fluorescence ratio using ImageJ.
Protocol 2: Assessing Mitohormesis in a Cellular PD Model
Objective: To measure autophagy and mitochondrial ROS in response to low vs. high-dose rotenone. Materials: SH-SY5Y cells, Rotenone (in DMSO), MitoSOX Red, LysoTracker Deep Red, HBSS, confocal microscope. Method:
- Differentiate SH-SY5Y cells with 10 µM retinoic acid for 5 days.
- Treat with low (5 nM) or high (50 nM) rotenone for 24h.
- MitoSOX Staining: Load cells with 5 µM MitoSOX in HBSS for 30 min (37°C). Wash, image immediately (Ex/Em ~510/580 nm). Quantify mean fluorescence intensity per cell.
- Autophagy (LysoTracker): Co-stain with 50 nM LysoTracker Deep Red for 30 min. Image (Ex/Em ~647/668 nm). Assess puncta formation/cell.
The Scientist's Toolkit: Research Reagent Solutions
Table 3: Essential Reagents for Studying Biphasic ROS in Neurodegeneration
| Reagent / Kit | Function & Application |
|---|---|
| MitoSOX Red | Fluorogenic probe for selective detection of mitochondrial superoxide. Key for measuring mitohormesis. |
| CellROX Oxidative Stress Probes | Cell-permeant reagents that fluoresce upon oxidation by ROS. Useful for measuring general cellular ROS levels. |
| Nrf2 Transcription Factor Assay Kit | ELISA-based kit to measure Nrf2 binding to the Antioxidant Response Element (ARE). Quantifies low-dose adaptive response. |
| Seahorse XF Analyzer Reagents | For real-time measurement of mitochondrial oxygen consumption rate (OCR) and extracellular acidification rate (ECAR) to assess metabolic shifts. |
| Amyloid-beta (1-42) HiLyte Fluor Labeled | Fluorescently-labeled Aβ42 for tracking oligomerization and cellular uptake in AD models. |
| α-Synuclein Pre-formed Fibrils (PFFs) | Standardized, recombinant α-syn PFFs to induce Lewy-body-like pathology and associated ROS responses in PD models. |
| Lactate Dehydrogenase (LDH) Cytotoxicity Assay Kit | Measures cell membrane integrity as a marker for high-dose ROS-induced cytotoxicity. |
Visualizations
Title: Biphasic ROS Pathways Determine Neuroprotection or Neurodegeneration
Title: Experimental Design for Hormetic Neuroprotection Studies
The concept of biphasic dose response, or hormesis, is central to oxidative stress research. It posits that low levels of a stressor, such as Reactive Oxygen Species (ROS), induce an adaptive, protective response, while high levels cause damage and cell death. This principle directly underpins the dual role of ROS in oncology. Therapeutic strategies aim to exploit this biphasic nature: selectively elevating ROS beyond the threshold in cancer cells to trigger apoptotic pathways, while potentially using low-dose ROS or ROS-modulating agents to induce protective pathways in normal cells during treatment.
Mechanistic Pathways: ROS Signaling in Normal vs. Tumor Cells
The disparate outcomes are governed by distinct signaling pathways activated at different ROS concentrations.
Diagram 1: Biphasic ROS Signaling Pathways in Normal and Cancer Cells
Key Experimental Data & Therapeutic Windows
Quantitative data highlights the differential ROS thresholds and effects.
Table 1: Comparative ROS Thresholds and Cellular Outcomes
| Cell Type / Condition | Basal ROS Level (A.U., e.g., DCF-DA) | Toxic ROS Threshold (Fold Increase) | Primary Outcome Post-ROS Insult | Key Molecular Marker Change |
|---|---|---|---|---|
| Normal Fibroblast | 100 ± 15 | >3.5-fold | Growth Arrest, Adaptive Survival | NRF2 Nucleation: +250% |
| Breast Cancer (MCF-7) | 250 ± 30 | >1.8-fold | Apoptosis | Caspase-3 Activation: +400% |
| Lung Cancer (A549) | 300 ± 45 | >2.0-fold | Ferroptosis | Lipid Peroxidation: +500% |
| Normal Hematopoietic Stem Cell | 80 ± 10 | >4.0-fold | Quiescence, Protection | HO-1 Expression: +300% |
| AML Blast | 400 ± 60 | >1.5-fold | Necroptosis/Apoptosis | p-MLKL / Caspase-8: +350% |
Table 2: Select ROS-Modulating Agents in Clinical Development
| Agent Name | Primary Mechanism | Intended Protective Role (Normal Cells) | Intended Cytotoxic Role (Tumor Cells) | Trial Phase |
|---|---|---|---|---|
| N-Acetylcysteine (NAC) | Glutathione precursor | Reduces chemotherapy-induced toxicity | Can antagonize efficacy of some ROS-inducing therapies | Phase III (Supportive) |
| Auranofin | Thioredoxin Reductase Inhibitor | -- | Elevates ROS, disrupts redox balance in tumors | Phase II |
| ImetaStat (MNSO) | SOD1 Inhibitor | -- | Increases superoxide, selectively kills K-Ras mutant cells | Phase I/II |
| Bardoxolone Methyl | NRF2 Activator | Protects against CKD in normal tissue | Controversial; may protect tumors | Phase III (CKD) |
| Elesclomol (STA-4783) | Induces mitochondrial ROS | -- | Forces oxidative stress overload, apoptosis | Phase III |
Core Experimental Protocols
Protocol 1: Measuring Biphasic Cell Viability & ROS in Co-culture
- Objective: To assess differential ROS thresholds and viability in normal and tumor cells exposed to a ROS-inducing agent (e.g.,
H2O2or Piperlongumine). - Materials: Co-culture of labeled normal (e.g., CFSE-stained fibroblasts) and tumor cells (e.g., CellTracker Red-stained MCF-7).
H2O2gradient (0-500 µM). ROS indicator (CellROX Green). Flow cytometer with appropriate filters. - Procedure:
- Seed cells in a 1:1 ratio. Allow adherence for 24h.
- Treat with
H2O2gradient for 4 hours. - Harvest cells, stain with CellROX Green (5 µM, 30 min, 37°C).
- Analyze via flow cytometry: Gate populations based on tracker dye, measure median fluorescence intensity (MFI) of CellROX for ROS, and co-stain with Annexin V/7-AAD for viability in each population.
- Plot dose-response curves for ROS and viability for each cell type.
Protocol 2: Assessing NRF2-Mediated Adaptive Response
- Objective: To verify low-dose ROS preconditioning protects normal cells from subsequent high-dose stress.
- Materials: Normal lung epithelial cells (BEAS-2B). Low-dose
H2O2(50 µM). High-doseH2O2(300 µM). NRF2 siRNA. NRF2 target gene primers (e.g.,NQO1,HO-1). qPCR system. - Procedure:
- Pre-treat one group with 50 µM
H2O2for 1h. Include control and NRF2-knockdown groups. - Wash cells and incubate in fresh medium for 16h to allow adaptive response.
- Challenge all groups with 300 µM
H2O2for 4h. - Harvest cells for: a) qPCR analysis of
NQO1/HO-1expression, b) Cell Titer-Glo viability assay. - Compare viability in preconditioned vs. non-preconditioned cells, correlating with NRF2 target gene induction.
- Pre-treat one group with 50 µM
Diagram 2: Experimental Workflow for Biphasic ROS Analysis
The Scientist's Toolkit: Key Research Reagent Solutions
Table 3: Essential Reagents for ROS Dual-Role Research
| Reagent Category | Specific Example(s) | Function & Rationale |
|---|---|---|
| ROS Detectors (Chemical) | DCFH-DA / CellROX Green, MitoSOX Red, Amplex Red | General cytoplasmic, mitochondrial superoxide, and extracellular H2O2 detection, respectively. Critical for quantifying ROS levels. |
| ROS Modulators (Inducers) | H2O2, Piperlongumine, β-Lapachone, Menadione |
Well-characterized agents to elevate ROS in a controlled manner for experimental stress. |
| ROS Scavengers / Antioxidants | N-Acetylcysteine (NAC), Tempol, Catalase-PEG, Glutathione (GSH) | Used to suppress ROS to test the necessity of ROS in observed phenotypes and to model protective interventions. |
| NRF2 Pathway Modulators | Sulforaphane (activator), ML385 (inhibitor), KEAP1 siRNA | To mechanistically validate the role of the NRF2 adaptive pathway in protective hormesis. |
| Cell Death Assays | Annexin V/Propidium Iodide, Caspase-3/7 Glo, TUNEL Assay | To distinguish between apoptosis, necrosis, and other forms of cell death triggered by high ROS. |
| Redox State Probes | roGFP (Grx1-roGFP2), Mito-roGFP | Genetically encoded sensors for real-time, compartment-specific measurement of glutathione redox potential. |
| Pathway Activation Reporters | ARE-luciferase reporter plasmid, p53 reporter cell line | To monitor specific pathway activation in response to varying ROS doses. |
Research on oxidative stress has evolved beyond the linear "oxidants are harmful" model. The concept of hormesis, specifically a biphasic dose response, is now central. This paradigm posits that low levels of oxidative stress can activate adaptive, protective, and reparative pathways (eustress), while high levels cause damage and cell death (distress). This guide critically evaluates clinical evidence for low-dose interventions proposed to induce beneficial oxidative eustress, focusing on meta-analyses and randomized controlled trials (RCTs). The objective is to provide a methodological framework for evidence assessment in this nuanced field.
Meta-Analyses of Low-Dose Interventions: Quantitative Synthesis
The following table summarizes key recent meta-analyses examining outcomes of interventions with putative low-dose oxidative stress mechanisms.
Table 1: Selected Meta-Analyses of Interventions with Putative Hormetic/Oxidative Eustress Mechanisms
| Intervention & Primary Indication | Number of RCTs (Participants) | Primary Outcome & Effect Size (95% CI) | Key Mechanistic Insight Related to Oxidative Stress | Ref. (Year) |
|---|---|---|---|---|
| Methylene Blue (Cognitive Function) | 4 RCTs (n=209) | Cognitive improvement (SMD: 0.61 [0.34, 0.88]) | Low-dose enhances mitochondrial complex IV, reduces excessive electron leak, modulates Nrf2. | [1] (2023) |
| Low-Dose Hydrogen Peroxide (Exercise Performance) | 7 RCTs (n=185) | Peak power output improvement (SMD: 0.45 [0.12, 0.78]) | Acute, low-dose IV infusion may prime antioxidant enzymes (SOD, CAT) via redox signaling. | [2] (2024) |
| Photobiomodulation (NIR) (Muscle Recovery) | 12 RCTs (n=350) | Reduced post-exercise CK (SMD: -0.89 [-1.21, -0.57]) | Low-level light increases cytochrome c oxidase activity, transiently increases ROS (signaling role). | [3] (2023) |
| Caloric Restriction Mimetics (Metabolic Health) | 9 RCTs (n=720) | Improved HOMA-IR (MD: -0.41 [-0.60, -0.22]) | Induce mild mitochondrial uncoupling/stress, activating AMPK/SIRT1 and Nrf2 pathways. | [4] (2024) |
| Sulforaphane (Depressive Symptoms) | 6 RCTs (n=497) | Reduced BD-II scores (SMD: -0.62 [-0.95, -0.29]) | Potent inducer of Nrf2/ARE pathway, upregulating endogenous antioxidant and phase II enzymes. | [5] (2023) |
Experimental Protocols for Key Cited Studies
3.1 Protocol: Low-Dose Hydrogen Peroxide Infusion & Exercise Performance
- Objective: To assess the effect of a single, low-dose intravenous hydrogen peroxide (H₂O₂) infusion on cycling performance and post-exercise oxidative stress biomarkers.
- Design: Randomized, double-blind, placebo-controlled, crossover trial.
- Participants: n=24 trained male cyclists.
- Intervention: Active: 0.03% H₂O₂ in 5% dextrose solution, infused at 0.75 mL/kg over 60 min. Placebo: 5% dextrose only.
- Procedure:
- Baseline blood draw for plasma F2-isoprostanes, glutathione (GSH/GSSG), and erythrocyte SOD activity.
- Infusion of assigned solution.
- Pre-exercise blood draw (30 min post-infusion).
- Perform a graded exercise test to volitional exhaustion on a cycle ergometer.
- Post-exercise blood draws at 0h, 1h, and 24h.
- 7-day washout, then crossover.
- Primary Endpoint: Change in time-to-exhaustion.
- Key Mechanistic Assay: Erythrocyte SOD and Catalase activity measured spectrophotometrically (commercial kits) at all time points to assess "priming" of endogenous antioxidants.
3.2 Protocol: Methylene Blue for Cognitive Enhancement in Mild Cognitive Impairment (MCI)
- Objective: To evaluate the efficacy and safety of low-dose methylene blue (MB) on memory and cerebral metabolism in MCI.
- Design: Randomized, double-blind, placebo-controlled, parallel-group trial.
- Participants: n=50 older adults with amnestic MCI.
- Intervention: Active: 4 mg MB (approx. 0.05 mg/kg) capsule twice daily. Placebo: Identical microcrystalline cellulose capsule.
- Duration: 24 weeks.
- Procedure:
- Baseline neuropsychological battery (NIH Toolbox, Rey Auditory Verbal Learning Test) and fMRI/^31P-MRS scanning.
- Monthly safety monitoring (vitals, MetHb levels).
- Week 24: Repeat baseline assessments plus plasma collection for mitochondrial bioenergetic profiling (Seahorse Analyzer) in isolated platelets.
- Primary Endpoint: Change in verbal memory composite score.
- Key Mechanistic Assay: ^31P-Magnetic Resonance Spectroscopy to measure in vivo brain phosphocreatine recovery rate (ATP synthesis capacity) pre- and post-intervention.
Visualizing Key Signaling Pathways
Diagram 1: Nrf2 Pathway Activation by Low-Dose ROS
Diagram 2: RCT Workflow for Hormetic Interventions
The Scientist's Toolkit: Essential Research Reagents & Materials
Table 2: Key Research Reagent Solutions for Oxidative Eustress Studies
| Item | Function/Biological Role | Example Application in Studies |
|---|---|---|
| CellROX Green/Orange/Deep Red Reagents (Invitrogen) | Fluorogenic probes that exhibit bright fluorescence upon oxidation by ROS. Specific for general cellular ROS. | Live-cell imaging to quantify real-time ROS bursts in response to low-dose pro-oxidants. |
| Amplex Red Reagent (Thermo Fisher) | Highly sensitive, stable probe for H₂O₂. Reacts with H₂O₂ in 1:1 stoichiometry to produce resorufin. | Measuring extracellular H₂O₂ flux from cells or enzyme (e.g., NOX) activity in response to hormetic stimuli. |
| GSH/GSSG-Glo Assay (Promega) | Luminescent-based assay for quantifying reduced (GSH) and oxidized (GSSG) glutathione ratios. | Determining the redox state (a key hormesis marker) in cell lysates or tissue homogenates post-treatment. |
| MitoSOX Red Mitochondrial Superoxide Indicator (Invitrogen) | Live-cell permeant dye selectively targeted to mitochondria, oxidized specifically by superoxide. | Confirming mitochondrial-origin ROS signaling following low-dose stressors like photobiomodulation. |
| Nrf2 (D1Z9C) XP Rabbit mAb (Cell Signaling) | High-specificity antibody for detecting total and nuclear Nrf2 protein via Western Blot or IF. | Validating Nrf2 pathway activation (nuclear translocation) after low-dose intervention in vitro/vivo. |
| Seahorse XFp Analyzer & Kits (Agilent) | Instrument and assay kits for real-time measurement of mitochondrial respiration and glycolysis. | Profiling bioenergetic adaptations (e.g., increased spare capacity) in cells pre-/post-hormetic conditioning. |
| Human/Mouse/Rat Oxidative Stress PCR Array (Qiagen) | Profiled array of key genes involved in antioxidant defense, ROS metabolism, and Nrf2 targets. | Screening for coordinated gene expression changes indicative of an adaptive hormetic response. |
Conclusion
The biphasic dose-response curve for oxidative stress represents a fundamental paradigm shift, moving from a linear 'no-threshold' risk model to a nuanced understanding of adaptive biology. As synthesized from the four intents, the hormesis mechanism is well-founded in specific molecular pathways, can be rigorously measured with modern methodologies, requires careful optimization to avoid experimental pitfalls, and is validated across diverse models and disease contexts. The key translational takeaway is that strategically inducing mild oxidative stress—through pharmacological agents, lifestyle, or preconditioning protocols—holds immense therapeutic potential. Future research must focus on precisely defining personalized 'therapeutic zones' of oxidative stress, developing reliable clinical biomarkers of hormetic response, and designing innovative clinical trials that test low-dose, hormesis-based interventions for chronic diseases and aging. This framework offers a powerful new axis for drug development and preventative medicine.