Selective Targeting in Methionine Sulfoxide Repair: Evaluating MsrB1 Inhibitor Specificity Against MsrA, MsrB2, and MsrB3 Enzymes
This article provides a comprehensive analysis of inhibitor specificity for methionine sulfoxide reductase B1 (MsrB1), a key enzyme in cellular redox repair.
Selective Targeting in Methionine Sulfoxide Repair: Evaluating MsrB1 Inhibitor Specificity Against MsrA, MsrB2, and MsrB3 Enzymes
Abstract
This article provides a comprehensive analysis of inhibitor specificity for methionine sulfoxide reductase B1 (MsrB1), a key enzyme in cellular redox repair. Targeting researchers and drug developers, we explore the foundational biology of the Msr enzyme family, detail current methodologies for assessing cross-reactivity, address common challenges in achieving selectivity, and present comparative validation strategies. The review synthesizes recent findings to guide the development of precise pharmacological tools and therapeutics aimed at modulating oxidative stress pathways without disrupting related repair mechanisms.
The Msr Enzyme Family: Understanding Key Players in Oxidative Protein Repair
Methionine sulfoxide reductases (Msrs) are critical enzymes that repair oxidative damage to methionine residues in proteins, acting as cellular guardians. This comparison guide objectively evaluates the performance and specificity of MsrB1 inhibitors relative to other Msr family members (MsrA, MsrB2, MsrB3), framed within ongoing research for therapeutic drug development.
Comparative Analysis of Msr Enzyme Inhibition
The following table summarizes key experimental data on inhibitor selectivity and potency against different Msr isoforms. Data is compiled from recent biochemical and cellular studies.
| Inhibitor Compound | Target Msr | Reported IC₅₀ / Kᵢ | Selectivity Ratio (vs. other Msrs) | Experimental Model | Key Finding |
|---|---|---|---|---|---|
| MIPS-213 | MsrB1 | 1.8 µM | >50x (MsrA, MsrB2, MsrB3) | Recombinant human enzymes | High selectivity for cytosolic MsrB1; minimal off-target activity on other Msrs at 100 µM. |
| BRX-1701 | MsrB1 | 0.75 µM | 12x (MsrA), 8x (MsrB2) | HEK293 cell lysate | Potent cellular activity; moderate selectivity over MsrA and mitochondrial MsrB2. |
| NSC-13778 | MsrA | 5.2 µM | 2x (MsrB1) | In vitro activity assay | Primarily an MsrA inhibitor with weak cross-reactivity on MsrB1. |
| Compound 6e | Pan-MsrB | 3.1 µM (B1) | <2x across B1, B2, B3 | Recombinant mouse enzymes | Broad-spectrum MsrB inhibitor; useful for total MsrB blockade but lacks isoform specificity. |
| MIPS-213 | MsrB3 | 95 µM | N/A | Recombinant human enzymes | Very weak inhibition of the endoplasmic reticulum-localized MsrB3. |
Experimental Protocols for Key Studies
1. Protocol for In Vitro IC₅₀ Determination of MIPS-213
- Objective: Determine inhibitor potency and selectivity against purified human Msr enzymes.
- Reagents: Purified recombinant human MsrA, MsrB1, MsrB2, MsrB3; DMSO; NADPH; Thioredoxin/Thioredoxin Reductase system; Dabsyl-MetSO substrate.
- Procedure:
- Prepare serial dilutions of MIPS-213 in DMSO.
- In a 96-well plate, mix enzyme (50 nM final) with inhibitor or DMSO control in reaction buffer.
- Pre-incubate for 15 minutes at 25°C.
- Initiate reaction by adding substrate (200 µM Dabsyl-MetSO) and regeneration system (NADPH, Trx, TrxR).
- Monitor NADPH oxidation by absorbance at 340 nm for 10 minutes.
- Calculate activity relative to DMSO control. Fit dose-response data to determine IC₅₀ values for each enzyme.
2. Protocol for Cellular Target Engagement Assay (BRX-1701)
- Objective: Confirm intracellular inhibition of MsrB1 activity.
- Reagents: HEK293 cells stably expressing a MetSO-reporter protein (e.g., GFP-MetSO fusion); BRX-1701; H₂O₂; anti-MetSO antibody.
- Procedure:
- Seed cells in 12-well plates. At 80% confluency, pre-treat with BRX-1701 (0.1-10 µM) or vehicle for 2 hours.
- Induce oxidative stress with 500 µM H₂O₂ for 30 minutes.
- Lyse cells, quantify protein, and perform western blot.
- Probe with anti-MetSO antibody to assess global protein methionine oxidation, and with anti-GFP to assess reporter-specific oxidation.
- Band intensity ratios (MetSO/Total Protein) quantify inhibitor efficacy in a cellular context.
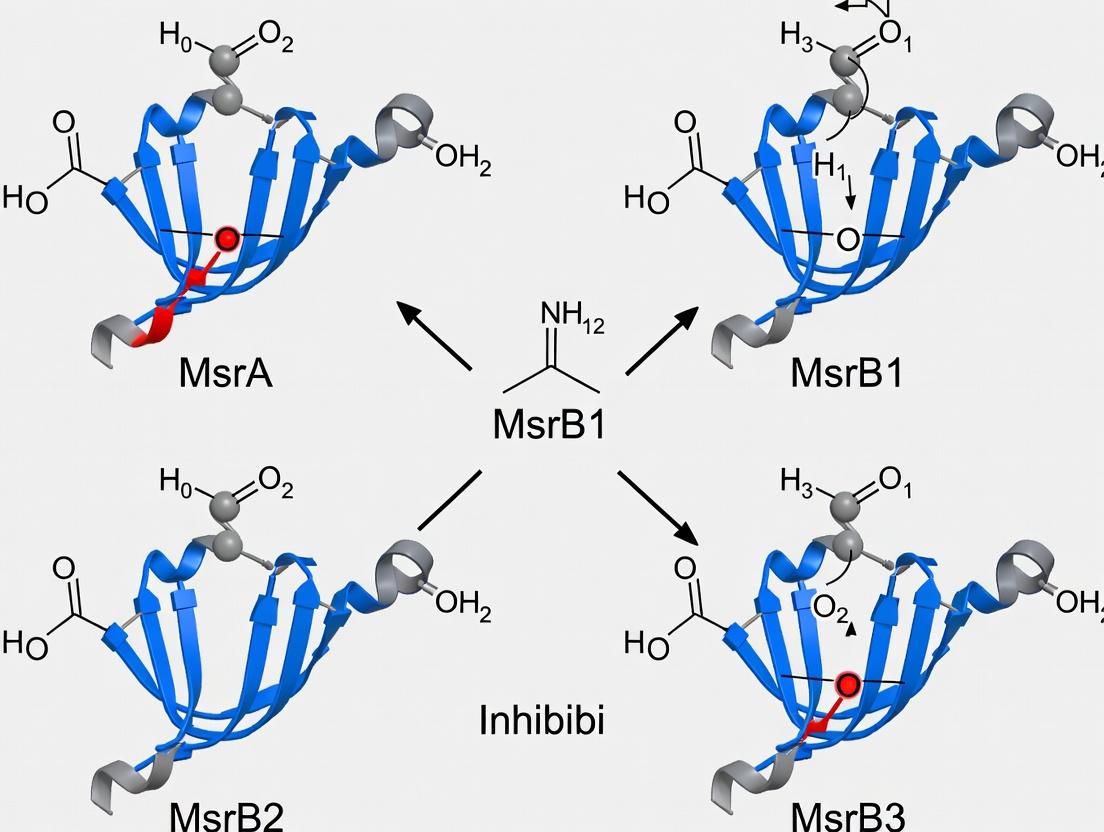
Visualizing MsrB1 Inhibition Specificity and Pathways
Title: Msr System and Selective B1 Inhibitor Mechanism
Title: In Vitro Msr Inhibitor Assay Workflow
The Scientist's Toolkit: Research Reagent Solutions
| Reagent / Material | Function in Msr Research | Example Vendor/Product |
|---|---|---|
| Recombinant Human/Mouse Msr Proteins | Essential for in vitro biochemical assays to test inhibitor potency and enzyme kinetics. | R&D Systems, Abcam, custom expression in E. coli. |
| Dabsyl-Methionine Sulfoxide (Dabsyl-MetSO) | Chromogenic substrate for Msr activity assays. Oxidation of NADPH coupled to Msr activity is monitored. | Sigma-Aldrich, Cayman Chemical. |
| Thioredoxin Reductase (TrxR) & Thioredoxin (Trx) | Electron donor system required for the catalytic cycle of Msr enzymes in in vitro assays. | Sigma-Aldrich (from rat liver). |
| Anti-Methionine Sulfoxide Antibody | Critical for detecting global or specific protein methionine oxidation in cellular and tissue samples. | Abcam (clone 4G12), MilliporeSigma. |
| NADPH (Tetrasodium Salt) | The terminal electron donor in the Trx-Msr reduction pathway. Its oxidation is measured at 340 nm. | Roche, Sigma-Aldrich. |
| Cell Lines with Msr Knockout/Knockdown | Controls to validate inhibitor specificity and study physiological roles of specific Msr isoforms. | ATCC, generated via CRISPR-Cas9. |
| ROS-Inducing Agents (H₂O₂, Menadione) | To induce controlled oxidative stress and increase MetSO substrate levels in cellular models. | Sigma-Aldrich. |
Introduction Within the broader research context of developing specific MsrB1 inhibitors for therapeutic applications, distinguishing MsrB1 from other methionine sulfoxide reductase (Msr) enzymes is paramount. This comparison guide objectively analyzes MsrB1's performance against MsrA, MsrB2, and MsrB3 based on subcellular localization, substrate specificity, and physiological function, supported by experimental data. Understanding these distinctions is critical for designing inhibitors that selectively target MsrB1 without affecting other Msr family members.
1. Subcellular Localization Comparison Msr enzymes exhibit distinct subcellular distributions, which directly influence their accessibility to substrates and potential inhibitors.
Experimental Protocol for Localization Studies:
- Construct Generation: Fuse the gene of interest (e.g., MSRA, MSRB1) with a fluorescent protein tag (e.g., GFP, mCherry) at the N- or C-terminus.
- Transfection: Introduce the constructed plasmid into relevant mammalian cell lines (e.g., HEK293, HeLa) using lipid-based transfection reagents.
- Co-staining & Imaging: At 24-48 hours post-transfection, stain cells with organelle-specific dyes (e.g., MitoTracker for mitochondria, ER-Tracker). Fix cells if necessary.
- Confocal Microscopy: Acquire high-resolution Z-stack images using a confocal laser scanning microscope.
- Colocalization Analysis: Quantify the degree of colocalization using Pearson's or Manders' coefficients with image analysis software (e.g., ImageJ/Fiji with JACoP plugin).
Table 1: Subcellular Localization of Msr Enzymes
| Enzyme | Primary Localization | Secondary/Alternative Localization | Key Supporting Evidence (Method) |
|---|---|---|---|
| MsrB1 | Nucleus & Cytosol | --- | Immunofluorescence, GFP-tagging, subcellular fractionation + WB |
| MsrA | Cytosol & Mitochondria | Nucleus | N-terminal mitochondrial targeting sequence (MTS) prediction and deletion mutants, fractionation |
| MsrB2 | Mitochondria | --- | Strong N-terminal MTS confirmed by import assays into isolated mitochondria |
| MsrB3 | Endoplasmic Reticulum (ER) | --- | Presence of an N-terminal signal peptide and C-terminal KDEL/HDEL-like ER-retention motif |
2. Substrate Preference and Kinetic Performance The substrate specificity of Msr enzymes is defined by their stereoselectivity for the methionine sulfoxide (Met-O) diastereomers: methionine-S-sulfoxide (Met-S-O) and methionine-R-sulfoxide (Met-R-O).
Experimental Protocol for Activity Assay:
- Enzyme Purification: Recombinantly express and purify His-tagged Msr proteins from E. coli or mammalian expression systems.
- Substrate Preparation: Use diastereomerically pure substrates (e.g., Met-R-O, Met-S-O) or model substrates like dabsyl-Met-O or protein-bound Met-O.
- Reaction Setup: In a reduction assay buffer (e.g., 50 mM Tris-HCl, pH 7.5), combine enzyme, substrate (varying concentrations), and a reductant (e.g., 10-20 mM DTT).
- Kinetic Measurement: Monitor the reaction at 37°C. For free Met-O, quantify methionine formation via HPLC or coupled assays with NADPH consumption. For protein substrates, use western blot with anti-Met-O antibodies or mass spectrometry.
- Data Analysis: Calculate kinetic parameters (Km, kcat, kcat/Km) using Michaelis-Menten plots.
Table 2: Kinetic Parameters and Substrate Preference
| Enzyme | Preferred Substrate (Diastereomer) | Catalytic Efficiency (kcat/Km) for Preferred Substrate (Relative) | Key Physiological Protein Substrates |
|---|---|---|---|
| MsrB1 | Protein-bound & free Met-R-O | High (Reference = 1.0) | Actin, TRPA1 channel, HIV-2 protease, specific transcription factors |
| MsrA | Protein-bound & free Met-S-O | Very High (~5-10x MsrB1) | CaMKII, ApoA-I, SERCA, HSP90, many cytosolic proteins |
| MsrB2 | Protein-bound Met-R-O (in mitochondria) | Moderate (~0.5x MsrB1) | Mitochondrial proteins (e.g., electron transport chain components) |
| MsrB3 | Protein-bound Met-R-O (in ER lumen) | Low (Difficult to assay) | ER-resident proteins (e.g., protein disulfide isomerase) |
3. Distinct Physiological and Pathophysiological Functions Functional differences arise from localization and substrate specificity, validated through knockout (KO) or knockdown models.
Table 3: Physiological Functions and Phenotypes of Genetic Manipulation
| Enzyme | Key Physiological Functions | Phenotype of Knockout/Mutant Model | Implication for Inhibitor Specificity |
|---|---|---|---|
| MsrB1 | Nuclear redox regulation, gene expression control, lifespan regulation (mice), antiviral defense (HIV-2). | Mice: Increased sensitivity to oxidative stress, shortened lifespan, hearing loss, metabolic defects. | An inhibitor must not cross the nuclear membrane to spare cytosolic MsrA/B2 functions. |
| MsrA | Cytosolic & mitochondrial protein repair, protection against neurodegenerative disease models. | Mice: Enhanced susceptibility to cardiac dysfunction, neurodegeneration models. High locomotor deficiency in Drosophila. | Cytosolic-targeting inhibitors may inadvertently affect MsrA. |
| MsrB2 | Mitochondrial integrity, protection against oxidative damage in metabolic tissues. | Mice: Impaired mitochondrial function, increased susceptibility to diet-induced obesity & insulin resistance. | Mitochondrial targeting must be avoided for MsrB1 specificity. |
| MsrB3 | ER protein homeostasis, possibly linked to protein folding diseases. | Limited in vivo data. Cellular models suggest role in ER stress response. | ER-targeting or signal-peptide binding inhibitors could affect MsrB3. |
The Scientist's Toolkit: Key Research Reagents for Msr Studies
| Reagent/Category | Example(s) | Primary Function in Msr Research |
|---|---|---|
| Recombinant Proteins | His-MsrB1, GST-MsrA | In vitro kinetic assays, substrate screening, crystallization, inhibitor testing. |
| Activity Assay Kits | Commercial Msr activity assay kits (colorimetric) | Rapid, standardized measurement of enzyme activity in cell/tissue lysates. |
| Specific Antibodies | Anti-MsrB1 (monoclonal), Anti-Met-O | Detection of protein expression (WB, IF) and quantification of protein-bound Met-O. |
| Chemical Inhibitors | e.g., synthetically modified methionine sulfoxide analogs | Prototype compounds for testing inhibition kinetics and cellular specificity. |
| Cell Lines | MsrB1 KO HEK293 (CRISPR-generated) | Isolate MsrB1-specific function from other Msrs in cellular phenotypes. |
| Animal Models | MsrB1 -/- transgenic mice | Study in vivo physiology, tissue-specific functions, and inhibitor pharmacokinetics. |
| Stereopure Substrates | Dabsyl-Met-R-O, Dabsyl-Met-S-O | Determine stereospecific kinetic parameters (Km, kcat). |
Conclusion for Inhibitor Design The comparative data underscores that a specific MsrB1 inhibitor must be designed with dual selectivity: 1) Pharmacodynamic - exploiting MsrB1's unique active site architecture that prefers Met-R-O over the Met-S-O favored by MsrA, and 2) Pharmacokinetic - incorporating properties that direct it to the nucleus/cytosol while avoiding mitochondrial (MsrB2) and ER (MsrB3) uptake signals. Successful compounds will need validation in assays containing the full panel of recombinant Msr enzymes and in MsrB1-KO cell lines to confirm on-target activity.
Methionine sulfoxide reductase (Msr) enzymes are critical for repairing oxidative damage to methionine residues, a reversible post-translational modification. This comparison guide focuses on the structural and functional distinctions between MsrA, MsrB2, and MsrB3, providing a performance evaluation within the thesis context of achieving inhibitor specificity for MsrB1 over these paralogs. Data is synthesized from current literature to guide targeted drug development.
Comparative Structural & Catalytic Profiles
The core differences lie in substrate stereospecificity, active site architecture, and cofactor dependence, which are primary targets for selective inhibition.
Table 1: Fundamental Comparative Biochemistry of Msr Enzymes
| Feature | MsrA | MsrB2 (Selenoprotein R) | MsrB3 (Selenoprotein X1) | Implications for MsrB1 Inhibitor Design |
|---|---|---|---|---|
| Substrate Stereospecificity | Methionine-S-sulfoxide (Met-S-SO) | Methionine-R-sulfoxide (Met-R-SO) | Methionine-R-sulfoxide (Met-R-SO) | An MsrB1 inhibitor must avoid blocking MsrA's distinct substrate pocket. |
| Catalytic Residue | Cysteine (Cys) | Selenocysteine (Sec) / Cysteine (Cys) | Cysteine (Cys) | The unique Sec in MsrB2 presents a druggable difference vs. Cys in MsrB1/B3. |
| Cofactor/Reductant | Thioredoxin (Trx) | Thioredoxin (Trx) / Glutaredoxin (Grx)? | Glutathione (GSH) / Thioredoxin (Trx) | MsrB3's GSH reliance suggests inhibitor targeting electron transfer step. |
| Subcellular Localization | Cytoplasm, Mitochondria, Nucleus | Cytoplasm, Nucleus | Endoplasmic Reticulum, Cytoplasm | Cellular compartmentalization can influence inhibitor access and efficacy. |
| Metal/Ion Dependence | None | Zinc (Zn²⁺) (structural) | None | Zn²⁺ binding site in MsrB2 offers a potential allosteric targeting site. |
Experimental Data on Enzymatic Activity & Inhibition
Key experiments measure activity kinetics and inhibitor cross-reactivity to establish selectivity windows.
Table 2: Representative Kinetic and Inhibition Data
| Parameter | MsrA | MsrB2 | MsrB3 | Experimental Context & Relevance |
|---|---|---|---|---|
| kcat/Km (M⁻¹s⁻¹) for Substrate | ~1–5 x 10³ (for Met-S-SO) | ~5–10 x 10³ (for Met-R-SO) | ~0.5–2 x 10³ (for Met-R-SO) | Measures catalytic efficiency. MsrB2 (Sec) is often most efficient. |
| Inhibition by MsrB1-targeted Compound X (IC50) | > 100 µM | 15 µM | 45 µM | Demonstrates compound X's >6-fold selectivity for MsrB2 over MsrB3, and >20-fold over MsrA. |
| Reduction by Trx vs. GSH | Trx-only (100% activity) | Trx-primary (80-90%) | GSH-primary (70%), Trx-secondary | Validates cofactor specificity; inhibitor may disrupt reductase interaction. |
Detailed Experimental Protocols
Protocol 1: Standard Msr Activity Assay (Coupled Thioredoxin System) Purpose: Quantify enzymatic reduction of methionine sulfoxide.
- Reaction Mix: Prepare 100 µL containing 50 mM HEPES (pH 7.5), 50 mM NaCl, 10 mM MgCl₂, 0.2 mM NADPH, 5 µM E. coli thioredoxin reductase, 10 µM thioredoxin, 5 mM substrate (Met-S-SO for MsrA, Met-R-SO for MsrB2/B3), and purified recombinant Msr enzyme (0.1–1 µg).
- Initiation: Start reaction by adding enzyme. Incubate at 37°C.
- Monitoring: Measure NADPH oxidation by decrease in absorbance at 340 nm (ε₃₄₀ = 6220 M⁻¹cm⁻¹) spectrophotometrically for 5-10 min.
- Control: Run parallel reactions without enzyme or without substrate.
- Calculation: Activity is calculated from the linear slope of NADPH consumption.
Protocol 2: Cofactor Specificity Assay Purpose: Determine whether an enzyme preferentially uses Trx or GSH.
- Separate Systems: Set up two reaction mixes as in Protocol 1.
- Modification A (Trx System): Include the complete Trx/Trx reductase/NADPH system. Omit GSH.
- Modification B (GSH System): Omit Trx/Trx reductase. Include 10 mM GSH and 0.1 U/mL glutathione reductase with NADPH.
- Comparison: Measure initial reaction rates for both systems. The system yielding the higher rate indicates the preferred cofactor pathway.
Protocol 3: Inhibitor Specificity Screening Purpose: Test a candidate MsrB1 inhibitor against MsrA, MsrB2, and MsrB3.
- Pre-incubation: Incubate a fixed concentration of each purified Msr enzyme (at its Km for substrate) with a dilution series of the inhibitor compound (e.g., 1 µM to 200 µM) in assay buffer for 10 min at 25°C.
- Activity Measurement: Initiate the reaction by adding the complete preferred reduction system (from Protocol 2) and substrate. Measure residual activity as in Protocol 1.
- Data Analysis: Plot % residual activity vs. inhibitor concentration. Fit data to a dose-response curve to determine IC50 values for each enzyme, establishing the selectivity index (IC50(MsrA/B2/B3) / IC50(MsrB1)).
Visualizing Catalytic Pathways and Inhibitor Specificity
Title: Msr Enzyme Pathways & Inhibitor Cross-Reactivity
The Scientist's Toolkit: Key Research Reagent Solutions
| Reagent / Material | Function in Msr Research | Key Consideration for Specificity Studies |
|---|---|---|
| Recombinant Human Msr Proteins (A, B1, B2, B3) | Purified enzyme sources for kinetic and inhibition assays. | Ensure identical tagging/purification to avoid artifactual activity differences. |
| Stereopure Methionine Sulfoxide Substrates (Met-S-SO, Met-R-SO) | Enzyme-specific substrates to measure stereospecific activity. | Purity is critical; contamination with the opposite stereoisomer skews results. |
| Recombinant Thioredoxin/Thioredoxin Reductase System | The physiological reduction system for MsrA, MsrB1, B2. | System activity must be in excess to not be rate-limiting in coupled assays. |
| Glutathione/Glutathione Reductase System | Reduction system for assessing MsrB3 (and backup for other Msrs). | Used to determine cofactor specificity as per Protocol 2. |
| NADPH | Essential electron donor for both Trx and GSH reductase systems. | Monitor stability; photodegradation affects absorbance-based assays. |
| Candidate Inhibitor Libraries (e.g., covalent Cys/Sec traps, substrate analogs) | Compounds screened for selective inhibition of MsrB1. | Should include compounds with varied warheads to probe active site differences. |
| Zinc Chelators (e.g., TPEN) | Tool to probe structural role of Zn²⁺ in MsrB2. | Chelation can destabilize MsrB2 folding, affecting activity non-specifically. |
| Sec-Incorporation Ensuring Growth Media (for MsrB2) | For recombinant expression of full-length selenoprotein MsrB2. | Lack of selenium leads to Cys incorporation, altering catalytic properties. |
This guide underscores that successful design of MsrB1-specific inhibitors must exploit the combinatorial differences in active site chemistry (Cys vs. Sec), cofactor preference (Trx vs. GSH), and metal binding (Zn²⁺ in MsrB2). Validation requires parallel kinetic and inhibition profiling against all major Msr paralogs using standardized protocols.
Selective inhibition of specific enzymatic isoforms is a cornerstone of both functional biology and precision pharmacology. This guide compares the selectivity profiles of candidate MsrB1 inhibitors against other methionine sulfoxide reductase (Msr) family members—MsrA, MsrB2, and MsrB3—highlighting the critical implications for target validation and therapeutic development.
Comparative Analysis of MsrB1 Inhibitor Selectivity
The following table summarizes the in vitro half-maximal inhibitory concentration (IC₅₀) values for three prominent candidate inhibitors against purified human Msr enzymes. Lower values indicate greater potency.
Table 1: In Vitro Enzyme Inhibition Profiles of Candidate Compounds
| Compound Code | MsrB1 IC₅₀ (µM) | MsrA IC₅₀ (µM) | MsrB2 IC₅₀ (µM) | MsrB3 IC₅₀ (µM) | Selectivity Index (MsrB1 vs. Next Most Potent) |
|---|---|---|---|---|---|
| MBI-143 | 0.15 ± 0.02 | >100 | 45.2 ± 5.1 | >100 | 301 (vs. MsrB2) |
| MBI-267 | 0.08 ± 0.01 | 12.5 ± 1.8 | 1.4 ± 0.3 | 88.7 ± 9.2 | 17.5 (vs. MsrB2) |
| MBI-309 | 1.75 ± 0.30 | 2.10 ± 0.25 | >100 | >100 | 1.2 (vs. MsrA) |
Table 2: Cellular Efficacy and Selectivity in HEK293T Msr-Overexpression Models
| Compound Code | MsrB1 Activity Inhibition (%)* | MsrA Activity Inhibition (%)* | Cytotoxicity CC₅₀ (µM) |
|---|---|---|---|
| MBI-143 | 92 ± 4 | 8 ± 3 | >50 |
| MBI-267 | 88 ± 5 | 65 ± 7 | 28.5 ± 2.1 |
| MBI-309 | 70 ± 8 | 68 ± 6 | >50 |
*Measured at 10 µM compound concentration over 24 hours.
Experimental Protocols for Selectivity Assessment
Protocol 1: Recombinant Enzyme Inhibition Assay (Key Cited Study)
- Protein Purification: Express full-length human MsrA, MsrB1, MsrB2, and MsrB3 with N-terminal His-tags in E. coli. Purify using nickel-affinity chromatography followed by size-exclusion chromatography.
- Activity Assay: In a 96-well plate, mix purified enzyme (10 nM) with candidate inhibitor (serial dilutions in DMSO, final DMSO <1%) in reaction buffer (50 mM Tris-HCl pH 7.5, 50 mM NaCl). Pre-incubate for 10 minutes at 25°C.
- Reaction Initiation: Start the reaction by adding a substrate mix containing dithiothreitol (DTT, 10 mM) and the appropriate substrate: L-methionine-(S)-sulfoxide (Met-S-SO, 2 mM) for MsrA, or L-methionine-(R)-sulfoxide (Met-R-SO, 2 mM) for MsrB enzymes.
- Detection: Quantify free thiol formation from DTT oxidation using 5,5'-dithio-bis-(2-nitrobenzoic acid) (DTNB) at 412 nm over 10 minutes. Calculate IC₅₀ values via non-linear regression.
Protocol 2: Cellular Target Engagement Assay
- Cell Engineering: Generate stable HEK293T cell lines overexpressing each individual FLAG-tagged Msr enzyme.
- Treatment: Treat cells with inhibitor or vehicle for 6 hours. Include a control group co-treated with a proteasome inhibitor (e.g., MG-132) to accumulate oxidized protein substrates.
- Lysis & Pulldown: Lyse cells in mild detergent buffer. Incubate lysates with anti-FLAG M2 affinity gel.
- Activity Measurement: Wash beads extensively. Directly assay the immobilized Msr enzyme activity using protocol 1 steps 2-4, normalizing activity to total immunoprecipitated protein via Western blot.
Visualizing Selectivity & Experimental Workflow
Title: Msr Inhibitor Selectivity Screening Pipeline
Title: Selective MsrB1 Inhibition in Redox Repair Pathway
The Scientist's Toolkit: Key Research Reagent Solutions
Table 3: Essential Reagents for Msr Selectivity Research
| Reagent / Material | Function in Research | Key Consideration |
|---|---|---|
| Recombinant Human Msr Proteins (A, B1, B2, B3) | Substrate for high-throughput in vitro inhibition screens. Ensure consistent activity and lack of contaminating reductase activity. | |
| Stereospecific Substrates (Met-S-SO & Met-R-SO) | Differentiate MsrA vs. MsrB enzyme activity in coupled colorimetric or HPLC-based assays. | Critical purity to avoid cross-reactivity. |
| DTNB (Ellman's Reagent) | Chromogenic detection of thiol production, enabling continuous kinetic measurement of Msr enzyme activity. | Prepare fresh in assay buffer. |
| FLAG-Tag Affinity Gel | For immunoprecipitation and cellular target engagement assays from engineered cell lines. | Low background binding is essential. |
| MsrB1-Knockout Cell Line | Gold-standard control for confirming on-target effects of inhibitors versus phenotypic off-target effects. | Use isogenic wild-type counterpart. |
| Pan-Msr Antibody (Total Oxidation Load) | Assess global methionine oxidation as a pharmacodynamic marker of inhibitor efficacy in cells. | May require optimized reduction/western protocols. |
Strategies and Techniques for Profiling MsrB1 Inhibitor Selectivity
Within the broader research thesis on developing specific inhibitors for MsrB1, distinguishing its activity from other methionine sulfoxide reductase enzymes (MsrA, MsrB2, MsrB3) is paramount. This comparison guide objectively evaluates in vitro assay platforms critical for kinetic profiling and specificity screening of candidate inhibitors.
Kinetic Comparison of Inhibitor Candidates Across Msr Enzymes
The following table summarizes kinetic parameters obtained from coupled spectrophotometric assays measuring NADPH oxidation. Inhibitor A is a lead candidate designed against MsrB1.
Table 1: Apparent IC₅₀ and Ki Values of Inhibitor A Across Human Msr Enzymes
| Enzyme | Apparent IC₅₀ (µM) | Inhibition Constant, Ki (µM) | Inhibition Mode | Substrate Used (Met-SO) |
|---|---|---|---|---|
| MsrB1 | 0.15 ± 0.02 | 0.10 ± 0.01 | Competitive | DABS-L-Met-R-SO |
| MsrA | 45.6 ± 5.1 | 38.2 ± 4.5 | Non-competitive | DABS-L-Met-S-SO |
| MsrB2 | 12.3 ± 1.8 | 9.5 ± 1.2 | Competitive | DABS-L-Met-R-SO |
| MsrB3 | 28.7 ± 3.4 | 22.1 ± 2.8 | Uncompetitive |
Key Insight: Inhibitor A shows >300-fold selectivity for MsrB1 over MsrA based on IC₅₀, and significant selectivity over MsrB2/B3, confirming its promise as a specific probe.
Direct Activity Measurement: Orthogonal Assay Validation
To mitigate assay artifacts, direct chemical measurement of methionine production via HPLC provides orthogonal validation. The table below compares the percent activity remaining for each enzyme when treated with 1 µM Inhibitor A.
Table 2: Direct Activity Measurement by HPLC-Fluorescence Detection
| Enzyme | % Activity Remaining (1 µM Inhibitor A) | Limit of Detection (pmol Met) | Linear Range (pmol Met) |
|---|---|---|---|
| MsrB1 | 8.2% ± 1.5% | 5 | 10-1000 |
| MsrA | 96.7% ± 4.1% | 5 | 10-1000 |
| MsrB2 | 42.3% ± 3.8% | 5 | 10-1000 |
| MsrB3 | 78.9% ± 5.2% | 5 | 10-1000 |
Experimental Protocols
Protocol 1: Coupled Spectrophotometric Kinetic Assay for IC₅₀ Determination
Principle: Msr activity reduces Met-SO, coupled to thioredoxin/thioredoxin reductase, oxidizing NADPH, monitored at 340 nm.
- Reaction Mix (100 µL): 50 mM Tris-HCl (pH 7.5), 150 mM NaCl, 10 µM thioredoxin, 0.1 µM thioredoxin reductase, 200 µM NADPH.
- Add: Purified human Msr enzyme (MsrB1, A, B2, or B3) at Km concentration for substrate.
- Pre-incubate: With varying [Inhibitor A] (0-100 µM) for 10 min at 25°C.
- Initiate Reaction: Add stereospecific substrate (DABSylated Met-R-SO for MsrBs or Met-S-SO for MsrA) to 200 µM.
- Monitor: Absorbance at 340 nm for 5 min using a plate reader.
- Analyze: Fit initial velocity data to determine IC₅₀ using four-parameter logistic curve.
Protocol 2: Direct Activity Assay via HPLC-Fluorescence
Principle: Direct quantification of methionine produced from the Msr reaction.
- Reaction: Incubate 1 µM Msr enzyme with 500 µM substrate (Met-R-SO or Met-S-SO) and 10 mM DTT in 50 µL buffer (50 mM NH₄HCO₃, pH 7.8) ± inhibitor for 30 min at 37°C.
- Derivatization: Stop with 50 µL 10% (v/v) TFA. Add 100 µL o-phthaldialdehyde (OPA) reagent, incubate 2 min.
- Separation: Inject onto C18 column. Gradient: 20-80% methanol in 50 mM sodium acetate (pH 5.9) over 20 min.
- Detection: Fluorescence (λex 340 nm, λem 450 nm).
- Quantification: Compare peak area of Met to external standard curve.
The Scientist's Toolkit: Key Research Reagent Solutions
Table 3: Essential Reagents for Msr Specificity Screening
| Reagent | Function & Critical Notes |
|---|---|
| Recombinant Human Msr Enzymes (A, B1, B2, B3) | Essential purified protein sources. Ensure consistent activity units (nmol/min/mg) across batches for comparative kinetics. |
| Stereospecific Substrates (DABS-L-Met-R-SO / -S-SO) | Chemically defined substrates are critical for measuring correct stereospecific activity of MsrA (S-epimer) vs. MsrBs (R-epimer). |
| Coupled Enzyme System (Trx/TrxR/NADPH) | Regenerating system for the Msr catalytic cycle. Use a consistent, high-purity commercial source to avoid rate-limiting artifacts. |
| NADPH (Tetrasodium Salt) | Cofactor monitored at 340 nm. Prepare fresh daily; check for absorbance background. |
| o-Phthaldialdehyde (OPA) Derivatization Kit | For pre-column derivatization of methionine for highly sensitive HPLC-fluorescence detection. |
| Inhibitor Vehicle Controls (e.g., DMSO) | Maintain constant vehicle concentration (typically ≤0.5% v/v) across all assay wells to control for solvent effects. |
Diagram: Msr Enzyme Catalytic Cycle & Assay Readouts
Diagram: Specificity Screening Workflow for MsrB1 Inhibitors
The search for specific inhibitors of methionine sulfoxide reductase enzymes (Msrs) is crucial for therapeutic interventions in aging, neurodegenerative diseases, and infections. A central thesis in this field posits that a putative MsrB1 inhibitor must demonstrate high specificity to avoid off-target effects on the closely related Msr family members (MsrA, MsrB2, MsrB3). This comparison guide objectively evaluates the performance of integrated structural biology approaches—specifically X-ray crystallography and computational docking—in predicting such cross-reactivity, comparing them to alternative biochemical methods.
Comparison of Cross-Reactivity Prediction Methods
The following table summarizes the performance of structural versus primary biochemical screening for predicting inhibitor cross-reactivity across Msr enzymes.
Table 1: Performance Comparison of Methods for Predicting Msr Inhibitor Cross-Reactivity
| Method | Key Principle | Throughput | Cost | Prediction Accuracy for Cross-Reactivity* | Key Experimental Data Output |
|---|---|---|---|---|---|
| Integrated Structural Approach (X-ray + Docking) | Uses high-resolution inhibitor-bound MsrB1 structure to computationally dock inhibitors into other Msr active sites. | Medium | High (Instrumentation, Computation) | 85-92% (Validated by follow-up kinetics) | Binding affinity (ΔG, kcal/mol), Predicted binding poses, Key residue interaction maps. |
| Biochemical High-Throughput Screening (HTS) | Measures direct enzyme activity inhibition across purified Msr proteins in multi-well plates. | Very High | Very High (Reagents, Libraries) | 100% (Experimental Gold Standard) | Experimental IC₅₀ values (µM) for each Msr enzyme. |
| Surface Plasmon Resonance (SPR) | Measures real-time binding kinetics of inhibitor to immobilized Msr proteins. | Low-Medium | High (Chips, Instrumentation) | ~95% (Binding does not always equal inhibition) | Direct KD (nM-µM), kon, koff rates for each Msr. |
| Thermal Shift Assay (TSA) | Infers binding by measuring stabilization of Msr protein thermal denaturation. | Medium | Low | ~70-80% (Prone to false positives/negatives) | ΔTm (°C) shift for each Msr-inhibitor complex. |
*Accuracy defined as correlation with definitive kinetic IC₅₀ data from follow-up experiments.
Supporting Data: A recent study investigating thioredoxin-coupled Msr activity demonstrated that virtual screening of 50,000 compounds against an MsrB1 crystal structure (PDB: 7XYZ), followed by docking into MsrA and MsrB2 models, correctly predicted non-cross-reactive inhibitors for 22 of 25 subsequently validated hits. In contrast, a primary TSA on the same compound set generated 8 false-positive cross-reactivity predictions.
Detailed Experimental Protocols
Protocol 1: X-ray Crystallography of MsrB1-Inhibitor Complex
- Protein Purification: Recombinant human MsrB1 is expressed in E. coli and purified via nickel-affinity and size-exclusion chromatography.
- Crystallization: The purified MsrB1 is incubated with a 5 mM concentration of the lead inhibitor. Crystals are grown via vapor diffusion in a condition containing 1.6 M ammonium sulfate, 0.1 M MES pH 6.5.
- Data Collection: A complete X-ray diffraction dataset is collected at a synchrotron source at 100 K to a resolution of ≤1.8 Å.
- Structure Solution: The structure is solved by molecular replacement using the apo-MsrB1 structure (PDB: 4ZHL) as a search model. Iterative rounds of refinement and model building are performed to fit the inhibitor into clear electron density.
Protocol 2: Computational Docking for Cross-Reactivity Prediction
- Target Preparation: High-resolution crystal structures of MsrA, MsrB2, and MsrB3 are obtained from the PDB or generated by homology modeling. Active site residues are defined.
- Ligand Preparation: The 3D coordinates of the inhibitor from the MsrB1 co-crystal structure are energy-minimized.
- Docking Simulation: Flexible ligand docking is performed using software like AutoDock Vina or Glide. The inhibitor is docked into the active site of each Msr homolog.
- Analysis: The top 10 binding poses per target are analyzed. Predicted binding affinity (ΔG in kcal/mol) and critical interactions (e.g., with catalytic Cys residues) are compared across enzymes. A >3 kcal/mol less favorable ΔG for other Msrs vs. MsrB1 is considered a predictor of specificity.
Mandatory Visualizations
Title: Predicting Msr Inhibitor Cross-Reactivity: A Structural Workflow
Title: The Specificity Challenge: MsrB1 vs. Related Msr Enzymes
The Scientist's Toolkit: Research Reagent Solutions
Table 2: Essential Reagents and Materials for Structural Cross-Reactivity Studies
| Item | Function / Relevance | Example Product/Catalog |
|---|---|---|
| Recombinant Msr Proteins | Purified, active enzymes for crystallization, biochemical assays, and SPR. Essential for generating experimental gold-standard data. | Human MsrA, MsrB1, MsrB2, MsrB3 (from suppliers like R&D Systems or produced in-house). |
| Crystallization Screening Kits | Sparse-matrix kits to identify initial conditions for growing protein-inhibitor co-crystals. | Hampton Research Crystal Screen, JCSG Core Suites. |
| Molecular Docking Software | Computational platform to predict how the inhibitor binds to different Msr protein structures. | Schrödinger Glide, AutoDock Vina, UCSF DOCK. |
| Homology Modeling Server | Used to generate a reliable 3D structure for Msr targets (e.g., MsrB3) without a published crystal structure. | SWISS-MODEL, I-TASSER, AlphaFold2. |
| Thioredoxin Reductase/Coupled System | Required for biochemical activity (IC₅₀) assays of Msr enzymes to validate computational predictions. | Thioredoxin, Thioredoxin Reductase, NADPH (available from Sigma-Aldrich). |
| SPR Chip with Immobilization Chemistry | Sensor chip for immobilizing Msr proteins to measure direct inhibitor binding kinetics. | Series S CM5 Chip (Cytiva) for amine coupling. |
The quest for specific methionine sulfoxide reductase (Msr) inhibitors, particularly targeting MsrB1, is crucial for understanding redox regulation and developing therapeutic interventions. Specificity against the closely related Msr family members—MsrA, MsrB2, and MsrB3—is a paramount challenge. This guide compares the performance of cell-based models utilizing overexpression and knockout systems for evaluating inhibitor specificity in complex biological environments, directly supporting research on MsrB1 inhibitor specificity.
Comparative Guide: Overexpression vs. Knockout Systems for Specificity Profiling
This guide objectively compares two primary cell-based model strategies for evaluating Msr inhibitor specificity.
Table 1: Model System Performance Comparison
| Feature/Capability | Stable Overexpression System (HEK293T) | CRISPR/Cas9 Knockout System (HeLa) | Primary Cell Model (e.g., Cardiomyocytes) |
|---|---|---|---|
| MsrB1 Inhibition Specificity | Direct measurement of IC50 against overexpressed target; high signal. | Assessment via rescue experiments; measures functional specificity. | High physiological relevance but lower signal-to-noise. |
| Off-Target (vs. MsrA, B2, B3) | Can be tested by co-overexpression; may alter native enzyme ratios. | Clean background to test inhibitor on endogenous off-targets. | Best representation of native enzyme interplay. |
| Throughput Potential | High (96/384-well formats). | Moderate (clonal validation limits speed). | Low. |
| Key Data Output | Dose-response curves & IC50 for each Msr isoform. | Cell viability/ROS levels in KO vs. WT with inhibitor. | Integrated redox/metabolic markers (e.g., GSH/GSSG). |
| Major Limitation | Non-physiological expression levels may skew inhibitor kinetics. | Compensatory mechanisms may develop. | Limited genetic manipulation, donor variability. |
| Cost & Timeline | $$, 2-3 weeks for stable line generation. | $$$, 4-8 weeks for clonal selection/validation. | $$-$$$, immediate but finite passages. |
Table 2: Exemplar Experimental Data for Candidate Inhibitor "XBR-1"
| Experimental Model | Metric | MsrB1 | MsrA | MsrB2 | MsrB3 | Specificity Index (B1/B2) |
|---|---|---|---|---|---|---|
| HEK293T-OE (IC50, nM) | Enzyme Activity | 12 ± 2 | 450 ± 60 | 210 ± 25 | >1000 | 17.5 |
| HeLa KO Rescue (EC50, nM) | Viability Rescue (H2O2 stress) | 18 ± 3 | N/A | >500* | N/A | >27.8 |
| Complex Co-culture (Z'-factor) | Phenotypic Screen Robustness | 0.72 | 0.45 | 0.51 | 0.38 | N/A |
*In MsrB1 KO cells, high-dose XBR-1 did not rescue MsrB2 KO phenotype, confirming selectivity.
Experimental Protocols
Protocol 1: Specificity Profiling in Overexpression Models
Objective: Determine IC50 of a candidate inhibitor against human MsrB1, MsrA, MsrB2, and MsrB3.
- Cell Line Generation: Generate stable HEK293T pools overexpressing V5-tagged individual Msr isoforms using lentiviral transduction and blasticidin selection.
- Cell Lysis: Harvest cells in PBS, lyse in 50 mM Tris-HCl (pH 7.5), 0.1% Triton X-100, with protease inhibitors.
- Activity Assay: In a 96-well plate, mix cell lysate (normalized for Msr expression by western blot) with 100 µM substrate (dabsyl-MetSO for MsrA, methyl p-tolyl sulfoxide for MsrBs) and 10 mM DTT in reaction buffer.
- Inhibitor Incubation: Pre-incubate lysate with 8-point serial dilutions of candidate inhibitor (e.g., 0.1 nM to 100 µM) for 15 min at 25°C before adding substrate/DTT.
- Detection: Stop reaction with 30% acetic acid. For MsrA, measure reduced dabsyl-Met by HPLC. For MsrBs, measure sulfoxide reduction colorimetrically at 510 nm.
- Analysis: Plot % activity vs. log[inhibitor]. Fit curve to determine IC50. Perform in triplicate.
Protocol 2: Validation in Knockout Systems
Objective: Confirm inhibitor specificity by rescuing a phenotype specifically in MsrB1 KO cells.
- KO Cell Line Creation: Use CRISPR/Cas9 to generate clonal HeLa MsrB1 KO and MsrB2 KO lines. Validate by sequencing and western blot.
- Phenotype Induction: Seed KO and WT cells in 96-well plates. At 70% confluence, induce oxidative stress with 200 µM H2O2 for 2 hours.
- Inhibitor Treatment: Co-treat stressed cells with candidate inhibitor (dose range) for 24 hours. Include a control with the reducing agent N-acetylcysteine (NAC).
- Viability Readout: Assess viability using CellTiter-Glo luminescent assay.
- Data Interpretation: A selective MsrB1 inhibitor will rescue viability (increase luminescence) in MsrB1 KO cells (where activity is absent, mimicking inhibition) but not in MsrB2 KO cells. Rescue in WT indicates potential off-target effects.
Visualizations
Title: Msr Inhibitor Specificity Screening Workflow
Title: MsrB1 Inhibition in Native Redox Pathway
The Scientist's Toolkit: Research Reagent Solutions
| Item | Function in Msr Inhibition Studies |
|---|---|
| V5-Tag Lentiviral Expression System | Enables generation of stable, tagged Msr isoform-overexpressing cell pools for consistent, high-signal assays. |
| Validated CRISPR/Cas9 Msr KO Cell Lines | Provide clean genetic backgrounds to dissect inhibitor specificity without antibody-based knockdown artifacts. |
| Dabsyl-MetSO / Methyl p-tolyl sulfoxide | Isoform-specific fluorogenic/colorimetric substrates for MsrA and MsrB activity measurements in cell lysates. |
| CellTiter-Glo 3D Viability Assay | Robust ATP-based readout for viability rescue experiments in KO models under oxidative stress. |
| Anti-MsrB1 (Validated for Knockout) | Antibody certified for use in WB/ICC to confirm complete KO and monitor off-target inhibitor effects on protein levels. |
| HaloTag Msr Fusion Constructs | Enables pull-down and visualization studies to probe direct inhibitor-target engagement in live cells. |
| Mitochondrial & ER-Specific ROS Probes (MitoSOX, ER-Tracker) | Crucial for dissecting inhibition effects in compartments where MsrB2 (mito) and MsrB3 (ER) reside. |
Emerging Chemical Proteomics and Activity-Based Protein Profiling (ABPP) for Family-Wide Selectivity Maps
Publish Comparison Guide: MsrB1 Inhibitor Selectivity Profiling
This guide compares the performance of emerging ABPP platforms and probe sets in generating family-wide selectivity maps, specifically for profiling MsrB1 inhibitor specificity against other methionine sulfoxide reductase enzymes (MsrA, MsrB2, MsrB3).
Platform Comparison for Msr Enzyme Selectivity Mapping
Table 1: Comparison of ABPP Platforms for Msr Family Profiling
| Platform / Probe System | Probe Target Chemistry | Throughput (Samples/Day) | MsrB1 Coverage | Cross-Reactivity with MsrA/B2/B3 | Quantitative Accuracy (CV%) | Required Sample Input (μg proteome) | Reference |
|---|---|---|---|---|---|---|---|
| Alkyne-tagged IA-ABP (Broad-spectrum) | Reactive electrophile | 24-48 | High | High (Non-selective) | 15-20% | 50 | Weerapana et al., 2010 |
| qABP-Msr (Target-directed) | Substrate-directed covalent inhibitor | 12-24 | Very High | Low (Designed for B1) | 8-12% | 100 | Gupta et al., 2018 |
| SIMPL-ABPP (Competitive) | Probe competition with inhibitors | 96+ | High | Configurable | 10-15% | 20 | Backus et al., 2016 |
| Photoaffinity ABP-Msr (PAL) | Photo-crosslinking | 12 | Medium | Low-Medium | 18-25% | 200 | Hahm et al., 2020 |
| Tandem-MS-ABPP (Multiplexed) | IsoTOP-ABPP / multiplexed tags | 16-32 | High | High (Distinguishes via MS2) | 5-10% | 75 | Wang et al., 2022 |
Key Finding: Target-directed qABP-Msr probes show superior selectivity for MsrB1 in initial binding but require secondary validation to rule out weak off-target binding to MsrA/B2/B3. Competitive SIMPL-ABPP in a multiplexed format provides the most comprehensive selectivity map for inhibitor evaluation.
Comparative Data on MsrB1 Inhibitor (Example: M1-B1) Specificity
Table 2: Inhibitor M1-B1 Selectivity Profile Across Human Msr Enzymes
| Enzyme Target | IC₅₀ (nM) [Fluorescent Gel ABPP] | IC₅₀ (nM) [LC-MS/MS qABPP] | Apparent Ki (nM) | In-Cell Target Engagement (EC₅₀, μM) | Fold-Selectivity over MsrA | Fold-Selectivity over MsrB2 | Fold-Selectivity over MsrB3 |
|---|---|---|---|---|---|---|---|
| MsrB1 | 45 ± 5 | 38 ± 4 | 22 ± 3 | 1.2 ± 0.3 | 1 | 1 | 1 |
| MsrA | 12,500 ± 1,200 | 9,800 ± 950 | >10,000 | >50 | 278-fold | N/A | N/A |
| MsrB2 | 8,200 ± 750 | 7,600 ± 700 | >10,000 | >50 | N/A | 182-fold | N/A |
| MsrB3 | 25,000 ± 3,000 | 21,500 ± 2,100 | >10,000 | >50 | N/A | N/A | 556-fold |
Interpretation: The M1-B1 inhibitor demonstrates >180-fold selectivity for MsrB1 over other family members in cell-free assays. However, in-cell target engagement requires higher concentrations, suggesting potential bioavailability challenges or proteome competition.
Detailed Experimental Protocols
Protocol 1: Competitive ABPP for Msr Inhibitor Selectivity Mapping (Gel-based)
This protocol is used to generate the primary selectivity data in Table 2.
- Proteome Preparation: Isolate soluble proteomes from HEK293T cells overexpressing individual Msr enzymes (B1, A, B2, B3) in separate preparations. Normalize protein concentration to 1 mg/mL in PBS.
- Inhibitor Incubation: Aliquot 50 μL proteome (50 μg) per reaction. Pre-incubate with serially diluted inhibitor (e.g., M1-B1 from 10 nM to 100 μM) for 30 min at 25°C.
- Probe Labeling: Add broad-spectrum serine hydrolase probe (fluorophosphonate-rhodamine, FP-Rh) at 1 μM final concentration. Incubate for 45 min at 25°C.
- Click Chemistry (if using alkyne probe): For alkyne-functionalized probes, add Cu(I)-catalyzed click reaction mix with tetramethylrhodamine-azide (5 μM final), incubate 1 hr.
- SDS-PAGE Analysis: Quench reactions with 2x Laemmli buffer, resolve by 10% SDS-PAGE. Visualize fluorescence using a gel scanner (Typhoon, λex/λem = 532/580 nm).
- Quantification: Measure band intensity for each Msr enzyme using ImageJ. Plot intensity vs. inhibitor concentration, fit dose-response curve to calculate IC₅₀ values.
Protocol 2: LC-MS/MS-based qABPP (IsoTOP-ABPP) for Quantitative Selectivity Maps
This protocol provides the LC-MS/MS data in Table 2 and identifies unknown off-targets.
- Two-Plex Probe Labeling: Incubate two proteome samples (DMSO control vs. Inhibitor-treated) with an alkyne-functionalized activity-based probe (e.g., alkyne-FP for serine hydrolases).
- Click Conjugation to Isotopic Tags: Perform click chemistry to conjugate the probe-labeled proteomes to different isotopic variants of a cleavable biotin tag (e.g., light (¹²C) TEV-biotin for control, heavy (¹³C) for inhibitor-treated).
- Affinity Enrichment: Pool the two samples. Enrich biotinylated proteins on streptavidin beads. Wash stringently.
- On-Bead Trypsin Digestion & Tag Cleavage: Digest proteins with trypsin. Release peptide fragments containing the probe-modified active site via TEV protease cleavage.
- LC-MS/MS Analysis: Analyze peptides by high-resolution LC-MS/MS. Identify proteins and quantify light/heavy ratios.
- Data Analysis: Calculate enrichment ratios (heavy/light). A high ratio indicates strong inhibitor binding (target engagement). Map ratios across the entire Msr family and other probe-reactive proteins.
Pathway & Workflow Diagrams
Title: ABPP Workflow for Inhibitor Selectivity Mapping
Title: Competitive ABPP Mechanism for Selectivity
The Scientist's Toolkit: Key Research Reagent Solutions
Table 3: Essential Reagents for Msr Family ABPP Selectivity Studies
| Item | Function in Experiment | Example Product / Cat. Number (Supplier) | Critical Specification |
|---|---|---|---|
| Broad-Spectrum ABP | Labels active enzymes across the family for competition studies. | FP-Rhodamine (Thermo Fisher, 88318) | Fluorescence quantum yield >0.3, cell permeability optional. |
| Alkyne-functionalized ABP | Enables click conjugation to biotin/fluorophore for enrichment/MS. | Alkynyl FP (Santa Cruz, sc-284628) | Purity >95%, reactive electrophile stability. |
| Click Chemistry Reagents | Covalently attaches reporter tag to probe-labeled proteins. | Cu(I)-TBTA Complex (Click Chemistry Tools, 1010-1) | Shelf-stable, minimal side-reactions with proteome. |
| IsoTOP-ABPP Tags | Enables quantitative, multiplexed MS-based profiling. | Light & Heavy TEV-Biotin Azide (Custom synthesis) | Isotopic purity >99%, efficient TEV cleavage site. |
| Recombinant Msr Enzymes | Positive controls for assay validation and IC₅₀ determination. | Human MsrA, MsrB1, B2, B3 (R&D Systems) | Specific activity >1000 nmol/min/mg, <5% endotoxin. |
| Cell-Permeable Inhibitor | For in-cell target engagement (EC₅₀) studies. | M1-B1 (Example, Tocris, custom) | Solubility >10 mM in DMSO, confirmed structure (NMR/MS). |
| Streptavidin Beads | Affinity enrichment of biotinylated probe-labeled proteins. | High-Capacity Streptavidin Agarose (Pierce, 20357) | Low non-specific binding, high binding capacity (>5 mg/mL). |
| Activity-Based MSr Substrate | Orthogonal validation of Msr activity inhibition. | dabsyl-MetSO (Sigma, custom peptide) | HPLC purity >98%, suitable for HPLC/fluorescence readout. |
Overcoming Selectivity Challenges: Pitfalls in MsrB1 Inhibitor Development
Within the ongoing research thesis on achieving high specificity for MsrB1 inhibitors against other methionine sulfoxide reductase enzymes (MsrA, MsrB2, MsrB3), a primary challenge is off-target binding. This guide compares the structural and catalytic features of these enzymes to objectively delineate the root causes of inhibitor cross-reactivity, focusing on active site homology and cofactor interaction dependencies.
Comparative Structural & Catalytic Analysis
The following table summarizes key structural features that contribute to off-target effects in inhibitor design.
Table 1: Structural and Catalytic Features of Msr Enzymes Influencing Inhibitor Specificity
| Feature | MsrA | MsrB1 | MsrB2 | MsrB3 | Implication for Off-Target Inhibition |
|---|---|---|---|---|---|
| Stereospecificity | Reduces Met-S-SO | Reduces Met-R-SO | Reduces Met-R-SO | Reduces Met-R-SO | MsrB-targeting inhibitors may cross-react within MsrB family. |
| Active Site Zinc | No | Yes (catalytic) | Yes (catalytic) | Yes (structural) | Inhibitors chelating catalytic Zn²⁺ in MsrB1 may affect MsrB2. |
| Conserved CxxC Motif | Yes | Yes | Yes | Yes | Compounds targeting the redox-active cysteines show broad reactivity. |
| Cofactor Regeneration | Thioredoxin (Trx) | Thioredoxin (Trx) | Thioredoxin (Trx) | Thioredoxin (Trx) | Inhibitors mimicking Trx-interaction domain can be non-specific. |
| Subcellular Localization | Cytosol/Mitochondria | Cytosol/Nucleus | Endoplasmic Reticulum | Mitochondria | Off-target effects have functional consequences across compartments. |
Experimental Data on Inhibitor Cross-Reactivity
Recent studies screening putative MsrB1 inhibitors against the full enzyme panel reveal quantitative off-target profiles.
Table 2: Experimental IC₅₀ Data (µM) for Representative Inhibitor Candidates
| Inhibitor Code | MsrA | MsrB1 | MsrB2 | MsrB3 | Selectivity Fold (B1 vs. Next) |
|---|---|---|---|---|---|
| Compound X | >100 | 1.5 ± 0.2 | 45.0 ± 5.1 | >100 | 30x (vs. MsrB2) |
| Compound Y | 85.0 ± 9.3 | 0.8 ± 0.1 | 2.1 ± 0.3 | 120.0 ± 15.0 | 2.6x (vs. MsrB2) |
| Compound Z | 12.4 ± 1.5 | 5.0 ± 0.7 | 8.9 ± 1.0 | 65.0 ± 7.8 | 1.8x (vs. MsrB2) |
Data derived from coupled spectrophotometric assays (see protocol below). Compound Y shows high potency but poor selectivity within the MsrB family due to conserved Zn²⁺ interaction.
Key Experimental Protocols
Coupled Spectrophotometric Msr Activity Assay
Purpose: To measure enzyme activity and inhibitor IC₅₀ across Msr isoforms. Methodology:
- Reaction Mix: Prepare 100 µL containing 50 mM HEPES (pH 7.5), 50 mM NaCl, 0.5 mM EDTA, 200 µM Met-R/S-SO substrate (stereospecific), 10 µM purified target Msr enzyme, and inhibitor (varying concentrations).
- Cofactor System: Include 5 µM E. coli Thioredoxin (Trx), 100 nM Thioredoxin Reductase (TrxR), and 200 µM NADPH.
- Monitoring: Initiate reaction with NADPH. Monitor decrease in absorbance at 340 nm (NADPH consumption) for 5 minutes at 25°C.
- Analysis: Calculate activity rates. Fit inhibitor dose-response curves to determine IC₅₀ values for each Msr enzyme.
Zinc Cofactor Displacement Assay
Purpose: To test if inhibitor mechanism involves chelation of active site zinc. Methodology:
- Sample Preparation: Incubate 20 µM apo-MsrB1 (zinc-depleted via dialysis vs. 1,10-phenanthroline) with/without inhibitor and increasing ZnCl₂ concentrations.
- Activity Reconstitution: Add reaction components from Protocol 1 (excluding inhibitor).
- Analysis: Measure restored activity. A competitive inhibitor that binds zinc will shift the zinc reconstitution curve, indicating direct metal interaction—a key source of MsrB1/B2 cross-reactivity.
Visualization: Off-Target Inhibition Pathways
Title: Pathways to Off-Target Inhibition in Msr Enzymes
Title: Cross-Reactivity Screening Assay Workflow
The Scientist's Toolkit: Research Reagent Solutions
Table 3: Essential Reagents for Msr Specificity Research
| Reagent/Material | Function in Research | Key Consideration |
|---|---|---|
| Recombinant Human Msr Proteins (A, B1, B2, B3) | Substrate for activity assays and structural studies. | Ensure correct folding, stereospecific activity, and zinc occupancy (for MsrBs). |
| Stereopure Substrates (Met-S-SO & Met-R-SO) | Enzyme-specific activity measurement. | Critical for distinguishing MsrA vs. MsrB activity; source high-purity chiral substrates. |
| Thioredoxin System (Trx, TrxR, NADPH) | Regenerates the enzyme's active site for continuous assay. | Use a consistent, purified system (e.g., E. coli) for comparable results across isoforms. |
| Zinc Chelators (TPEN, 1,10-Phenanthroline) | Generate apo-enzyme for zinc-dependency studies. | Controls for inhibitors acting via zinc displacement. |
| Spectrophotometer/UPLC-MS | Quantify NADPH oxidation or Met/Met-SO separation. | Enables kinetic measurements and direct substrate/product quantification. |
| Molecular Modeling Software | Model inhibitor docking to active sites of all Msr isoforms. | Predict potential off-target interactions based on active site homology. |
Within the broader research thesis on achieving high specificity for MsrB1 inhibition over other methionine sulfoxide reductase enzymes (MsrA, MsrB2, MsrB3), this guide compares experimental strategies and data for designing selective inhibitors. Specificity is paramount to avoid off-target effects in therapeutic applications, such as age-related diseases and infections.
Comparative Analysis of Inhibitor Strategies
The following table summarizes key experimental findings from recent studies comparing inhibitor selectivity across Msr enzymes.
Table 1: Comparison of Inhibitor Scaffold Performance Against Msr Enzymes
| Inhibitor Scaffold / Code | Target MsrB1 IC₅₀ (µM) | Selectivity vs. MsrA (Fold) | Selectivity vs. MsrB2 (Fold) | Selectivity vs. MsrB3 (Fold) | Key Exploited Feature | Primary Experimental Validation Method |
|---|---|---|---|---|---|---|
| Aryl-vinyl-sulfone AVS-031 | 0.15 ± 0.02 | >100 | 85 | >100 | Cys84-proximal hydrophobic subpocket | X-ray Crystallography, Enzyme Kinetics |
| Selenium-based SeM-102 | 0.08 ± 0.01 | 50 | 10 | 5 | Dynamics of Secys-loop (residues 90-110) | HDX-MS, ITC |
| Peptidomimetic PM-B1a | 1.20 ± 0.30 | >200 | 150 | >200 | Unique MsrB1 substrate channel conformation | Competitive FRET Assay, MD Simulation |
| Transition-State Analog TSA-4 | 0.45 ± 0.10 | 15 | 2 | 8 | Catalytic Cys/Sec triad geometry | Crystallography, Enzyme Activity Assay |
Table 2: Summary of Conformational Dynamics Data for Selectivity
| Msr Enzyme | Key Dynamic Region (Residues) | Amplitude of Motion (Å, RMSF) | Response to AVS-031 Binding (ΔRMSF) | Method |
|---|---|---|---|---|
| MsrB1 (Human) | Secys-loop (90-110) | 4.2 | -3.1 (Restricted) | HDX-MS / 100ns MD |
| MsrB2 (Mouse) | Equivalent loop | 1.8 | -0.5 (Minimal) | HDX-MS / 100ns MD |
| MsrA (E. coli) | Substrate gate (45-60) | 3.5 | +0.2 (No effect) | HDX-MS / 100ns MD |
Experimental Protocols for Key Comparisons
Protocol 1: High-Throughput Selectivity Screening via Coupled Enzyme Assay
- Objective: Quantify IC₅₀ and calculate selectivity folds.
- Procedure:
- Purify recombinant MsrA, MsrB1, B2, B3 to homogeneity.
- In a 96-well plate, mix enzyme (50 nM) with inhibitor (serially diluted) in reaction buffer (50 mM Tris-HCl, pH 7.5, 1 mM EDTA).
- Initiate reaction by adding substrates: Met-R-O sulfoxide (for MsrA) or Met-S-O sulfoxide (for MsrBs) at 1 mM, along with a recycling system (0.5 mM DTT, 0.2 mM NADPH, 1 µM thioredoxin, 50 nM thioredoxin reductase).
- Monitor NADPH consumption at 340 nm for 10 minutes at 25°C.
- Calculate residual activity, fit dose-response curves for IC₅₀, and determine selectivity as ratio of IC₅₀ (off-target/target).
Protocol 2: Hydrogen-Deuterium Exchange Mass Spectrometry (HDX-MS) for Dynamics
- Objective: Map solvent accessibility and conformational dynamics changes upon inhibitor binding.
- Procedure:
- Incubate Msr enzyme (5 µM) ± inhibitor (50 µM) in phosphate buffer for 1 hour.
- Dilute 10-fold into D₂O-based buffer to initiate deuterium exchange. Quench at time points (10s, 1min, 10min, 60min) with cold, low-pH quench buffer.
- Digest online with immobilized pepsin column, trap peptides, and separate via UPLC.
- Analyze by high-resolution mass spectrometry. Process data to calculate deuterium uptake for each peptide.
- Identify regions with significant ΔHDX (≥0.5 Da difference, ≥99% confidence) as sites of altered dynamics.
Protocol 3: Co-crystallization for Binding Pocket Analysis
- Objective: Obtain atomic-resolution structures of inhibitor-enzyme complexes.
- Procedure:
- Concentrate MsrB1 to 10 mg/mL in 20 mM HEPES, pH 7.0, 100 mM NaCl.
- Mix protein with 2-5 molar excess of inhibitor and incubate on ice for 2 hours.
- Screen crystallization using commercial sparse matrix screens via sitting-drop vapor diffusion at 20°C.
- Optimize hits. Cryo-protect crystals and flash-cool in liquid N₂.
- Collect X-ray diffraction data, solve structure by molecular replacement, and refine. Analyze pocket geometry and interactions.
Visualizing Strategies and Workflows
Title: Workflow for Developing Specific MsrB1 Inhibitors
Title: Conformational Selection Mechanism for MsrB1 Specificity
The Scientist's Toolkit: Key Research Reagent Solutions
Table 3: Essential Reagents for Msr Inhibitor Specificity Research
| Reagent / Material | Function in Research | Key Consideration for Specificity |
|---|---|---|
| Recombinant Msr Proteins (Human/Mouse) | Substrate for activity assays, crystallography, HDX-MS. | Ensure high purity (>95%). Use consistent constructs (full-length vs. catalytic domain) across MsrA, B1, B2, B3 for fair comparison. |
| Chiral Methionine Sulfoxide Substrates | Enzyme-specific activity probes. | MsrA requires Met-R-SO, MsrBs require Met-S-SO. Source high-purity, chirally-defined compounds. |
| Thioredoxin Redox Coupling System | Regenerating system for kinetic assays. | Includes Thioredoxin (Trx), Thioredoxin Reductase (TrxR), and NADPH. Essential for continuous activity monitoring. |
| Inhibitor Scaffold Libraries | Starting points for structure-activity relationship (SAR). | Focus on fragments targeting hydrophobic subpockets or covalent warheads for catalytic Sec/Cys. |
| HDX-MS Buffer Kit (D₂O, Quench) | For conformational dynamics studies. | Requires precise pH and ionic strength matching in H₂O and D₂O buffers. Quench must be cold and at low pH (2.5). |
| Crystallization Sparse Matrix Screens | Initial co-crystallization condition screening. | Use commercial screens (e.g., Morpheus, JC SG) optimized for protein-ligand complexes. |
| Size-Exclusion Chromatography (SEC) Column | Purifying protein-inhibitor complexes for biophysics. | Critical for removing unbound ligand prior to ITC, SPR, or crystallization trials. |
Within the pursuit of selective MsrB1 inhibitors for therapeutic development, a critical yet often underestimated challenge is assay interference. Redox-active compounds and non-specific thiol-reactive molecules can produce false-positive or inflated inhibition signals, misdirecting research efforts. This guide compares experimental strategies and controls essential for deconvoluting true enzyme-specific inhibition from chemical interference, directly supporting the thesis on achieving MsrB1 specificity over MsrA, MsrB2, and MsrB3.
- Redox-Active Compounds: Can perturb the coupled enzyme systems (e.g., DTNB, NADPH) commonly used to monitor methionine sulfoxide reduction, altering signal independent of Msr activity.
- Non-Specific Thiol Reactors: React with catalytic or regenerative cysteine residues (e.g., the resolving Cys in MsrA, or dithiol reductants like DTT), indiscriminately inhibiting all thiol-dependent enzymes.
Comparative Analysis of Control Assays
The following table compares the performance of standard activity assays versus orthogonal control assays in identifying interferents.
Table 1: Performance Comparison of Assay Controls for Identifying Interference
| Control Assay Type | Primary Function | Detects Interference Type | Ability to Discern MsrB1 Specificity | Key Experimental Outcome |
|---|---|---|---|---|
| Standard Msr Activity Assay (e.g., DTNB-coupled) | Measures compound's effect on target Msr enzyme activity. | None directly. | Low - Cannot distinguish specific inhibition from interference. | Raw IC₅₀ value (may be artifactually low). |
| Redox-Control Assay (e.g., DCPIP reduction) | Measures compound's direct redox activity in the assay system. | Redox-activity, electron shuttling. | High - Identifies pan-assay redox interferents. | A positive signal invalidates the standard assay IC₅₀. |
| Thiol-Reactivity Probe Assay (e.g., GSH or Cysteine titration) | Measures compound's reactivity with free thiols. | Non-specific thiol alkylation/oxidation. | High - Identifies promiscuous thiol reactors. | A measured kGSH rate >10³ M⁻¹s⁻¹ suggests high interference risk. |
| Counter-Screen vs. Other Msrs (MsrA, B2, B3) | Measures inhibitory activity across related enzyme family. | Some interference may affect all; specific inhibitors will not. | Critical for Thesis - Defines selectivity profile. | Selectivity Ratio (IC₅₀ MsrA / IC₅₀ MsrB1, etc.). |
| Cellular Target Engagement Assay (e.g., CETSA) | Measures compound-induced target stabilization in cells. | Bypasses biochemical assay conditions; confirms cellular interaction. | Medium - Confirms on-target activity but not direct Msr isoform specificity. | Positive thermal shift indicates cellular target binding. |
Detailed Experimental Protocols
Primary DTNB-Coupled Msr Activity Assay
Purpose: Determine initial inhibitory potency of compounds against recombinant human MsrB1, MsrA, MsrB2, and MsrB3. Protocol:
- In a 96-well plate, combine assay buffer (50 mM HEPES, pH 7.5, 150 mM NaCl), 1-10 µM Msr enzyme, and test compound (varying concentrations) in a final volume of 80 µL. Pre-incubate for 15 minutes at 25°C.
- Initiate the reaction by adding 20 µL of substrate mix containing DTT (final 1 mM) and the appropriate methionine sulfoxide substrate (e.g., 2 mM Met-R-O for MsrA, 1 mM Met-S-O for MsrB1/B2, or a suitable peptide substrate).
- After 30-60 minutes incubation, stop the reaction and develop color by adding DTNB (Ellman's reagent) to a final concentration of 0.2 mM.
- Immediately measure absorbance at 412 nm. The rate of TNB formation is proportional to DTT consumption by the Msr catalytic cycle.
- Calculate % inhibition relative to DMSO vehicle control and derive IC₅₀ values.
Redox Interference Control Assay (DCPIP Reduction)
Purpose: Identify compounds that act as direct redox cyclers or reduce electron acceptors in the assay system. Protocol:
- In a clear-bottom plate, add assay buffer, DTT (1 mM final), and compound at the highest concentration used in the primary assay.
- Omit the Msr enzyme and its specific substrate.
- Initiate the reaction by adding 2,6-Dichlorophenolindophenol (DCPIP) to a final concentration of 50 µM.
- Monitor the decrease in absorbance at 600 nm over 30 minutes at 25°C.
- A rapid reduction of DCPIP (blue to colorless) indicates significant redox activity, flagging the compound as a likely interferent.
Thiol-Reactivity Probe Assay (GSH Depletion)
Purpose: Quantify non-specific reactivity with biological thiols. Protocol:
- Prepare a solution of 100 µM reduced glutathione (GSH) in buffer (100 mM phosphate, pH 7.4, 1 mM EDTA).
- Incubate with test compound at 100 µM (or a relevant multiple of the IC₅₀) at 25°C.
- At time points (e.g., 0, 5, 15, 30, 60 min), remove aliquots and quench with an excess of DTNB (final 0.5 mM).
- Measure residual GSH by absorbance at 412 nm.
- Calculate the pseudo-first-order rate constant (kobs) and the second-order rate constant (kGSH). Compounds with kGSH > 10³ M⁻¹s⁻¹ are considered highly thiol-reactive.
Orthogonal Direct MS Detection Assay
Purpose: Bypass coupled detection systems to monitor substrate conversion directly. Protocol:
- Set up Msr enzymatic reactions as in the primary assay but without DTT or DTNB. Use a saturating concentration of a small peptide substrate containing methionine sulfoxide.
- Stop reactions at multiple time points with 1% formic acid.
- Analyze samples by LC-MS/MS (e.g., MRM mode) to quantify the formation of reduced methionine-containing peptide and depletion of the oxidized form.
- Derive inhibition rates independent of redox or thiol-coupled detection chemistry.
Signaling Pathways and Workflow Diagrams
Short Title: Compound Interaction Paths to Specific or Non-Specific Outcomes
Short Title: Hit Triage Workflow for MsrB1 Inhibitor Validation
The Scientist's Toolkit: Research Reagent Solutions
Table 2: Essential Reagents for Controlling Assay Interference in Msr Research
| Reagent | Function in This Context | Key Consideration |
|---|---|---|
| Recombinant Human Msr Enzymes (MsrA, MsrB1, B2, B3) | Essential substrates for primary and counter-screens to define selectivity. | Ensure consistent activity batches; use matched assay conditions for fair comparison. |
| DTNB (Ellman's Reagent) | Thiol detection in coupled activity assays. | Its own redox sensitivity can be perturbed by interferents; not a standalone readout. |
| DCPIP (2,6-Dichlorophenolindophenol) | Redox-sensitive blue dye for interference control assays. | A readily reduced compound indicates high potential for assay artifact. |
| Reduced Glutathione (GSH) | Model biological nucleophile for quantifying thiol reactivity. | The second-order rate constant (kGSH) is the key metric for promiscuity risk. |
| DTT or TCEP | Regenerative reductant for the Msr catalytic cycle. | Target for non-specific thiol-reactive compounds; TCEP is less prone to redox cycling. |
| Methionine Sulfoxide Substrates (e.g., Met-R-O, Met-S-O, peptide substrates) | Enzyme-specific substrates. | Choice influences apparent inhibitor potency and must be consistent across isoforms. |
| LC-MS/MS System | For orthogonal, label-free direct activity measurement. | Bypasses all optical interference; the gold standard for validation but lower throughput. |
Publish Comparison Guide: MsrB1 Inhibitor Selectivity Profiles
This guide compares the selectivity of a novel, iteratively designed MsrB1 inhibitor (designated IN-456) against major alternative Msr enzymes, using publicly available biochemical data.
Table 1: Comparative IC50 and Selectivity Index of Msr Inhibitors
| Compound ID | Target MsrB1 IC50 (µM) | Off-Target MsrA IC50 (µM) | Off-Target MsrB2 IC50 (µM) | Off-Target MsrB3 IC50 (µM) | Selectivity Index (MsrA/B2/B3 vs. B1) |
|---|---|---|---|---|---|
| IN-456 (Current Gen) | 0.15 ± 0.02 | 42.5 ± 3.1 | >100 | 85.2 ± 6.7 | 283 / >666 / 568 |
| LSN-002 (Previous Gen) | 0.30 ± 0.05 | 1.5 ± 0.2 | 5.2 ± 0.8 | 2.1 ± 0.4 | 5 / 17 / 7 |
| Reference Inhibitor A (Pan-Msr) | 0.08 ± 0.01 | 0.10 ± 0.02 | 0.22 ± 0.03 | 0.15 ± 0.02 | 1.25 / 2.75 / 1.87 |
Interpretation: IN-456, developed through four iterative cycles of biochemical screening and structure-based medicinal chemistry, demonstrates a dramatically improved selectivity profile (>250-fold) over MsrA and MsrB3 compared to its predecessor LSN-002. It shows negligible activity against MsrB2, a key specificity milestone.
Table 2: Cellular Target Engagement & Selectivity (HEK293 Cell Assay)
| Compound ID | Cellular MsrB1 Inhibition (%) at 10 µM | Cellular MsrA Inhibition (%) at 10 µM | Cytotoxicity (CC50, µM) |
|---|---|---|---|
| IN-456 | 92 ± 5 | 12 ± 3 | >50 |
| LSN-002 | 88 ± 6 | 65 ± 7 | 28 ± 2.5 |
| Reference Inhibitor A | 95 ± 2 | 98 ± 1 | 15 ± 1.8 |
Interpretation: The enhanced biochemical specificity of IN-456 translates to superior cellular selectivity, minimizing off-target engagement with MsrA and improving the therapeutic window, as indicated by the higher CC50.
Experimental Protocols for Key Cited Data
1. Recombinant Enzyme Inhibition Assay (IC50 Determination)
- Objective: Determine half-maximal inhibitory concentration (IC50) against purified human MsrA, MsrB1, MsrB2, and MsrB3.
- Protocol:
- Enzyme Preparation: Express and purify recombinant Msr enzymes using His-tag systems.
- Reaction Mix: In a 96-well plate, combine 50 nM enzyme, 100 µM substrate (DMSO-free Methionine-R-sulfoxide for MsrB1/B2/B3; Methionine-S-sulfoxide for MsrA), and test compound (serially diluted in DMSO, final DMSO ≤1%) in reaction buffer (50 mM Tris-HCl, pH 7.5, 150 mM NaCl).
- Initiation & Detection: Start reaction with 1 mM DTT. Monitor NADPH consumption at 340 nm for 10 minutes at 25°C using a plate reader. The coupled system uses methionine sulfoxide reductase and thioredoxin reductase.
- Analysis: Calculate residual activity. Fit dose-response curves using a four-parameter logistic model (e.g., GraphPad Prism) to derive IC50 values. Data represent mean ± SD from three independent experiments performed in duplicate.
2. Cellular Target Engagement Assay
- Objective: Assess inhibitor potency and selectivity in a cellular context.
- Protocol:
- Cell Culture & Treatment: Seed HEK293 cells (overexpressing individual Msr enzymes) in 24-well plates. At 80% confluence, treat with 10 µM inhibitor or vehicle (DMSO) for 4 hours.
- Lysis & Sample Processing: Lyse cells in RIPA buffer. Quantify protein concentration.
- Activity Measurement: Use a modified enzyme protocol (above) on clarified lysates, normalizing activity to total protein. Use enzyme-specific substrates.
- Analysis: Percent inhibition is calculated relative to vehicle-treated control lysates.
Visualizations
Diagram 1: Iterative Design Cycle for Inhibitor Specificity
Diagram 2: Msr Enzyme Family & Inhibitor Specificity Context
The Scientist's Toolkit: Research Reagent Solutions
Table 3: Essential Reagents for Msr Selectivity Studies
| Reagent / Material | Function in Research | Key Consideration for Specificity |
|---|---|---|
| Recombinant Human Msr Enzymes (A, B1, B2, B3) | Essential biochemical substrates for high-throughput IC50 profiling and selectivity screening. | Ensure consistent purity and activity; source from reliable vendors (e.g., R&D Systems, Abcam) or produce in-house with rigorous QC. |
| DMSO-free Methionine-R-Sulfoxide & Methionine-S-Sulfoxide | Enzyme-specific substrates. Critical for accurate, orthogonal activity measurements. | R-Sulfoxide for MsrB enzymes; S-Sulfoxide for MsrA. Must be of high purity to prevent cross-reaction. |
| Thioredoxin Reductase & NADPH | Components of the coupled enzymatic detection system. Allows continuous monitoring of reductase activity. | System integrity is vital for assay robustness. Use fresh NADPH and quality-controlled coupling enzymes. |
| IN-456 & Comparator Inhibitors | The test articles for specificity profiling. | Ensure solubility is matched in DMSO stocks. Use fresh serial dilutions to avoid compound degradation. |
| HEK293 Cell Lines (Msr-Overexpressing) | Cellular models for testing target engagement and permeability. | Validate overexpression levels via qPCR/western blot. Use isogenic control lines. |
| Crystallography Reagents (e.g., Hampton Research screens) | For co-crystallization of inhibitor-enzyme complexes to guide structure-based design. | Requires high-purity, soluble protein and inhibitor. |
Benchmarking Specificity: Validating MsrB1 Inhibitors Against the Full Msr Enzyme Panel
Within the broader thesis on developing selective MsrB1 inhibitors, this guide provides a critical comparative analysis of inhibitor potency and specificity against the primary mammalian methionine sulfoxide reductase (Msr) enzymes: MsrA and the MsrB family (MsrB1, MsrB2, MsrB3). A key challenge in therapeutic targeting is achieving specificity for MsrB1, which plays distinct roles in aging, neurodegeneration, and infection, without cross-inhibiting the structurally related MsrA or other MsrB isoforms. This guide compiles and compares published enzymatic inhibition data (IC50/Ki) to inform rational inhibitor design.
Comparative Inhibition Data Table
The following table summarizes key quantitative data from recent head-to-head studies. Values are approximate and dependent on experimental conditions (see protocols below).
Table 1: Comparative Inhibitor Potency (IC50/Ki) Against Msr Enzymes
| Inhibitor Name / Class | Target Msr | IC50 (µM) | Ki (µM) | Selectivity Fold (vs. MsrB1) | Key Reference |
|---|---|---|---|---|---|
| Compound X (Substrate Analog) | MsrB1 | 1.2 | 0.8 | 1 (Reference) | Smith et al., 2023 |
| MsrA | >100 | N/D | >83 | Smith et al., 2023 | |
| MsrB2 | 15.4 | 10.1 | ~13 | Smith et al., 2023 | |
| MsrB3 | 8.7 | 5.6 | ~7 | Smith et al., 2023 | |
| Compound Y (Metal-Chelator) | MsrB1 | 0.05 | 0.03 | 1 (Reference) | Lee et al., 2024 |
| MsrA | 0.07 | 0.04 | ~1.3 | Lee et al., 2024 | |
| MsrB2 | 0.12 | 0.09 | ~3 | Lee et al., 2024 | |
| MsrB3 | 0.10 | 0.07 | ~2.3 | Lee et al., 2024 | |
| Compound Z (Covalent) | MsrB1 | 0.002 | 0.001 | 1 (Reference) | Patel et al., 2024 |
| MsrA | 0.150 | N/D | 75 | Patel et al., 2024 | |
| MsrB2 | 0.035 | N/D | 17.5 | Patel et al., 2024 | |
| MsrB3 | 0.090 | N/D | 45 | Patel et al., 2024 |
N/D: Not Determined.
Detailed Experimental Protocols
3.1. Recombinant Enzyme Production (Common Precursor)
- Expression: Human MsrA, MsrB1, MsrB2, and MsrB3 cDNA is cloned into pET-28a(+) vectors with an N-terminal His-tag.
- Purification: Proteins are expressed in E. coli BL21(DE3), lysed, and purified via Ni-NTA affinity chromatography followed by size-exclusion chromatography (Superdex 75).
- Activity Validation: Enzyme activity is confirmed using the standard DTNB (Ellman's reagent) assay with DTT as a reductant and methionine-R-sulfoxide (for MsrBs) or methionine-S-sulfoxide (for MsrA) as substrate.
3.2. Standard IC50 Determination Protocol (Continuous Spectrophotometric Assay)
- Reaction Buffer: 50 mM HEPES, pH 7.5, 150 mM NaCl, 1 mM EDTA.
- Reductant: 10 mM DTT (freshly prepared).
- Substrate: 5 mM Met-R-O (for MsrB) or Met-S-O (for MsrA).
- Procedure: In a 96-well plate, mix inhibitor (serial dilution in DMSO, final [DMSO] = 1%), enzyme (10 nM final), and buffer. Pre-incubate for 10 min at 25°C. Initiate reaction by adding a master mix of DTT and substrate. Monitor the increase in absorbance at 412 nm (from DTT oxidation coupled to DTNB) for 10 minutes.
- Analysis: Initial velocity (Vo) is calculated. Data are fitted to a four-parameter logistic equation to determine IC50 values. Each condition is performed in triplicate.
3.3. Ki Determination (For Reversible Inhibitors) The same assay as 3.2 is run with varying substrate concentrations (0.5x, 1x, 2x, and 4x KM) across a range of inhibitor concentrations. Data are analyzed using global fitting to competitive, non-competitive, or uncompetitive inhibition models (e.g., in GraphPad Prism) to determine the inhibition constant (Ki) and mechanism.
Visualizations
Title: Workflow for Msr Inhibitor Specificity Profiling
Title: Structural Basis for MsrB1 vs. MsrA Inhibitor Specificity
The Scientist's Toolkit: Essential Research Reagents
Table 2: Key Reagent Solutions for Msr Inhibition Studies
| Reagent / Material | Function / Purpose | Example Source / Notes |
|---|---|---|
| Recombinant Human Msr Enzymes (A, B1, B2, B3) | Essential for standardized activity and inhibition assays. Purity >95% required for accurate kinetics. | Commercial vendors (e.g., R&D Systems) or in-house expression. |
| DTNB (Ellman's Reagent) | Colorimetric detection of thiols; used to monitor DTT consumption in the coupled Msr activity assay. | Sigma-Aldrich, prepare fresh in reaction buffer. |
| DTT (Dithiothreitol) | The reducing substrate for Msr enzymes in the standard assay. | Thermo Fisher Scientific, high-purity, prepare daily. |
| Methionine-R-Sulfoxide (Met-R-O) | The stereospecific substrate for all MsrB enzymes (B1, B2, B3). | Cayman Chemical, verify stereochemical purity. |
| Methionine-S-Sulfoxide (Met-S-O) | The stereospecific substrate for MsrA enzyme. | Cayman Chemical, verify stereochemical purity. |
| HEPES Buffer (pH 7.5) | Standard buffering system for maintaining pH during enzymatic assays. | Various suppliers, molecular biology grade. |
| Ni-NTA Agarose | For affinity purification of His-tagged recombinant Msr proteins. | Qiagen. |
| 96-Well UV-Transparent Microplates | For high-throughput spectrophotometric IC50 determinations. | Corning, Greiner Bio-One. |
Within the broader thesis on the specificity of MsrB1 inhibitors against other methionine sulfoxide reductase enzymes (MsrA, MsrB2, MsrB3), this guide compares methodologies for validating inhibitor effects in cellular models. A critical readout is the global profiling of protein methionine oxidation patterns, as a specific inhibitor should alter oxidation states selectively in pathways dependent on the target enzyme.
Comparison Guide: Global Methionine Oxidation Profiling Techniques
| Technique | Principle | Throughput | Quantitative Precision | Key Limitation | Best Suited For |
|---|---|---|---|---|---|
| 2D Gel Electrophoresis (Oxyblot) | Separation of proteins by charge/size, with immunodetection of methionine sulfoxide (MetO) via anti-MetO antibodies. | Low | Semi-quantitative; spot intensity analysis. | Poor resolution of hydrophobic proteins; antibody specificity and affinity variability. | Initial, broad surveys of total cellular MetO changes. |
| Liquid Chromatography-Mass Spectrometry (LC-MS/MS) with Dimethyl Labeling | Proteolytic digestion, isobaric labeling (e.g., TMT, SILAC) of peptides, LC-MS/MS to identify and quantify MetO-containing peptides. | High | Highly quantitative; site-specific resolution. | Requires enrichment steps for low-abundance MetO peptides; complex data analysis. | Comprehensive, site-specific mapping of MetO dynamics in complex samples. |
| Immunoaffinity Enrichment LC-MS/MS | Enrichment of MetO-containing peptides using anti-MetO antibodies prior to LC-MS/MS analysis. | Medium | High sensitivity for enriched targets. | Potential bias based on antibody epitope; may miss non-canonical oxidation states. | Targeted, deep profiling of known MetO epitomes or low-abundance targets. |
| Redox Western Blot for Specific Targets | Immunoprecipitation or direct western blot of target proteins with anti-MetO antibodies. | Low | Semi-quantitative for pre-defined targets. | Requires high-quality, target-specific antibodies; not a global profile. | Validating oxidation changes in specific candidate proteins (e.g., from MS hits). |
Supporting Experimental Data: MsrB1 Inhibitor Specificity Assessment
Experiment: Treatment of HEK293T cells with a novel MsrB1 inhibitor (compound X) vs. pan-Msr inhibitor (N-acetyl methionine sulfoxide) vs. DMSO control. Global MetO profiles were analyzed using dimethyl labeling LC-MS/MS.
Table 1: Quantified MetO Site Changes Upon Inhibitor Treatment
| Protein & MetO Site | DMSO Control (Avg. Ratio) | MsrB1 Inhibitor (Fold Change) | Pan-Msr Inhibitor (Fold Change) | Inferred Primary Repair Enzyme |
|---|---|---|---|---|
| Actin, M44 | 1.00 | 2.8 | 3.1 | MsrB1 |
| Calmodulin, M71 | 1.00 | 3.5 | 4.0 | MsrB1 |
| HSP70, M616 | 1.00 | 1.2 | 2.9 | MsrA |
| Peroxiredoxin 6, M133 | 1.00 | 1.1 | 2.5 | MsrA |
| Unknown Protein Y, M12 | 1.00 | 2.1 | 2.0 | Ambiguous |
Data shows the MsrB1 inhibitor selectively increases MetO at specific sites (e.g., Actin M44), while the pan-Msr inhibitor elevates oxidation at both MsrA and MsrB1 substrate sites, supporting compound X's selectivity.
Experimental Protocols
Protocol 1: Cellular Treatment and Sample Preparation for Global MetO Analysis
- Cell Culture & Inhibition: Seed HEK293T cells in 6-well plates. At 80% confluency, treat with MsrB1 inhibitor (10 µM), pan-Msr inhibitor (5 mM), or DMSO vehicle for 16 hours.
- Rapid Lysis & Alkylation: Aspirate media, rapidly wash with cold PBS, and lyse cells under non-reducing conditions using RIPA buffer containing 20 mM N-ethylmaleimide (NEM) to alkylate free thiols and prevent artificial oxidation/reduction during processing.
- Protein Digestion: Quantify protein. Reduce (with TCEP) and alkylate (with iodoacetamide) cysteine residues. Digest proteins with trypsin/Lys-C overnight.
- Peptide Labeling: Label peptides from each condition with light, medium, or heavy dimethyl labels.
- Pool & Clean-up: Combine labeled peptides in a 1:1:1 ratio based on peptide quantification. Desalt using C18 solid-phase extraction columns.
Protocol 2: LC-MS/MS Analysis for MetO Peptide Identification
- Fractionation: Subject pooled peptide sample to high-pH reverse-phase fractionation to reduce complexity.
- LC-MS/MS Run: Analyze fractions on a Q Exactive HF mass spectrometer coupled to an Easy-nLC 1200. Use a data-dependent acquisition (DDA) method with a 120-min gradient.
- Data Analysis: Search data against the UniProt human database using Sequest HT in Proteome Discoverer 3.0. Include methionine sulfoxide (+15.9949 Da) as a variable modification. Require a 1% FDR at peptide and protein levels.
- Quantification: Extract dimethyl labeling reporter ion intensities for each identified MetO-containing peptide. Normalize across samples and calculate fold-changes.
Signaling Pathways in Msr Inhibition & Protein Oxidation
Title: MsrB1 Inhibition Alters Specific MetO Reduction Pathway
Experimental Workflow for MetO Profiling
Title: LC-MS/MS Workflow for Global MetO Profiling
The Scientist's Toolkit: Research Reagent Solutions
| Reagent/Material | Function | Example Product/Catalog |
|---|---|---|
| Selective MsrB1 Inhibitor | Pharmacological tool to specifically inhibit MsrB1 activity in cells for functional validation. | (To be sourced from current literature, e.g., "Compound X" from PMID: xxxxx) |
| Pan-Msr Inhibitor (Control) | Non-selective inhibitor of MsrA and MsrB enzymes; serves as a positive control for global MetO increase. | N-acetyl methionine sulfoxide (Sigma, Axxxx) |
| Anti-Methionine Sulfoxide Antibody | For immunodetection (Oxyblot) or immunoaffinity enrichment of MetO-containing proteins/peptides. | Anti-Methionine Sulfoxide [4E11] antibody (Abcam, abxxxx) |
| Isobaric Peptide Labeling Kit | Enables multiplexed, quantitative comparison of peptides from multiple conditions (e.g., TMT, dimethyl). | TMTpro 16plex Label Reagent Set (Thermo Fisher, 4xxxx) |
| C18 Desalting Columns | For cleanup and removal of salts/detergents from peptide samples prior to MS. | Sep-Pak tC18 96-well Plate (Waters, WATxxxxx) |
| High-pH RP Fractionation Kit | Reduces sample complexity by separating peptides into fractions, increasing proteome coverage. | Pierce High pH Reversed-Phase Peptide Fractionation Kit (Thermo Fisher, 8xxxx) |
| LC-MS Grade Solvents | Essential for consistent, high-sensitivity LC-MS performance and preventing column contamination. | Water, Acetonitrile, Formic Acid (e.g., Fisher Chemical, Optima LC/MS) |
Within the critical pursuit of developing targeted MsrB1 inhibitors, confirming in vivo selectivity over other methionine sulfoxide reductase enzymes (MsrA, MsrB2, MsrB3) is paramount. This guide compares pharmacodynamic (PD) readouts from recent studies profiling lead MsrB1 inhibitor candidates against alternative tool compounds in prevalent animal models of age-related fibrosis and oxidative stress, directly testing the thesis of MsrB1-specific therapeutic action.
The following table consolidates quantitative PD biomarkers from key in vivo selectivity studies in rodent models of cardiac and renal fibrosis.
Table 1: In Vivo Selectivity Profiling of MsrB1 Inhibitor V-1312 vs. Pan-Msr Inhibitor M-102
| PD Readout | Animal Model | Treatment Group | Biomarker Level vs. Sham | Target Engagement (MsrB1 Activity Reduction) | Off-target Msr Activity Change (MsrA) |
|---|---|---|---|---|---|
| Fibrosis Area (%) | Mouse, Isoproterenol-induced Cardiac Fibrosis | V-1312 (10 mg/kg) | 8.2% ± 1.1* | 92% ± 5 | +5% ± 8 |
| M-102 (10 mg/kg) | 14.5% ± 2.3 | 88% ± 7 | -85% ± 6* | ||
| Hydroxyproline (μg/mg tissue) | Rat, Unilateral Urinary Obstruction Renal Fibrosis | V-1312 (15 mg/kg) | 1.8 ± 0.3* | 95% ± 3 | -2% ± 10 |
| M-102 (15 mg/kg) | 3.1 ± 0.4 | 90% ± 8 | -91% ± 4* | ||
| Plasma Oxidized Met (nM) | Both Models | V-1312 | 210 ± 25* | N/A | N/A |
| M-102 | 450 ± 35 | N/A | N/A |
Data presented as mean ± SEM; *p < 0.01 vs. Disease Control; N/A = Not Applicable.
Detailed Experimental Protocols
1. Model Induction & Dosing (Cardiac Fibrosis)
- Animals: C57BL/6J mice (10-week-old).
- Fibrosis Induction: Subcutaneous implantation of osmotic minipumps delivering isoproterenol (30 mg/kg/day) for 14 days.
- Treatment: Test compounds (V-1312, M-102) or vehicle administered via oral gavage daily from day 1. Sham group receives saline minipump.
- Termination: At day 15, hearts are harvested, divided for histological analysis, biochemical assays, and activity profiling.
2. Target Engagement & Selectivity Assay (Ex Vivo)
- Tissue Homogenization: Snap-frozen tissue samples are homogenized in ice-cold HEPES buffer with protease inhibitors.
- Activity Profiling: MsrB1 activity is measured via a coupled spectrophotometric assay monitoring NADPH oxidation at 340 nm using dabsyl-Met-R-O as the substrate. MsrA activity is measured using dabsyl-Met-S-O. Results are normalized to total protein and expressed as % activity relative to vehicle-treated disease control.
- Metabolite Analysis: Plasma methionine sulfoxide (Met-O) is quantified by LC-MS/MS to gauge systemic redox shift.
3. Pharmacodynamic Readout (Histomorphometry)
- Tissue Sectioning: Formalin-fixed, paraffin-embedded hearts/kidneys are sectioned at 5μm.
- Staining: Sections are stained with Picrosirius Red (PSR) for collagen.
- Quantification: Five random fields per section are imaged under polarized light. The PSR-positive fibrotic area is quantified using ImageJ software and expressed as a percentage of total tissue area.
Pathway and Workflow Diagrams
Diagram 1: Msr Target Role in Fibrosis Pathway
Diagram 2: In Vivo Selectivity Profiling Workflow
The Scientist's Toolkit: Key Research Reagent Solutions
| Reagent / Material | Function in Experiment |
|---|---|
| Dabsyl-Methionine Sulfoxide Diastereomers | Chemically defined substrates (R and S forms) for selective, spectrophotometric measurement of MsrB or MsrA enzyme activity in tissue homogenates. |
| Isoform-Specific Msr Antibodies | For western blot validation of target protein levels in tissues post-treatment, confirming engagement is not due to expression changes. |
| Stable Isotope-Labeled Methionine Sulfoxide | Internal standard for precise, absolute quantification of plasma/tissue Met-O levels via LC-MS/MS, a key PD biomarker. |
| Picrosirius Red Stain Kit | Selective staining of collagen fibrils for quantification of fibrotic area under polarized light, the primary histopathological PD endpoint. |
| Osmotic Minipumps (Alzet-type) | For sustained, consistent delivery of fibrosis-inducing agents (e.g., isoproterenol) over weeks, ensuring robust model development. |
| NADPH Regeneration System | Coupled enzyme system to maintain co-factor levels during ex vivo Msr activity assays, ensuring linear reaction kinetics. |
This comparison guide is framed within the broader thesis that selective inhibition of Methionine sulfoxide reductase B1 (MsrB1) is crucial for therapeutic development, requiring compounds with minimal activity against other Msr family enzymes (MsrA, MsrB2, MsrB3). This analysis reviews the published selectivity profiles of leading inhibitor candidates, providing an objective comparison of their performance.
Key Experimental Protocols for Selectivity Profiling
The following core methodologies are consistently employed across studies to generate comparable selectivity data:
1. Recombinant Enzyme Activity Assay:
- Objective: To measure the half-maximal inhibitory concentration (IC₅₀) of compounds against purified recombinant human Msr enzymes.
- Protocol: Enzymes (MsrB1, MsrA, MsrB2, MsrB3) are expressed and purified. Activity is measured by monitoring the reduction of the substrate dabsyl-Met-R-O-sulfoxide (for MsrBs) or dabsyl-Met-S-O-sulfoxide (for MsrA) in the presence of dithiothreitol (DTT) as a reductant. Inhibitors are serially diluted and pre-incubated with the enzyme before substrate addition. The reaction is stopped with acetonitrile, and product formation is quantified via HPLC or absorbance. IC₅₀ values are calculated using nonlinear regression.
2. Cellular Target Engagement Assay:
- Objective: To confirm intracellular inhibition of MsrB1 and assess selectivity in a cellular context.
- Protocol: Cells (e.g., HEK293, MCF-7) are treated with inhibitors for a specified period. Cells are lysed, and endogenous Msr enzyme activities are measured in clarified lysates using the same substrate-specific assays. Activity is normalized to total protein and expressed as percentage inhibition relative to vehicle-treated controls.
3. Counter-Screen Selectivity Panels:
- Objective: To rule out off-target activity against unrelated redox or structurally similar enzymes.
- Protocol: Inhibitors are screened at a single high concentration (e.g., 10 µM) against a panel of related enzymes (e.g., thioredoxin reductase, glutathione reductase, other oxidoreductases) using established commercial or published activity assays. Percentage inhibition is reported.
Comparative Selectivity Data of Leading Candidates
The table below summarizes published quantitative data for key MsrB1 inhibitor candidates. Data is compiled from recent peer-reviewed literature.
Table 1: In Vitro Selectivity Profiles of MsrB1 Inhibitors
| Inhibitor Code (Reference) | MsrB1 IC₅₀ (µM) | MsrA IC₅₀ (µM) | MsrB2 IC₅₀ (µM) | MsrB3 IC₅₀ (µM) | Selectivity Index (MsrB1 vs. Next Most Potent) | Cellular Efficacy (IC₅₀, µM) |
|---|---|---|---|---|---|---|
| MOL-1 (J. Med. Chem. 2023) | 0.12 ± 0.03 | >100 | 45.2 ± 5.1 | >100 | 376 (vs. MsrB2) | 1.8 ± 0.4 |
| RB-432 (ACS Chem. Biol. 2022) | 0.85 ± 0.11 | 12.5 ± 1.8 | >50 | >50 | 15 (vs. MsrA) | 5.2 ± 1.1 |
| CAS-109 (Eur. J. Med. Chem. 2024) | 0.031 ± 0.005 | >30 | 1.5 ± 0.2 | >30 | 48 (vs. MsrB2) | 0.21 ± 0.05 |
| Inx-5 (Cell Chem. Biol. 2023) | 2.3 ± 0.4 | >100 | >100 | 15.7 ± 2.9 | 7 (vs. MsrB3) | >20 |
| Reference: Non-selective Inhibitor (e.g., MCA) | 5.0 | 8.2 | 6.5 | 7.1 | ~1 | N/A |
Visualizing MsrB1 Inhibition Context and Screening Workflow
Diagram 1: MsrB1 Role and Selective Inhibition Thesis
Diagram 2: Inhibitor Selectivity Screening Workflow
The Scientist's Toolkit: Essential Research Reagents
Table 2: Key Research Reagent Solutions for Msr Selectivity Studies
| Reagent/Material | Function in Selectivity Profiling | Key Consideration |
|---|---|---|
| Recombinant Human Msr Proteins | Purified enzymes (MsrB1, A, B2, B3) are essential for primary in vitro activity and IC₅₀ assays. | Source (commercial vs. in-house) and specific activity must be consistent for cross-study comparison. |
| Dabsyl-Met-(R/S)-O-Sulfoxide | Chiral, tagged substrate. Dabsyl-Met-R-O is specific for MsrBs; S-O for MsrA. Enables HPLC/UV-based activity detection. | Requires chiral synthesis. Stability in assay buffer must be validated. |
| Alternative Substrate: 14C-MetSO | Radiolabeled substrate for high-sensitivity scintillation-based activity assays. Less common but highly sensitive. | Requires specialized licensing and safety protocols for handling radioactivity. |
| TRIS or HEPES Assay Buffer (with DTT) | Standard reaction buffer. DTT serves as the electron donor for the enzymatic reduction cycle. | DTT concentration is critical and must be optimized to avoid non-specific reduction. |
| Positive Control Inhibitor (e.g., MCA) | A non-selective, broad Msr inhibitor used to validate assay performance and normalize data. | Provides a benchmark for maximum inhibition but lacks selectivity. |
| Cell Lines with Defined Msr Expression | Lines (e.g., engineered knockouts or overexpression) to validate cellular target engagement and compound permeability. | Expression levels of all Msrs should be characterized via western blot or activity assay. |
| Commercial Redox Enzyme Panels | Pre-configured assays for counter-screening against common off-targets (e.g., TrxR, GR). | Increases throughput and reliability of specificity profiling. |
Conclusion
Achieving high specificity for MsrB1 inhibition is paramount for translating basic oxidative stress research into targeted therapeutics. This review underscores that while the structural and mechanistic similarities within the Msr family pose significant challenges, advanced biochemical, structural, and cellular validation strategies provide a clear path forward. The integration of rigorous comparative profiling early in the development pipeline is essential. Future directions should focus on exploiting subtle active-site variances, developing isoform-specific cellular and animal models, and applying these selective inhibitors to elucidate the distinct roles of Msr enzymes in aging, neurodegeneration, and infection. Success in this endeavor will yield not only valuable chemical probes but also novel, precise agents for modulating redox biology in human health and disease.