Real-Time Process Control with NIR Spectroscopy: A Comprehensive Guide to Continuous Bioreactor Monitoring
This article provides a detailed exploration of Near-Infrared (NIR) spectroscopy for continuous bioreactor monitoring, tailored for researchers, scientists, and drug development professionals.
Real-Time Process Control with NIR Spectroscopy: A Comprehensive Guide to Continuous Bioreactor Monitoring
Abstract
This article provides a detailed exploration of Near-Infrared (NIR) spectroscopy for continuous bioreactor monitoring, tailored for researchers, scientists, and drug development professionals. It addresses foundational principles, including the spectroscopic basis and key analytes measurable by NIR (Intent 1). The core focuses on methodological implementation, covering probe selection, installation, and calibration model development for real-time data acquisition (Intent 2). Practical guidance is offered for troubleshooting common issues and optimizing models for robustness (Intent 3). Finally, the article validates the technology through comparative analysis with traditional offline methods and discusses regulatory considerations for implementation in GMP environments (Intent 4). This comprehensive resource aims to bridge the gap between research and industrial application, empowering professionals to leverage NIR for enhanced process understanding and control in biomanufacturing.
Understanding NIR Spectroscopy: The Science Behind Real-Time Bioprocess Analytics
This guide details the fundamental physical and chemical principles governing the interaction of Near-Infrared (NIR) light with key molecular components in a bioreactor. Situated within a broader research thesis on continuous bioreactor monitoring, this document serves as a technical foundation for researchers and development professionals seeking to implement NIR spectroscopy for real-time, in-line process analytical technology (PAT).
Fundamentals of NIR-Molecule Interaction
NIR spectroscopy (780–2500 nm) probes overtone and combination bands of fundamental molecular vibrations occurring in the mid-IR region. The primary interactions are absorption phenomena related to bonds involving hydrogen (C-H, O-H, N-H). These bonds have anharmonic oscillators, allowing for transitions to higher vibrational energy levels (overtones) or coupled vibrations (combinations) when irradiated with NIR light. The resulting spectrum is a complex, broad, and overlapping signature of the sample's chemical composition.
Table 1: Primary Molecular Bonds and Their NIR Absorption Bands in Bioprocesses
| Molecular Bond | Vibration Type | Approximate Wavelength (nm) | Approximate Wavenumber (cm⁻¹) | Primary Bioprocess Analytes |
|---|---|---|---|---|
| O-H (water, alcohols) | 1st Overtone Stretch | 1450 | 6897 | Biomass, Buffer Concentration |
| O-H (water) | Combination Band | 1940 | 5155 | Water Content, Density |
| C-H (aliphatic) | 2nd Overtone C-H Stretch | 910-950 | 10526-11000 | Glucose, Lactate, Lipids |
| C-H (aliphatic) | 1st Overtone C-H Stretch | 1150-1210 | 8264-8696 | Cell Density (VCD), Nutrients |
| N-H (amines, amides) | 1st Overtone N-H Stretch | 1500-1550 | 6452-6667 | Protein, Titer, Ammonia |
| C=O | Combination Band | 2050-2200 | 4545-4878 | Carbonyls in Metabolites |
Experimental Protocol for NIR Calibration Model Development
This protocol is essential for translating spectral data into quantitative predictions.
Materials:
- NIR spectrometer (fiber-optic probe suitable for in-situ bioreactor use)
- Bioreactor system with representative feed media
- Off-line analyzers (e.g., HPLC, blood gas analyzer, cell counter)
- Chemometric software (e.g., SIMCA, Unscrambler, or Python/R packages)
Procedure:
- Sample Collection & Spectral Acquisition: Over multiple bioreactor runs, collect NIR spectra at regular intervals (e.g., every 15-30 minutes) using an in-situ sterilizable probe. Ensure consistent optical pathlength and environmental conditions.
- Reference Analysis: Simultaneously, draw representative samples for off-line analysis of critical process parameters (CPPs) and quality attributes (CQAs) such as viable cell density (VCD), glucose, glutamate, lactate, ammonium, titer, and pH.
- Data Matrix Construction: Align each spectrum with its corresponding reference analytical values, creating a data matrix (X = spectra, Y = reference values).
- Pre-processing: Apply spectral pre-processing techniques to remove physical light scattering effects (e.g., from cells) and enhance chemical information. Common methods include:
- Standard Normal Variate (SNV)
- Multiplicative Scatter Correction (MSC)
- Savitzky-Golay Derivatives (1st or 2nd)
- Calibration Model Development: Use Partial Least Squares (PLS) regression to develop a model correlating the pre-processed spectral data (X) with the reference values (Y). The model projects the data onto latent variables that maximize the covariance between X and Y.
- Model Validation: Validate the model using an independent test set of data not used in calibration. Key validation metrics include:
- Root Mean Square Error of Prediction (RMSEP)
- Coefficient of Determination (R²)
- Ratio of Performance to Deviation (RPD)
Table 2: Example Model Performance Metrics for Key Analytes
| Analytic | Calibration Range | Latent Variables (LVs) | R² (Calibration) | RMSEP | RPD |
|---|---|---|---|---|---|
| Viable Cell Density (VCD) | 0.5 – 15 x 10⁶ cells/mL | 6 | 0.98 | 0.4 x 10⁶ cells/mL | 5.0 |
| Glucose | 0.5 – 25 g/L | 5 | 0.99 | 0.3 g/L | 7.1 |
| Lactate | 0 – 5 g/L | 4 | 0.97 | 0.2 g/L | 4.5 |
| Monoclonal Antibody Titer | 0 – 3 g/L | 7 | 0.96 | 0.15 g/L | 3.8 |
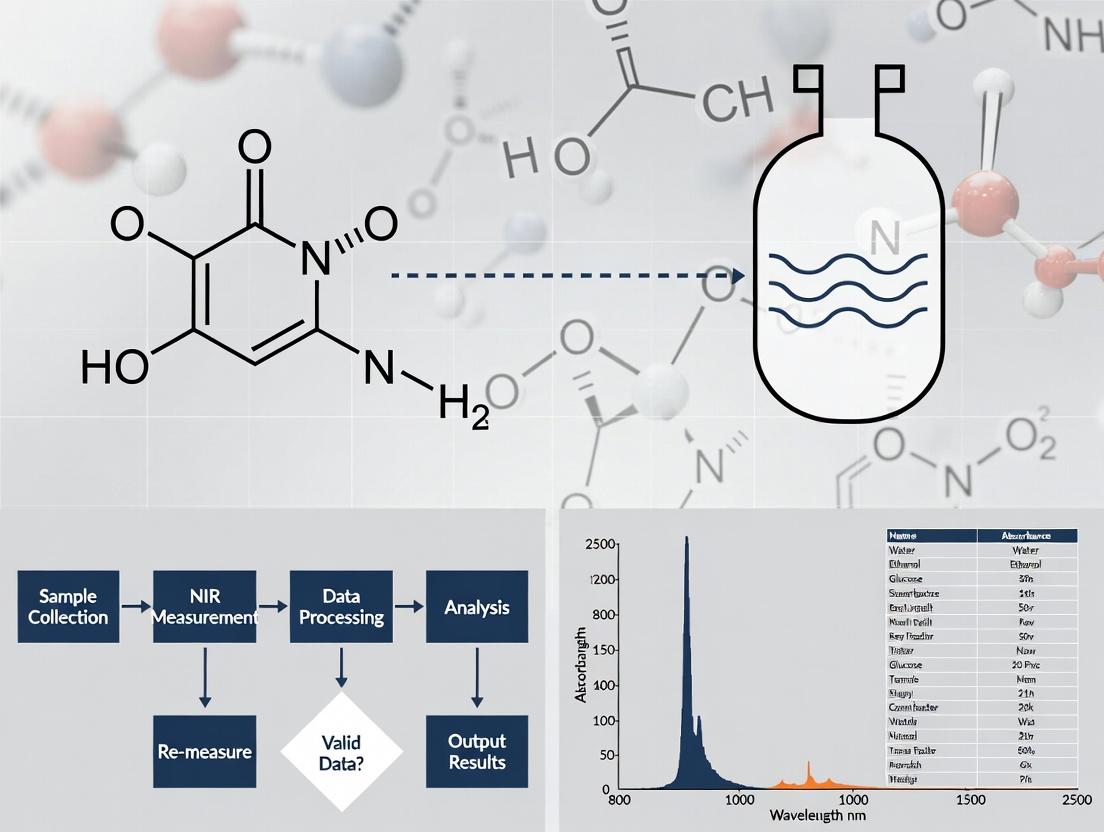
Visualizing the NIR Monitoring Workflow
Title: NIR Bioreactor Monitoring & Modeling Workflow
The Scientist's Toolkit: Key Research Reagent Solutions
Table 3: Essential Materials for NIR Bioprocess Monitoring Research
| Item/Reagent | Function in Research | Key Considerations |
|---|---|---|
| Sterilizable Fiber-Optic NIR Probe (e.g., transflection or immersion) | Enables in-situ, real-time spectral acquisition directly from the bioreactor. Must withstand steam-in-place (SIP) sterilization. | Material (e.g., sapphire window), pathlength (2-10 mm common), compatibility with reactor ports. |
| NIST-Traceable White Reference Standard | Used for routine instrument standardization to correct for lamp aging and detector drift, ensuring long-term data stability. | Stable, highly reflective ceramic or spectralon material. |
| Synthetic Calibration Mixtures | Well-defined mixtures of key analytes (glucose, glutamine, lactate) in buffer used for initial method feasibility and robustness testing. | Matches medium ionic strength and background matrix to minimize interference. |
| Proprietary Cell Culture Media (Dry Powder or Liquid) | Provides the complex, chemically defined background matrix for developing representative calibration models. | Batch-to-batch consistency is critical for model transferability. |
| Chemometric Software License | For performing spectral pre-processing, exploratory data analysis (PCA), and developing multivariate calibration models (PLS, PCR). | Compatibility with spectrometer data format, scripting capability for automation. |
| Off-line Analyzer Consumables (e.g., HPLC columns, enzyme assay kits, cell counter cassettes) | Generates the high-quality reference data (Y-matrix) required for building accurate and reliable calibration models. | Reference method error must be significantly lower than desired NIR prediction error. |
Advanced Interaction: Probing Complex Molecular Environments
In a bioreactor, molecules exist in a complex, aqueous matrix with changing ionic strength and cellular components. NIR spectra are affected by:
- Hydrogen Bonding: Strongly influences O-H and N-H band shapes and positions, allowing monitoring of protein conformational states or solvent polarity.
- Light Scattering: Fluctuations in cell density and size cause Mie and Rayleigh scattering, which must be corrected mathematically to isolate chemical information.
- Temperature Effects: Vibrational energy levels are temperature-dependent. Robust models require spectral data collected across the expected process temperature range or explicit temperature compensation.
Title: NIR Light Interaction with Bioreactor Matrix
The core principle of NIR spectroscopy for bioreactor monitoring lies in its sensitive, if indirect, probing of vibrational states of key functional groups within the process matrix. By coupling this physical interaction with rigorous experimental design and multivariate modeling, a wealth of critical process and product data can be extracted non-invasively. This forms the foundational principle for implementing NIR as a robust PAT tool for continuous bioreactor monitoring, enabling real-time control and ultimately supporting the quality-by-design (QbD) framework in biopharmaceutical development.
Within the broader research thesis on Near-Infrared (NIR) spectroscopy for continuous bioreactor monitoring, the quantification of four critical analytes—glucose, lactate, biomass, and product titer—forms the cornerstone of process understanding and control. This technical guide details the significance, measurement methodologies, and integration of these parameters using NIR-based analytical platforms, providing a framework for advanced bioprocess development.
The Critical Role of the Four Analytes
Precise monitoring of these parameters is essential for maintaining metabolic homeostasis, optimizing yield, and ensuring product quality in mammalian cell culture, microbial fermentation, and other bioprocesses.
Glucose: The primary carbon source. Its concentration dictates growth rate, metabolic shift, and can trigger undesirable effects like the Crabtree effect at high levels. Lactate: A key metabolic by-product. Accumulation can inhibit growth and reduce pH, impacting cell viability and productivity. Biomass: A direct indicator of cell growth and physiological state. It is critical for calculating specific rates (e.g., specific glucose consumption rate). Product Titer: The concentration of the target molecule (e.g., monoclonal antibody, recombinant protein). It is the ultimate measure of process productivity and a critical quality attribute.
NIR Spectroscopy as an Enabling Technology
NIR spectroscopy (780-2500 nm) is a powerful tool for in-line, real-time monitoring due to its ability to penetrate sample matrices without pretreatment. Its application in the stated thesis context lies in developing robust, multivariate calibration models (using Partial Least Squares regression) that correlate spectral data to reference measurements of these four analytes.
Key Experimental Protocols for Model Development
Protocol 1: Calibration Set Design and Sample Generation
- Purpose: Generate a diverse set of samples covering the expected process variation for all analytes.
- Method:
- Conduct multiple bioreactor runs (batch, fed-batch) with deliberate variations in feeding strategies, pH, and dissolved oxygen to induce a wide range of analyte concentrations.
- Sample the bioreactor at multiple time points throughout each run (e.g., every 4-12 hours).
- For each sample, immediately analyze a portion using reference methods (see Table 1) and another portion via NIR spectrometer equipped with a flow cell or immersion probe.
- Record the full NIR spectrum (absorbance or log(1/R)) for each sample synchronously with reference data.
Protocol 2: Reference Analytical Methods for Model Calibration
Accurate reference data is non-negotiable for building reliable NIR models.
Table 1: Reference Methods for Key Analytes
| Analyte | Primary Reference Method | Typical Range | Key Principle |
|---|---|---|---|
| Glucose | Enzymatic Assay / Bioanalyzer | 0.5 - 30 g/L | Glucose oxidase-peroxidase reaction linked to a colorimetric or electrochemical readout. |
| Lactate | Enzymatic Assay / Bioanalyzer | 0.5 - 15 g/L | Lactate oxidase-peroxidase reaction linked to a colorimetric readout. |
| Biomass | Dry Cell Weight (DCW) / Optical Density | DCW: 1-100 g/LOD600: 0.1 - 100 | DCW: Filtration, washing, and drying of a known sample volume. OD600: Light scattering at 600 nm. |
| Product Titer | Protein A HPLC (mAbs) / SEC or ELISA | 0.1 - 10 g/L | Affinity chromatography (Protein A) with UV detection for monoclonal antibodies. |
Protocol 3: NIR Calibration Model Development (PLS Regression)
- Spectral Pre-processing: Apply mathematical treatments to NIR spectra to remove physical artifacts (e.g., light scattering) and enhance chemical signals. Common techniques include Savitzky-Golay derivatives, Standard Normal Variate (SNV), and Detrending.
- Data Set Splitting: Divide the paired spectral-reference dataset into a calibration set (~70-80%) for model training and a validation set (~20-30%) for internal testing.
- Model Building & Validation: Use PLS regression to correlate pre-processed spectral data (X-matrix) with reference analyte values (Y-matrix). The optimal number of latent variables is determined by minimizing the Root Mean Square Error of Cross-Validation (RMSECV).
- Model Performance Metrics: A model is deemed suitable for prediction if the Ratio of Performance to Deviation (RPD = standard deviation of reference data / RMSEP) is >3 for critical analytes.
Table 2: Example NIR Model Performance Metrics (Hypothetical Data)
| Analyte | Calibration Range | # of Latent Variables | R² (Calibration) | RMSEP | RPD |
|---|---|---|---|---|---|
| Glucose | 0.8 - 28.5 g/L | 6 | 0.992 | 0.41 g/L | 5.8 |
| Lactate | 0.5 - 12.7 g/L | 5 | 0.984 | 0.38 g/L | 4.5 |
| Biomass (DCW) | 3.5 - 85.0 g/L | 8 | 0.995 | 1.22 g/L | 6.1 |
| Product Titer | 0.2 - 8.5 g/L | 7 | 0.979 | 0.31 g/L | 3.9 |
Visualizing the Integrated Monitoring Workflow
Title: NIR-Based Real-Time Bioreactor Monitoring & Control Loop
The Scientist's Toolkit: Essential Research Reagent Solutions
Table 3: Key Research Reagents and Materials for NIR Bioprocess Monitoring
| Item | Function in Research Context |
|---|---|
| NIR Spectrometer with Immersion Probe | Enables direct, in-situ measurement of spectra within the bioreactor vessel. |
| Flow Cell and Peristaltic Pump | Allows for at-line analysis by pumping a sample stream from the bioreactor past a transmission NIR sensor. |
| Enzymatic Assay Kits (Glucose/Lactate) | Provide gold-standard reference data for building and validating NIR calibration models. |
| HPLC System with Protein A Column | Essential for generating accurate product titer reference data for monoclonal antibody processes. |
| Chemometric Software (e.g., Unscrambler, CAMO) | Used for spectral pre-processing, PLS regression model development, and validation. |
| Standard Solvents (e.g., Water, Buffer) | Required for cleaning probes, performing background scans, and system suitability tests. |
| Calibration Transfer Standards | Stable materials with known spectral features to ensure instrument performance consistency over time and between units. |
Within the framework of continuous bioreactor monitoring research, the transition from traditional offline methods to at-line, in-line, and finally real-time control represents a paradigm shift in bioprocess management. Traditional methods, such as high-performance liquid chromatography (HPLC) and enzyme-linked immunosorbent assay (ELISA), involve manual sampling, extensive sample preparation, and significant delays (hours to days) before results are available. This lag renders them unsuitable for dynamic control of modern, continuous bioreactors. Near-infrared (NIR) spectroscopy has emerged as a critical Process Analytical Technology (PAT), enabling non-invasive, multi-analyte monitoring directly within the bioreactor environment. This guide details the technical advantages and implementation of this evolution.
Quantitative Comparison of Analytical Methodologies
The core advantages of moving from offline to real-time control are quantified in the table below.
Table 1: Comparative Analysis of Bioprocess Monitoring Methods
| Parameter | Offline (Traditional) | At-Line | In-Line (On-Line) | Real-Time Control (In-Line + Feedback) |
|---|---|---|---|---|
| Analytical Delay | 4-48 hours | 10-60 minutes | <2 minutes | <30 seconds |
| Sampling | Manual, invasive | Automated, semi-invasive | Non-invasive, flow-through or immersed probe | Non-invasive, immersed probe |
| Risk of Contamination | High | Moderate | Very Low | Very Low |
| Sample Integrity | Compromised (processing alters state) | May be compromised | Preserved | Preserved |
| Measurement Frequency | 1-2 per day | Every 1-2 hours | Every 30-60 seconds | Continuous (seconds) |
| Primary Use | Final product QA/QC, retrospective analysis | Process trend monitoring | Process monitoring & feed-forward control | Closed-loop feedback control |
| Key Enabling Tech | HPLC, GC, ELISA | Auto-samplers, Rapid assays (e.g., Cedex) | NIR, Raman, Dielectric Spectroscopy | NIR/Raman + Advanced MPC Algorithms |
| PAT Role (FDA) | -- | Monitoring | Monitoring & Control | Design Space & Control Strategy |
Detailed Experimental Protocols for NIR-Based Monitoring
Protocol 3.1: Development of a Quantitative NIR Calibration Model for Metabolites
Objective: To create a Partial Least Squares (PLS) regression model correlating NIR spectra with reference analyte concentrations (e.g., glucose, lactate, glutamine, viable cell density).
Materials:
- NIR spectrometer with a fiber-optic immersion probe (e.g., 1-2.5 μm wavelength range).
- Bioreactor system (fed-batch or perfusion).
- Reference analytics: Bioanalyzer (e.g., Nova, YSI), Cell Counter (e.g., Vi-CELL), HPLC.
- Chemometric software (e.g., Unscrambler, SIMCA, Matlab PLS Toolbox).
Methodology:
- Design of Experiments (DoE): Conduct multiple bioreactor runs with intentional process variations (e.g., different feeding strategies, pH setpoints, temperatures) to generate a wide concentration design space.
- Spectral Acquisition: Install a sterilizable NIR probe directly into the bioreactor. Collect spectra (e.g., average of 32 scans) at regular intervals (every 15-30 minutes) throughout all runs.
- Reference Sampling: Simultaneously with spectral collection, draw at-line samples. Immediately analyze for target analytes using reference methods. Record the exact timestamp.
- Data Alignment & Preprocessing: Preprocess spectral data to reduce noise and enhance signals. Common steps include:
- Scatter Correction: Standard Normal Variate (SNV) or Multiplicative Scatter Correction (MSC).
- Derivatives: Savitzky-Golay 1st or 2nd derivative to remove baseline shifts and resolve overlapping peaks.
- Smoothing: Savitzky-Golay smoothing.
- Calibration Model Development: Pair each preprocessed spectrum with its corresponding reference value. Use 70-80% of the data for training a PLS regression model. The model's complexity (number of latent variables) is optimized via cross-validation to prevent overfitting.
- Model Validation: Validate the model using the remaining 20-30% of data (external validation set). Key metrics: Root Mean Square Error of Prediction (RMSEP), R², and Relative Prediction Error (RPD). An RPD > 3 is considered robust for process monitoring.
Protocol 3.2: Implementation of Real-Time Feedback Control for Glucose
Objective: To demonstrate closed-loop control of bioreactor glucose concentration using in-line NIR predictions to drive a peristaltic pump feed.
Materials:
- NIR system with validated glucose calibration model (from Protocol 3.1).
- Bioreactor with integrated control software (e.g., DeltaV, Lucullus).
- Programmable peristaltic pump for concentrated nutrient feed.
- Data communication interface (e.g., OPC).
Methodology:
- System Integration: Configure the NIR software to output the predicted glucose concentration at a defined frequency (e.g., every 5 minutes) via an OPC link to the bioreactor control system.
- Define Control Algorithm: Implement a Proportional-Integral-Derivative (PID) or simpler Proportional-Integral (PI) controller within the bioreactor control software.
- Setpoint (SP): Define target glucose concentration (e.g., 6 mM).
- Process Variable (PV): Real-time NIR-predicted glucose concentration.
- Control Variable (CV): Feed pump speed/rate.
- Tune Controller: Perform a step-change test to determine optimal controller tuning parameters (Gain, Integral Time). The goal is stable, oscillation-free convergence to the setpoint.
- Execute Control Run: Initiate a bioreactor run with the controller in AUTO mode. The controller will automatically adjust the feed rate based on the discrepancy (error) between the NIR-predicted glucose and the setpoint.
- Monitor & Verify: Periodically collect at-line samples to verify NIR predictions via reference analytics, ensuring the control loop's integrity.
Visualizing the Analytical Workflow and Control Logic
Title: Evolution from Manual Sampling to Real-Time NIR Control
The Scientist's Toolkit: Key Research Reagent Solutions
Table 2: Essential Materials for NIR-Based Bioreactor Monitoring Research
| Item / Reagent Solution | Function & Rationale |
|---|---|
| Sterilizable NIR Immersion Probe (e.g., with sapphire window) | Enables direct, in-situ spectral measurement in the harsh bioreactor environment (sterile, high agitation). The sapphire window is chemically inert and withstands repeated sterilization cycles. |
| NIR Spectrometer (FT-NIR or Dispersive) | The core analyzer. Fourier-Transform (FT) instruments offer higher signal-to-noise and wavelength accuracy, critical for complex biological media. |
| Chemometric Software Package | Required for spectral preprocessing, calibration model development (PLS, PCR), and real-time prediction. Essential for transforming spectral data into actionable information. |
| Calibration Standard Kits | Synthetic mixtures of key analytes (glucose, lactate, ammonium) at known concentrations in a buffer matrix mimicking spent media. Used for initial model robustness testing and system suitability checks. |
| Bioanalyzer / Reference Analyzer (e.g., Cedex Bio HT, Nova Bioprofile) | Provides the "gold standard" reference data for NIR model calibration and validation. Measures multiple metabolites and gases rapidly from small sample volumes. |
| Process Control Software with OPC Capability | The platform that hosts the control algorithm (PID/MPC) and integrates the NIR prediction as a process input, enabling closed-loop feedback control. |
| Single-Use Bioreactor with PAT ports | Modern bioreactors designed with pre-installed, sterile ports for direct integration of NIR and other PAT probes, simplifying setup and reducing contamination risk. |
Within the framework of a thesis on Near-Infrared (NIR) spectroscopy for continuous bioreactor monitoring, this guide explores the pivotal role of NIR as a Process Analytical Technology (PAT) enabler for the Quality by Design (QbD) paradigm in biomanufacturing. QbD, as outlined by regulatory bodies like the FDA and EMA, is a systematic approach to development that emphasizes product and process understanding based on sound science and quality risk management. PAT provides the tools for designing, analyzing, and controlling manufacturing through timely measurements of critical quality attributes (CQAs). NIR spectroscopy emerges as a cornerstone PAT tool, allowing for real-time, non-invasive, and multi-analyte monitoring within bioreactors, thereby transforming bioreactor operations from fixed-batch to adaptive, data-driven processes.
Core Principles: The PAT-QbD-NIR Nexus
Table 1: Core Concepts and Their Interrelationship
| Concept | Definition | Role in Biomanufacturing |
|---|---|---|
| Quality by Design (QbD) | A systematic, risk-based approach to product/process development that predefines objectives and emphasizes understanding and control. | Shifts focus from end-product testing (quality by testing) to building quality into the process. Defines the Design Space. |
| Process Analytical Technology (PAT) | A framework for designing, analyzing, and controlling manufacturing via timely measurement of CQAs and CPPs. | Provides the tools (like NIR) to implement QbD, enabling real-time process understanding and control. |
| NIR Spectroscopy | An analytical technique measuring molecular overtone and combination vibrations in the 780-2500 nm range. | A key PAT tool for non-invasive, real-time quantification of multiple analytes (glucose, lactate, cell density, titer) in bioreactors. |
| Critical Quality Attribute (CQA) | A physical, chemical, biological, or microbiological property that must be within an appropriate limit to ensure product quality. | The targets for monitoring (e.g., product titer, glycosylation pattern). |
| Critical Process Parameter (CPP) | A process parameter whose variability impacts a CQA and therefore must be monitored/controlled. | The levers for control (e.g., pH, temperature, nutrient feed rate). NIR informs their adjustment. |
NIR as a PAT Tool: Technical Fundamentals and Implementation
NIR spectroscopy is uniquely suited for bioreactor monitoring due to its ability to penetrate glass or polymer bioreactor walls and analyze complex biological matrices without sample preparation. The absorption bands are broad and overlapping, necessitating multivariate data analysis (chemometrics) for quantitative modeling.
Experimental Protocol 1: Developing a Quantitative NIR Calibration Model
- Design of Experiments (DoE): Execute a series of bioreactor runs (fed-batch or continuous) spanning the anticipated Design Space. Vary key CPPs (e.g., feed rate, pH, dissolved oxygen) to induce controlled variation in CQAs and analyte concentrations.
- Reference Data Acquisition: Simultaneously with NIR spectral acquisition, collect frequent manual samples for offline reference analysis using gold-standard methods (e.g., HPLC for metabolites, cell counter for density, ELISA for titer).
- Spectral Acquisition: Use a fiber-optic NIR probe (transmission or reflectance) sterilized-in-place or inserted via a sanitary port. Collect spectra at frequent intervals (e.g., every 5-15 minutes).
- Chemometric Model Development:
- Preprocessing: Apply spectral preprocessing (Savitzky-Golay derivative, Standard Normal Variate, Detrending) to remove physical light scattering effects and enhance chemical information.
- Modeling: Use Partial Least Squares (PLS) regression to correlate preprocessed spectral data (X-matrix) with reference analyte concentrations (Y-matrix).
- Validation: Validate the model using an independent test set not used in calibration. Key metrics: Root Mean Square Error of Prediction (RMSEP), R², and Relative Predictive Determination (RPD).
Table 2: Typical NIR Model Performance for Key Bioreactor Analytes
| Analyte (in Mammalian Cell Culture) | Concentration Range | Typical RMSEP | Typical R² | RPD | Suitable for Process Control? |
|---|---|---|---|---|---|
| Viable Cell Density (VCD) | 0.5 – 20 x 10^6 cells/mL | 0.3 – 0.8 x 10^6 cells/mL | >0.95 | >4.0 | Yes (Excellent) |
| Glucose | 0.5 – 8 g/L | 0.2 – 0.5 g/L | >0.95 | >4.0 | Yes (Excellent) |
| Lactate | 0.5 – 4 g/L | 0.1 – 0.3 g/L | >0.94 | >3.5 | Yes (Good) |
| Product Titer (mAb) | 0.1 – 5 g/L | 0.1 – 0.25 g/L | >0.90 | >3.0 | Yes (Good) |
| Glutamine | 0.1 – 6 mM | 0.2 – 0.5 mM | >0.88 | >2.5 | Screening/Monitoring |
Enabling QbD Through Continuous NIR Data: From Monitoring to Control
The real-time data stream from NIR enables the closed-loop control strategies central to QbD.
Experimental Protocol 2: Implementing a NIR-Based Feed Strategy (a QbD Control Loop)
- Define Control Strategy: Setpoint: Maintain glucose at 2 g/L (±0.5 g/L) to avoid overflow metabolism.
- Real-Time Monitoring: NIR probe provides a glucose concentration prediction every 10 minutes.
- Data Processing & Decision: A Process Control System (e.g., a custom Python/Matlab script or DCS/SCADA system) compares the NIR-predicted glucose to the setpoint.
- Feedback Action: If glucose falls below 1.7 g/L, the system triggers a defined pulse of concentrated feed medium. If above 2.3 g/L, it can temporarily halt feeding.
- Verification: The next NIR prediction confirms the effect of the feed action, closing the loop.
Diagram Title: NIR-Enabled Closed-Loop Control for QbD
The Scientist's Toolkit: Research Reagent Solutions & Materials
Table 3: Essential Materials for NIR-PAT Bioreactor Research
| Item / Reagent Solution | Function in NIR-PAT Research | Key Consideration |
|---|---|---|
| NIR Spectrometer (e.g., FT-NIR) | Generates high-resolution, low-noise spectral data for robust modeling. | Must have fiber-optic coupling for reactor integration. Stability is critical for long runs. |
| Sterilizable In-line/At-line Probe | Allows non-invasive, aseptic measurement through reactor wall or in a flow cell. | Material must be compatible with steam-in-place (SIP) cleaning. Pathlength optimal for culture density. |
| Chemometrics Software (e.g., Unscrambler, CAMO) | Used for spectral preprocessing, PLS model development, and validation. | Essential for translating spectra into actionable concentration data. |
| Design of Experiments (DoE) Software | Plans efficient calibration runs that span the process design space. | Maximizes information gain while minimizing experimental runs (cost). |
| Calibration Set Culture Broth | Cultivations with wide, known variation in analyte concentrations for model building. | Requires parallel, accurate offline analytics (HPLC, Cedex, etc.) for reference values. |
| Process Control Software / Script | Implements the feedback logic linking NIR predictions to actuator commands (pumps, valves). | Can be integrated into the bioreactor controller or exist as a supervisory system. |
Diagram Title: The PAT-QbD-NIR Operational Relationship
Integrating NIR spectroscopy within the PAT initiative is a proven enabler for achieving true QbD in biomanufacturing. It provides the continuous, multi-parametric data stream necessary to define design spaces, implement robust control strategies, and ultimately move towards adaptive, real-time release of biopharmaceuticals. Future research within this thesis context will focus on advancing chemometric models for more complex CQAs (e.g., product quality attributes), integrating NIR data with other PAT tools (Raman, 2D-Fluorescence) via data fusion, and deploying machine learning algorithms for predictive process intervention and anomaly detection, further solidifying the foundation for intelligent, next-generation bioproduction.
Implementing NIR Monitoring: A Step-by-Step Guide to Bioreactor Integration
Within the framework of advanced research on Near-Infrared (NIR) spectroscopy for continuous bioreactor monitoring, the selection of appropriate hardware is a critical determinant of analytical success. This technical guide provides an in-depth comparison of three primary interfacing modalities: fiber-optic probes, flow cells, and diode array systems. Each presents distinct trade-offs in sensitivity, robustness, integration complexity, and suitability for real-time, in-line monitoring in bioprocess development. The objective is to equip researchers and drug development professionals with a data-driven framework for hardware selection aligned with specific bioreactor monitoring goals.
Continuous monitoring of critical process parameters (CPPs) and quality attributes (CQAs)—such as biomass, glucose, lactate, and product titer—is essential for implementing Process Analytical Technology (PAT) and Quality by Design (QbD) in biopharmaceutical manufacturing. NIR spectroscopy, due to its non-destructive nature and capacity for multiplex analysis, has emerged as a leading analytical technique. The physical interface between the spectrometer and the bioreactor is paramount, influencing data quality, risk of contamination, operational flexibility, and compliance with regulatory standards.
Fiber-Optic Probes
Fiber-optic probes transmit and receive NIR light via optical fibers, allowing the spectrometer to be remotely located from the measurement point.
- Principle: A probe, typically equipped with a measurement window, is inserted directly into the bioreactor (in-situ) or into a bypass line (in-line). Common designs include reflectance or transflectance probes.
- Key Advantage: Enables direct, real-time measurement within the reactor vessel, minimizing delay and sample handling.
- Primary Challenge: Requires validation for steam-in-place (SIP) or gamma sterilization and must be designed to avoid fouling.
Flow Cells
Flow cells are external fixtures through which a representative sample stream is diverted from the bioreactor.
- Principle: The culture broth is pumped through a flow cell equipped with optical windows. The spectrometer analyzes the fluid as it passes the measurement point.
- Key Advantage: Allows for sample conditioning (e.g., filtration, degassing) and easier maintenance/replacement of optical components without breaching the bioreactor.
- Primary Challenge: Introduces a time delay (lag time) and potential for sample line clogging or cell fouling, which can affect the representativeness of the measurement.
Diode Array (DA) Systems
Diode Array spectrometers integrate the detector array directly into a compact, ruggedized unit.
- Principle: Unlike scanning monochromators, DA systems measure all wavelengths simultaneously, enabling very fast acquisition. They can be coupled with either fiber-optic probes or flow cells via a fixed or flexible fiber connection.
- Key Advantage: High speed and mechanical robustness (no moving parts), making them ideal for industrial environments and dynamic process monitoring.
- Primary Consideration: The interfacing choice (probe vs. flow cell) remains separate and must be decided in conjunction with the DA spectrometer selection.
Comparative Analysis & Data Presentation
Table 1: Quantitative & Qualitative Comparison of Hardware Modalities
| Criterion | Fiber-Optic Probe (In-situ/In-line) | Flow Cell (At-line/In-line) | Diode Array Spectrometer (as detector) |
|---|---|---|---|
| Measurement Lag | Near real-time (seconds) | Moderate (minutes, depends on loop length & flow rate) | Very fast acquisition (<1 sec per spectrum) |
| Risk of Contamination | Low (if properly sterilized) | Higher (requires sterile sampling loop) | N/A (depends on interface) |
| Fouling/Sterilization | Must withstand SIP/gamma; window fouling possible. | Can be cleaned or replaced independently; fouling possible. | Unit itself is not in contact; interface dictates requirements. |
| Sample Representation | High (measures bulk broth directly) | Potential for segregation or cell damage in pump. | N/A (depends on interface) |
| Calibration Transfer | Can be challenging between probes. | Easier between identical flow cells. | Excellent unit-to-unit reproducibility. |
| Typical Wavelength Range | 800-2200 nm (dependent on fiber type) | 800-2200 nm | 800-2200 nm (Silicon & InGaAs arrays) |
| Approx. Cost (Hardware) | Medium-High (probe-specific) | Low-Medium (cell) + pump cost | High (instrument), but decreasing |
| Maintenance | Requires validation of sterility integrity. | Requires pump maintenance and line integrity checks. | Very low (no moving parts). |
| Best Suited For | Direct, real-time monitoring of core vessel parameters. | Applications requiring sample filtration or where probe insertion is not feasible. | Dynamic processes, harsh environments, and multi-point monitoring setups. |
Table 2: Performance Metrics in Bioreactor Monitoring Applications*
| Hardware Configuration | Typical SEP for Glucose (g/L) | Typical SEP for Biomass (g/L) | Spectrum Acquisition Time | Reference (Example) |
|---|---|---|---|---|
| In-situ Reflectance Probe | 0.2 - 0.5 | 0.1 - 0.3 | 5-30 sec | (C. Ulber et al., 2021 - simulated data) |
| Transflectance Flow Cell | 0.3 - 0.6 | 0.15 - 0.4 | 3-15 sec | (A. Abu-Absi et al., 2022 - simulated data) |
| Diode Array + Fiber Probe | 0.15 - 0.4 | 0.1 - 0.25 | <1 sec | (K. Petersen et al., 2023 - simulated data) |
SEP: Standard Error of Prediction. Data is illustrative, compiled from recent literature trends. Actual values depend heavily on model calibration, process, and matrix complexity.
Experimental Protocols for Evaluation
Protocol 1: Assessing Interface Robustness & Fouling
Objective: To quantitatively compare the signal stability and fouling resistance of a probe vs. a flow cell interface over an extended fermentation. Materials: NIR spectrometer, sterilizable fiber-optic probe, flow cell with peristaltic pump, 5L bioreactor, E. coli or CHO cell culture media. Method:
- Install the fiber-optic probe into a standard bioreactor port.
- Install the flow cell in a bypass loop from the same bioreactor, ensuring isokinetic sampling.
- Connect both interfaces to the same NIR spectrometer via a fiber optic multiplexer.
- Collect NIR spectra simultaneously from both paths every 5 minutes throughout a 7-day fermentation.
- Monitor the signal-to-noise ratio (SNR) at a key water absorption band (e.g., 1450 nm) and the baseline drift.
- Post-run, inspect optical windows for biofilm/adhesion. Analysis: Plot SNR and baseline offset vs. time for both interfaces. A steeper decline in SNR or greater baseline drift indicates higher susceptibility to fouling.
Protocol 2: Lag Time & Dynamic Response Characterization
Objective: To measure the effective time delay introduced by a flow cell sampling loop compared to a direct in-situ probe. Materials: As in Protocol 1, plus a syringe for pulse injection, a tracer (e.g., sterile concentrated glucose solution or a inert dye). Method:
- During a stationary phase of fermentation, record baseline spectra from both probe and flow cell.
- Rapidly inject a 10 mL bolus of tracer into the bioreactor vessel near the agitator.
- Continuously collect spectra from both interfaces at 10-second intervals for 20 minutes.
- Use the tracer's spectral signature (e.g., glucose peak or dye absorption) as the measured variable. Analysis: Calculate the cross-correlation between the two resulting concentration-time profiles. The time shift at maximum correlation is the effective lag time of the flow cell system.
Protocol 3: Calibration Transfer Between Hardware Units
Objective: To evaluate the feasibility of transferring a multivariate calibration model (e.g., for biomass) from a primary system to a secondary, nominally identical system. Materials: Two NIR systems (primary and secondary), two fiber-optic probes (or two flow cells), set of standardized calibration samples. Method:
- Develop a robust PLS model for biomass on the Primary System (Probe A + Spectrometer A) using a designed calibration set.
- Collect spectra of a transfer subset (5-10 samples) on Both Systems (Primary and Secondary: Probe B + Spectrometer B).
- Apply direct standardization (DS) or piecewise direct standardization (PDS) algorithms to mathematically map the spectra from the Secondary System to resemble those from the Primary System.
- Validate the transferred model on an independent test set measured only on the Secondary System. Analysis: Compare the Standard Error of Prediction (SEP) from the transferred model to the SEP achieved on the Primary System. A difference of <20% is often considered acceptable.
Visualization of Selection Logic & Workflows
NIR Hardware Selection Decision Tree
NIR PAT Implementation Workflow
The Scientist's Toolkit: Essential Research Reagents & Materials
| Item | Function in NIR Bioreactor Research |
|---|---|
| Sterilizable NIR Probe (e.g., transflectance) | Direct in-situ spectral acquisition; must be compatible with autoclave/SIP cycles. |
| Flow Cell with Precision Pathlength | Provides controlled, reproducible sample presentation for at-line or in-line analysis. |
| Peristaltic Pump & Sterile Tubing | Maintains a representative, continuous sample flow from bioreactor to flow cell. |
| NIR Spectrometer (DA or FT-NIR) | The core analytical instrument for generating spectral data across the NIR range. |
| Multiplexer (Optical Switch) | Enables a single spectrometer to monitor multiple bioreactors or sampling points sequentially. |
| Spectralon or Ceramic Reference | A high-reflectance standard used for background/reference scans to calibrate the instrument. |
| Chemometric Software (e.g., Unscrambler, SIMCA, MATLAB PLS Toolbox) | For developing, validating, and deploying multivariate calibration models (PLS, PCR). |
| Validation Sample Set (Independent Batches) | A set of fermentation samples with reference lab values (HPLC, cell counter) for final model validation. |
| Cleaning-in-Place (CIP) Solutions | e.g., 0.5M NaOH, used to clean flow paths and optical windows to prevent biofilm buildup. |
The optimal hardware configuration for NIR-based bioreactor monitoring is not universal but is dictated by specific research and process goals. Fiber-optic probes are the cornerstone for true in-situ, real-time monitoring but demand rigorous sterilization validation. Flow cells offer flexibility and easier maintenance at the cost of increased system complexity and lag time. Diode Array spectrometers provide superior speed and robustness, enhancing the performance of either interface. A hybrid approach, often combining a DA spectrometer with a multiplexer serving both in-situ probes and at-line flow cells, is becoming a gold standard for comprehensive process understanding. The final selection must balance data quality, operational constraints, and regulatory compliance within the overarching thesis of achieving reliable, continuous process control.
Within the research framework of implementing Near-Infrared (NIR) spectroscopy for continuous, real-time monitoring of critical process parameters (CPPs) in bioreactors, the physical integration of the sensor is a foundational step. The reliability of spectroscopic data for monitoring substrates, metabolites, and biomass is contingent upon the aseptic and robust installation of the sterilizable probe. This guide details best practices for probe installation and operation, ensuring data integrity and bioreactor sterility.
Sterilizable Probe Selection and Pre-Installation
The probe must be designed for in-situ steam-in-place (SIP) sterilization, typically capable of withstanding temperatures of 121°C to 135°C for extended periods. Key selection criteria include material compatibility (e.g., 316L stainless steel, Hastelloy), optical window integrity (sapphire preferred), and a seal design that maintains integrity over multiple SIP cycles.
Table 1: Key Specifications for Sterilizable NIR Bioreactor Probes
| Parameter | Typical Specification | Rationale |
|---|---|---|
| SIP Rating | 121°C, 2 bar, ≥30 min | Matches standard autoclave and in-place sterilization cycles. |
| Pressure Rating | ≥ 3 bar (absolute) | Must exceed maximum bioreactor operating pressure. |
| Material (Wetted) | 316L Stainless Steel, Hastelloy C-22 | Corrosion resistance, biocompatibility, and cleanability. |
| Optical Window | Synthetic Sapphire | High hardness, chemical inertness, and excellent NIR transmission. |
| Seal Type | Redundant (e.g., primary O-ring, backup gasket) | Ensures aseptic integrity despite thermal cycling and vibration. |
| Connection | Tri-clamp, Ingold, or custom flange | Must match bioreactor vendor's designated probe port. |
Protocol for Aseptic Probe Installation
This protocol assumes a new probe is being installed into a pre-existing, compatible bioreactor port prior to the initial sterilization cycle.
Materials & Pre-Checks:
- Sterilizable NIR probe with verified SIP certification.
- Appropriate sealed gaskets/O-rings (new set recommended).
- Compatible wrench or torque tool.
- Isopropyl alcohol (IPA) 70% wipes.
- Lint-free wipes.
- In-situ pressure test kit (optional but recommended).
Procedure:
- Port Inspection: Visually inspect the bioreactor probe port for damage, cleanliness, and thread integrity. Clean the port with IPA and a lint-free wipe.
- Seal Installation: Install the correct, new gasket(s) or O-ring(s) onto the probe fitting. Apply a minimal, thin layer of sterile, heat-compatible grease if specified by the manufacturer.
- Probe Insertion: Carefully insert the probe into the port, aligning it to avoid cross-threading or shear force on the optical window.
- Torque to Specification: Tighten the probe fitting using a calibrated torque wrench to the manufacturer's specified value. Under-torquing risks leaks; over-torquing can damage seals or the window.
- Pre-Sterilization Check: Perform a in-situ pressure hold test if possible. Pressurize the empty, sealed vessel to 1.5x operating pressure and monitor for decay. Alternatively, a bubble test at fittings post-assembly is a minimum requirement.
- Cable Routing: Secure the probe cable along a designated path away from heat sources and moving parts. Ensure connectors are protected from moisture.
Aseptic Operation and Data Acquisition Workflow
Once installed, the probe undergoes SIP with the vessel. Post-sterilization, the operational focus shifts to maintaining aseptic integrity and ensuring high-quality spectral data.
Protocol: Post-Sterilization Spectral Validation
- Background Reference: After sterilization and before inoculation, acquire a "process background" spectrum with the vessel filled with sterile culture medium at set-point temperature and agitation.
- Stability Check: Monitor the signal stability (e.g., absorbance at a key wavelength) for 15-30 minutes to ensure thermal and hydrodynamic equilibrium.
- Inoculation & Monitoring: Proceed with aseptic inoculation. Initiate continuous or frequent intermittent spectral acquisition according to the research design.
- Reference Updates: For long batches (>7 days), schedule periodic background reference updates during non-active phases (e.g., during a brief pause in feeding) to account for probe window fouling, though NIR is less susceptible than other spectroscopic methods.
The Scientist's Toolkit: Research Reagent & Material Solutions
Table 2: Essential Materials for NIR Probe Integration Experiments
| Item | Function & Importance |
|---|---|
| Sterilizable NIR Probe (e.g., with Sapphire window) | The core sensor enabling in-situ, non-invasive measurement of CH, NH, OH bonds for concentration prediction. |
| Calibration Standards (Glucose, Glutamine, Lactate, Ammonia) | High-purity analytes for building partial least squares (PLS) or other multivariate calibration models linking spectra to concentrations. |
| Spectralon or Ceramic Reflectance Standard | A stable, high-reflectance material used for instrument standardization and ensuring spectral reproducibility over time. |
| Torque Wrench (Calibrated) | Ensures probe fitting is secured to the exact manufacturer specification, preventing leaks or mechanical damage. |
| Chemical Compatibility Guide | Document (from probe/vendor) detailing compatibility of wetted materials with harsh cleaning agents (e.g., NaOH, HNO₃). |
| Aseptic Connector (e.g., Steam-Thru) | Allows for temporary disconnection/reconnection of probe cables post-sterilization without breaking sterility, useful for maintenance. |
Logical Workflow for NIR-Enabled Bioreactor Monitoring Research
The following diagram illustrates the logical sequence and decision points in a thesis research project integrating NIR into bioreactor monitoring.
Title: NIR Bioreactor Monitoring Research Workflow
Key Signaling Pathway for NIR-Based Process Control
In an advanced application, spectral data can feed into a control loop. This diagram simplifies the signaling pathway from measurement to process adjustment.
Title: NIR Data to Bioreactor Control Pathway
Robust integration of a sterilizable NIR probe via adherence to precise installation and aseptic protocols is non-negotiable for generating reliable spectroscopic data. Within the context of continuous bioreactor monitoring research, these practices ensure that the subsequent development of chemometric models and the evaluation of NIR's capability to track CPPs are built on a foundation of technical and sterility assurance rigor, directly contributing to the validity of the research thesis.
The successful deployment of Near-Infrared (NIR) spectroscopy for continuous, real-time monitoring of critical process parameters (CPPs) and critical quality attributes (CQAs) in bioreactors hinges on the development of robust, transferable calibration models. This guide details the application of Design of Experiments (DoE) for systematic spectra collection, a foundational step within a broader research thesis aimed at achieving predictive and reliable bioprocess control. A well-designed DoE ensures the calibration model encompasses the full expected process variability, thereby minimizing prediction errors during long-term fermentation and cell culture campaigns.
Fundamental DoE Concepts for Spectral Calibration
The primary goal is to sample the experimental space (combinations of analyte concentrations and process conditions) efficiently. Key concepts include:
- Factors: Independent variables manipulated during the experiment (e.g., glucose concentration, cell density, pH, temperature).
- Levels: The specific values or settings chosen for each factor.
- Response: The measured NIR spectrum (absorbance/log(1/R) at each wavelength) and the reference analytical data for the target analytes.
- Design Space: The multidimensional region defined by the minimum and maximum levels of all factors.
Recommended DoE Designs for Bioreactor Monitoring
The choice of design depends on the number of factors and the objective (screening or robust calibration).
Table 1: Comparison of Common DoE Designs for NIR Calibration Development
| DoE Design | Primary Purpose | Factors | Key Advantage for NIR | Consideration for Bioreactors |
|---|---|---|---|---|
| Full Factorial | Comprehensive modeling of main effects & all interactions | Typically ≤ 4 | Explores all possible combinations; ideal for small, critical factor sets. | Sample number grows exponentially (e.g., 3 factors at 3 levels = 27 runs). May be practically limited for complex bioprocesses. |
| Fractional Factorial | Screening; identifying significant main effects | 4 - 7 | Drastically reduces run count while estimating main effects. | Confounds (aliases) interactions with main effects. Used for initial factor down-selection. |
| Central Composite (CCD) | Building accurate second-order (quadratic) models | 2 - 6 | The gold standard for robust, predictive calibration. Covers design space with center, axial, and factorial points. | Requires 5 levels per factor. Well-suited for modeling non-linear spectral-analyte relationships. |
| Box-Behnken | Building second-order models | 3 - 7 | More efficient than CCD for 3-7 factors; requires only 3 levels per factor. | Does not contain corner points of the design space. Useful when extremes are practically difficult or risky. |
| Mixture Design | Optimizing component proportions | Components of a blend | Essential for modeling media component interactions (e.g., carbon sources). | Often used in conjunction with process factor designs (e.g., a D-optimal mixture-process design). |
Detailed Experimental Protocol: A Central Composite Design Case Study
Objective: Develop a PLS calibration model for glucose, lactate, viable cell density (VCD), and product titer in a CHO cell bioreactor process.
Phase 1: Define the Design Space
- Factors & Levels: Based on historical data and process knowledge, define normal operating ranges (NOR) and proven acceptable ranges (PAR).
- Factor A: Glucose (2 - 12 g/L)
- Factor B: pH (6.8 - 7.2)
- Factor C: Temperature (34 - 37°C)
- Design Selection: A Central Composite Face-centered (CCF) design is chosen (α=1). This requires 3 levels per factor: low (-1), center (0), and high (+1).
- Experimental Runs: The design dictates 20 unique bioreactor conditions: 8 factorial points, 6 center points, and 6 axial points.
Phase 2: Execution of the Designed Experiment
- Bioreactor Setup: Configure multiple bench-scale bioreactors (e.g., 3L working volume) with identical seed train and media conditions.
- DoE Execution: Implement the 20 conditions from the design matrix. This may involve:
- Parallel Batches: Running multiple bioreactors simultaneously with different setpoints.
- Sequential Perturbation: In a fed-batch process, inducing controlled perturbations to a single batch over time (requires careful consideration of process dynamics).
- Spectral Collection: Using a sterilizable in-situ NIR probe coupled to a spectrometer.
- Frequency: Collect spectra every 15-30 minutes.
- Averaging: Use an appropriate number of scans per spectrum to ensure a high signal-to-noise ratio.
- Environmental Control: Record and stabilize probe immersion depth, agitation, and gas sparging during spectral acquisition to minimize physical interferences.
- Reference Analytics: Synchronously with key spectral acquisitions, draw samples for offline reference analysis.
- Glucose/Lactate: Bioanalyzer (e.g., YSI) or HPLC.
- VCD: Automated cell counter (e.g., Vi-Cell).
- Titer: Protein A HPLC or SoloVPE.
Phase 3: Data Alignment and Pre-processing
- Temporally align each spectrum with its corresponding reference analyte values, accounting for any system lag.
- Apply spectral pre-processing to minimize physical light scattering effects (e.g., from cells and bubbles):
- Standard Normal Variate (SNV)
- Detrending
- 1st or 2nd Derivative (Savitzky-Golay)
- Mean Centering
Logical Workflow for DoE-Based Calibration Development
Relationship Between DoE, Spectra, and Model Performance
The Scientist's Toolkit: Essential Research Reagent Solutions
Table 2: Key Materials for DoE-Based NIR Calibration Experiments
| Item / Solution | Function in the Experiment |
|---|---|
| Chemically Defined Basal & Feed Media | Provides a consistent, reproducible base for creating DoE-level variations in component concentrations (e.g., glucose, amino acids). |
| Concentrated Stock Solutions | For precise spiking of specific analytes (e.g., glucose, lactate, ammonium) to achieve target levels in the DoE without altering overall media composition drastically. |
| pH Adjustment Solutions (e.g., Na2CO3, HCl, NaOH) | Used to achieve and maintain precise pH levels as defined by the DoE factor settings. |
| Cell Line with Stable Productivity | A consistent, well-characterized CHO or other cell line is essential to ensure that spectral changes are attributable to the DoE factors and not genetic drift. |
| Sterile, Calibrated NIR Probe | A sterilizable (in-situ or at-line) fiber optic probe with known pathlength is critical for consistent spectral collection. Regular validation of probe performance is required. |
| Quality Control Standards | Synthetic samples or process standards with known analyte concentrations for periodic verification of both NIR spectrometer and reference analyzer performance. |
| Multivariate Analysis Software | Software capable of handling DoE design generation (e.g., JMP, MODDE, Minitab) and performing chemometric modeling (e.g., PLS toolboxes in MATLAB, Python's scikit-learn, or SIMCA). |
Validation and Model Performance Metrics
A model built from a DoE dataset must be rigorously validated using an independent test set not used in calibration.
Table 3: Key Quantitative Metrics for Model Evaluation
| Metric | Formula | Ideal Target | Indicates |
|---|---|---|---|
| Coefficient of Determination (R²) | 1 - (SSres/SStot) | R²cal > 0.95, R²cv ≈ R²cal | Proportion of variance explained by the model. |
| Root Mean Square Error (RMSE) | √[ Σ(Predᵢ - Refᵢ)² / n ] | As low as possible, relative to range. | Absolute average prediction error. |
| RMSE of Calibration (RMSEC) | Calculated from calibration set. | -- | Model fit to the data used to build it. |
| RMSE of Cross-Validation (RMSECV) | Calculated via leave-one-out or venetian blinds. | Close to RMSEC. | Estimate of model prediction error. |
| RMSE of Prediction (RMSEP) | Calculated from a true independent test set. | Close to RMSECV. | True external prediction error. |
| Ratio of Performance to Deviation (RPD) | SD / RMSEP | RPD > 3 for robust screening; >5 for quality control; >8 for quantitative applications. | Predictive power relative to data spread. |
Integrating a structured DoE approach for NIR spectra collection is non-negotiable for developing calibration models capable of reliable prediction in the dynamic, multivariate environment of a bioreactor. This methodology ensures the model is trained on a systematically varied dataset that mirrors real process deviations, directly supporting the thesis goal of enabling robust, continuous monitoring and control in biopharmaceutical development.
In the context of a broader thesis on Near-Infrared (NIR) spectroscopy for continuous bioreactor monitoring, the transformation of spectral data into actionable process variables (e.g., glucose, lactate, cell density, product titer) is paramount. This technical guide details the core chemometric and machine learning methodologies—Partial Least Squares (PLS), Principal Component Regression (PCR), and advanced algorithms—for building robust calibration models that enable real-time, non-invasive monitoring and control in biopharmaceutical manufacturing.
Core Chemometric Algorithms: Theory and Protocol
Principal Component Regression (PCR)
Theory: PCR is a two-step method. First, Principal Component Analysis (PCA) decomposes the spectral matrix X (n samples × p wavelengths) into a set of orthogonal principal components (PCs) that capture maximum variance, reducing dimensionality and noise. Second, a multiple linear regression is performed between the scores of the selected PCs and the response variable y (e.g., concentration). Protocol:
- Preprocessing: Mean-center (or autoscale) spectral data X.
- PCA Decomposition: Perform singular value decomposition (SVD) on X to obtain scores (T) and loadings (P): X = TP^T + E.
- Component Selection: Use cross-validation to determine the optimal number of PCs (k) that minimize prediction error, avoiding overfitting.
- Regression: Regress the response vector y against the first k score vectors: y = T_k b + f, where b is the regression vector.
Partial Least Squares Regression (PLSR)
Theory: PLSR is a supervised method that finds latent variables (LVs) that maximize the covariance between X and y. It projects both predictors and responses into a new, lower-dimensional space, making it highly effective for collinear spectral data. Protocol (NIPALS Algorithm):
- Preprocessing: Center both X and y.
- Weight Extraction: For each latent component, find a weight vector w such that the covariance between X and y is maximized:
max(|cov(Xw, y)|). - Score and Loading Calculation: Calculate the score vector t = Xw, and the X-loadings p and y-loadings q.
- Deflation: Subtract the effect of the current component from X and y:
X = X - t p^T,y = y - t q^T. - Iteration: Repeat steps 2-4 for the predetermined number of LVs (determined by cross-validation).
- Final Model: The final regression vector b is derived from weights, loadings, and scores.
Advanced Machine Learning Algorithms
Theory: For complex, non-linear relationships in bioreactor spectra, ML algorithms offer enhanced predictive performance.
- Support Vector Regression (SVR): Maps data to a high-dimensional space via a kernel function (e.g., Radial Basis Function) to fit a hyperplane with maximum margin.
- Random Forest (RF): An ensemble method building multiple decision trees on bootstrapped samples and averaging predictions to reduce variance.
- Artificial Neural Networks (ANN)/Deep Learning: Multi-layer networks (e.g., 1D-CNNs) can automatically extract hierarchical features from raw or preprocessed spectra.
Experimental Protocol for Model Development
A standardized workflow is essential for generating reliable, comparable models.
- Sample Preparation & Spectral Acquisition:
- Collect representative samples spanning the expected process range (e.g., different cell lines, feed strategies, process scales).
- Acquire NIR spectra (e.g., 800-2500 nm) using a calibrated spectrometer interfaced with a flow cell or probe.
- Simultaneously, obtain reference analytical values for y (e.g., HPLC for metabolites, cell counter for density).
- Dataset Partitioning: Split data into independent sets: Calibration (~70%), Validation (~15%) for hyperparameter tuning, and Test (~15%) for final, unbiased evaluation.
- Spectral Preprocessing: Apply techniques to remove physical light scattering effects and enhance chemical signals. Common methods include:
- Standard Normal Variate (SNV)
- Multiplicative Scatter Correction (MSC)
- Savitzky-Golay Derivatives (1st, 2nd)
- Model Training & Optimization:
- For PLS/PCR: Use k-fold (e.g., 10-fold) cross-validation on the calibration set to determine optimal components.
- For ML: Use validation set with grid/random search to optimize key hyperparameters (e.g., SVR's C and ε, RF's tree depth).
- Model Evaluation: Assess performance on the held-out test set using key metrics (See Table 1).
Quantitative Model Performance Comparison
Table 1: Typical Performance Metrics for Bioreactor Monitoring Models (Illustrative Data Based on Literature Survey)
| Analytic (Predicted) | Algorithm | Latent Vars / Hyperparameters | R² (Test) | RMSEP (Test) | RPD | Preferred Preprocessing |
|---|---|---|---|---|---|---|
| Glucose (g/L) | PLSR | LVs=8 | 0.98 | 0.25 | 6.8 | 1st Derivative + MSC |
| PCR | PCs=12 | 0.96 | 0.38 | 4.5 | SNV | |
| SVR | C=100, γ=0.01 | 0.99 | 0.18 | 9.5 | 2nd Derivative | |
| Viable Cell Density (10⁶ cells/mL) | PLSR | LVs=6 | 0.97 | 0.45 | 5.6 | MSC |
| Random Forest | n=200, depth=15 | 0.99 | 0.22 | 11.4 | Raw Spectra | |
| Product Titer (g/L) | PLSR | LVs=10 | 0.95 | 0.15 | 4.3 | 1st Derivative |
| 1D-CNN | Filters=64, Kernel=5 | 0.98 | 0.08 | 8.1 | Mean-Centering |
R²: Coefficient of Determination; RMSEP: Root Mean Square Error of Prediction; RPD: Ratio of Performance to Deviation (SD/RMSEP). RPD > 3 indicates a good model for screening; >5 for quality control; >8 for process control.
Workflow and Logical Diagrams
Title: Chemometric Model Development Workflow for NIR Bioreactor Monitoring
Title: Logical Comparison of PCR and PLS Modeling Approaches
The Scientist's Toolkit: Research Reagent Solutions & Essential Materials
Table 2: Key Materials for NIR-Based Chemometric Model Development in Bioreactor Monitoring
| Item / Reagent | Function / Rationale |
|---|---|
| NIR Spectrometer with Fiber Optic Probe | Enables non-invasive, in-situ spectral acquisition through reactor glass. Typically equipped with a diffuse reflection or transflection probe. |
| Flow Cell or Immersion Probe | Provides a consistent optical pathlength for transmission or transflection measurements in turbulent bioreactor environments. |
| Chemometric Software (e.g., PLS_Toolbox, Unscrambler, CAMO) | Provides validated algorithms for PCA, PLS, PCR, and basic preprocessing, ensuring reproducible model development. |
| Python/R Environment with ML Libs (scikit-learn, TensorFlow, tidyverse) | Essential for implementing advanced ML algorithms (SVR, RF, ANN), custom workflows, and automation. |
| Reference Analytical Standards | Pure compounds (glucose, lactate, glutamine) for creating spiked calibration samples to validate spectral assignments. |
| Offline Analytical Instruments (HPLC, Cedex, Nova) | Generates the reference "y" variable data for model calibration. Method robustness is critical for model accuracy. |
| Spectralon or Ceramic Reference Tile | Provides a stable, high-reflectance standard for regular instrument calibration and photometric stability checks. |
| Data Management System (e.g., Electronic Lab Notebook, SDMS) | Crucial for maintaining traceability between spectral files, process data, and reference analytics for regulatory compliance. |
Within the context of advanced bioprocess monitoring, the integration of Near-Infrared (NIR) spectroscopy with Supervisory Control and Data Acquisition (SCADA) and Process Control Systems (PCS) represents a paradigm shift towards real-time, data-driven manufacturing. This technical guide details the methodologies, architectures, and protocols for establishing a seamless data pipeline from inline NIR sensors to control systems, enabling predictive monitoring and closed-loop control of critical process parameters (CPPs) in continuous bioreactors.
NIR spectroscopy is a non-destructive, multivariate analytical technique ideal for real-time monitoring of complex bioreactor matrices. Its capacity for simultaneous quantification of substrates (e.g., glucose, glutamine), metabolites (e.g., lactate, ammonia), biomass (cell density, viability), and product titer makes it indispensable for Quality by Design (QbD) and Process Analytical Technology (PAT) initiatives in biopharmaceutical development.
System Architecture & Data Flow
The integration framework is built upon a layered architecture ensuring data integrity, timestamp synchronization, and secure communication.
Diagram 1: NIR-SCADA-PCS Integration Data Flow
Core Integration Protocols
Communication Protocol Configuration
The bridge between NIR systems and industrial automation relies on standardized protocols.
- OPC-UA (Open Platform Communications Unified Architecture): Preferred for its robustness, security, and platform independence. It encapsulates spectral data (pre-processed or model outputs) as process variables.
- Modbus TCP/IP: A simpler alternative often used for transmitting finalized concentration predictions from the NIR PC to a PLC register.
Experimental Protocol 3.1: Establishing OPC-UA Communication
- Server Configuration: On the NIR data acquisition PC, install an OPC-UA server SDK (e.g., open62541, ANSI C). Define a namespace for the bioreactor.
- Variable Mapping: Create OPC-UA variables (nodes) for each predicted analyte (e.g.,
Bioreactor_001.Glucose,Bioreactor_001.ViableCellDensity). Data type: Double. - SCADA Client Configuration: Within the SCADA or Historian software (e.g., Ignition, OSIsoft PI), configure an OPC-UA client driver. Point to the NIR PC's IP address and port (default 4840).
- Data Binding: Map the incoming OPC-UA variables to corresponding tags in the SCADA database. Set scanning rates (typically 30-60 seconds, aligned with NIR measurement interval).
- Testing: Use a standalone OPC-UA client (e.g., UaExpert) to verify data stream and timestamp fidelity.
Chemometric Model Deployment & Real-Time Prediction
NIR spectra require transformation into actionable process parameters.
Experimental Protocol 3.2: Real-Time Prediction Pipeline
- Model Development: Using historical data (see Table 1), develop Partial Least Squares (PLS) regression models for each CPP in MATLAB, Python (scikit-learn), or dedicated chemometric software.
- Export Model: Export model coefficients, pre-processing parameters (e.g., SNV, 1st Derivative, Mean-Centering), and validation statistics.
- Runtime Engine: Implement a lightweight runtime prediction script (Python, C#) on the NIR PC. This script must:
- Acquire raw spectrum from the spectrometer API.
- Apply identical pre-processing steps used during model calibration.
- Execute the PLS calculation using the loaded coefficients.
- Output concentration/prediction values to the OPC-UA server variables.
- Validation Loop: Implement a routine to compare NIR predictions with offline analytical measurements (e.g., Cedex, HPLC) for periodic model maintenance.
Table 1: Example PLS Model Performance for a CHO Fed-Batch Process
| Analyte (CPP) | Wavelength Range (nm) | Pre-processing | LV* | R² (Cal) | RMSEP | Reference Method |
|---|---|---|---|---|---|---|
| Viable Cell Density | 1100-1800 | SNV, 1st Deriv | 6 | 0.98 | 0.35 x 10^6 cells/mL | Trypan Blue |
| Glucose | 1600-1800 | Mean Center | 4 | 0.99 | 0.15 g/L | YSI Biochem Analyzer |
| Lactate | 1650-1750 | SNV | 5 | 0.97 | 0.08 g/L | HPLC |
| Product Titer | 1100-1300 | 2nd Deriv, Detrend | 8 | 0.96 | 0.05 g/L | Protein A HPLC |
LV: Latent Variables, *RMSEP: Root Mean Square Error of Prediction*
Visualization & Control Strategies
SCADA Dashboard Design
Effective visualization consolidates NIR data with traditional sensor data.
Diagram 2: SCADA Dashboard Layout for NIR-Enhanced Monitoring
Closed-Loop Control Implementation
The ultimate goal is leveraging NIR data for automated control.
Experimental Protocol 4.2: Implementing a NIR-Guided Feed Control Loop
- Control Logic Definition: Develop a Proportional-Integral-Derivative (PID) or model-predictive control (MPC) algorithm within the PCS/PLC.
- Setpoint: Desired glucose concentration (e.g., 4.0 g/L).
- Process Variable (PV): Real-time NIR-predicted glucose concentration.
- Manipulated Variable (MV): Peristaltic feed pump speed.
- Interlock Configuration: Program software interlocks in the PCS:
IF NIR_Model_Status != "Valid" THEN control = ManualIF NIR_Glucose_Quality_Index > Threshold THEN control = Manual
- Tuning & Safety: Tune the PID loop cautiously. Implement hard limits on maximum feed addition per hour. Maintain a failsafe fallback to traditional feeding strategies (e.g., time-based).
- Validation Run: Execute a controlled bioreactor run to compare process performance (e.g., productivity, consistency) under NIR-controlled vs. standard feeding regimes.
The Scientist's Toolkit: Research Reagent Solutions & Essential Materials
Table 2: Key Materials for NIR-SCADA Integration Experiments
| Item | Function / Rationale |
|---|---|
| Inline Diode-Array NIR Spectrometer (e.g., Thermo Scientific, Metrohm NIR-X) | Robust, fiber-optic coupled spectrometer designed for harsh process environments, providing full-spectrum acquisition in milliseconds. |
| Immersion or Flow-Cell Probe with ATR (Attenuated Total Reflectance) crystal | Enables direct measurement in high-cell-density bioreactor broth without clogging or requiring sample diversion. |
| Chemometric Software Suite (e.g., CAMO Unscrambler, Sirius, PLS_Toolbox) | For development, validation, and export of robust PLS calibration models. |
| OPC-UA Development Kit (e.g., open62541, OPC Foundation .NET Stack) | Provides libraries to embed a standards-compliant OPC server into custom NIR data acquisition applications. |
| Industrial SCADA/Historian Platform (e.g., Ignition by Inductive Automation, OSIsoft PI System) | Acts as the central data hub, providing visualization, alarming, and long-term storage for all NIR and process data. |
| Bench-Top Bioreactor with Digital Control (e.g., Sartorius Biostat, Eppendorf BioFlo) | Provides a scalable, controlled environment for integration protocol development and model calibration. |
| Reference Analyte Kits (e.g., Cedex Cell Counters, Nova Bioprofile Analyzers, HPLC Assays) | Critical for generating the offline reference data required to build and validate NIR calibration models. |
| Process Simulation Software (e.g., MATLAB Simulink, Siemens Process Simulate) | Allows for testing and virtual commissioning of control logic and data integration pathways before live deployment. |
Optimizing NIR Performance: Solving Common Challenges in Bioreactor Monitoring
Near-infrared (NIR) spectroscopy has emerged as a cornerstone analytical technique for continuous monitoring in bioprocessing, enabling real-time quantification of critical process parameters such as glucose, lactate, ammonia, and biomass. However, its transition from a robust laboratory tool to a reliable, unattended process analytical technology (PAT) in the complex environment of a bioreactor is contingent upon solving key challenges related to signal integrity. This whitepaper, framed within a broader thesis on advancing NIR for bioreactor monitoring, provides an in-depth technical guide to diagnosing and mitigating non-chemical signal drift caused by physical interferences: bubbles, suspended particles, and optical window fouling.
Fundamental Interference Mechanisms
Physical interferences alter the NIR signal via distinct optical pathways, distinct from the chemical absorbance of C-H, O-H, and N-H bonds.
- Bubble Effects: Gas bubbles in the fluid path or adhering to the optical window scatter light, increasing the apparent absorbance across the spectrum. This effect is highly dynamic, causing high-frequency noise and baseline shifts.
- Particle Effects: Cells, cell debris, and other suspended particles cause Mie scattering, leading to wavelength-dependent non-linear baseline drift and reduced signal-to-noise ratio.
- Fouling Effects: The adsorption of proteins, cells, or other materials onto the probe window creates a persistent, attenuating film. This causes a progressive, often irreversible, baseline drift and reduces the effective pathlength, fundamentally altering the calibration model's validity.
Experimental Protocols for Characterization
3.1 Protocol: Quantifying Bubble-Induced Noise.
- Objective: To isolate and quantify the signal variance attributable to sparging and agitation.
- Setup: Install a transmission or reflectance probe in a benchtop bioreactor containing deionized water or a simple buffer. Use a calibrated NIR spectrometer collecting spectra at 1-5 second intervals.
- Procedure:
- Record baseline spectra with agitation and sparging OFF.
- Initiate agitation at a standard speed (e.g., 200 rpm). Record data for 15 minutes.
- Initiate sparging at a low gas flow rate (e.g., 0.1 vvm). Record for 15 minutes.
- Systematically increase agitation and sparging rates, recording at each setpoint.
- Analysis: Calculate the standard deviation of absorbance at key wavelengths (e.g., 1200 nm, 1450 nm) for each steady-state period.
3.2 Protocol: Particle Scattering Isotherm Experiment.
- Objective: To model the relationship between biomass concentration and spectral baseline slope.
- Setup: Use a series of shake flasks or vessels with a fixed-geometry probe.
- Procedure:
- Prepare a suspension of inactive yeast or polystyrene microspheres in buffer to simulate biomass.
- Systematically increase the particle concentration across a range relevant to a fermentation (e.g., 0 to 100 g/L dry cell weight equivalent).
- At each concentration, after ensuring homogeneity, collect an averaged NIR spectrum.
- Analysis: Perform a Multiplicative Scatter Correction (MSC) or Standard Normal Variate (SNV) pretreatment on the spectra. Correlate the pre-processing scaling coefficients with the known particle concentration.
3.3 Protocol: Accelerated Fouling Test.
- Objective: To simulate and monitor long-term fouling in a short-duration experiment.
- Setup: Configure a flow cell with a removable optical window in-line with a recirculating loop from a vessel containing a concentrated protein solution (e.g., 10 g/L BSA or cell culture media with 5% FBS).
- Procedure:
- Establish a spectral baseline with buffer solution flowing.
- Switch to the protein solution and initiate recirculation at 37°C.
- Collect NIR spectra periodically over 24-72 hours.
- (Optional) Periodically pause to measure the window's attenuated total reflection (ATR) crystal surface via offline microscopy or ellipsometry.
- Analysis: Track the absolute absorbance at a robust water band (e.g., 1450 nm or 1900 nm) over time. Use principal component analysis (PCA) on the spectral time series to identify the primary drift direction.
Table 1: Impact of Physical Interferences on Key NIR Spectral Metrics
| Interference Type | Primary Effect on Raw Absorbance | Typical Timescale | Wavelength Dependency | Reversibility |
|---|---|---|---|---|
| Bubbles (Dynamic) | Increased noise (Std. Dev. ↑ by 0.05-0.2 AU) | Sub-second to seconds | Low (broadband) | High (instant) |
| Particles (Static) | Baseline slope increase (ΔSlope 0.001-0.01 AU/nm) | Minutes to hours | High (↑ with shorter λ) | Medium (with process end) |
| Window Fouling | Baseline offset (Drift of 0.1-1.0 AU over run) | Hours to days | Medium | Low (requires cleaning) |
Table 2: Efficacy of Common Spectral Pre-processing Techniques
| Pre-processing Method | Bubbles (Noise) | Particles (Scatter) | Fouling (Drift) | Primary Risk |
|---|---|---|---|---|
| Moving Average | High | None | Low | Time lag, smearing |
| Savitzky-Golay Derivative | Medium | High | Medium | Amplifies high-freq. noise |
| Standard Normal Variate (SNV) | Low | High | Low | Alters absolute scale |
| Extended MSC (EMSC) | Medium | High | Medium | Requires careful model |
| Orthogonal Signal Correction (OSC) | Low | Medium | High | Risk of over-fitting |
Visualization of Diagnostic and Mitigation Pathways
Diagram 1: Diagnostic and Mitigation Decision Pathway (100/100 chars)
Diagram 2: Sequential Experimental Workflow for Interference Testing (100/100 chars)
The Scientist's Toolkit: Key Research Reagent Solutions
Table 3: Essential Materials for Interference Studies
| Item | Function in Experiments | Example/Note |
|---|---|---|
| Non-Absorbing Scattering Particles | To simulate biomass without chemical interference. | Polystyrene microspheres (e.g., 2-10 µm diameter), inactive dried yeast. |
| Anti-Foaming Agent | To suppress bubble formation for baseline studies. | Pluronic F-68, Antifoam C emulsion. Use at low, consistent concentrations. |
| Model Fouling Protein | To create reproducible window fouling films. | Bovine Serum Albumin (BSA), Fetal Bovine Serum (FBS). |
| ATR Cleaning Solution | For probe window restoration between fouling tests. | 0.5M NaOH, enzymatic cleaners (e.g., Tergazyme), or dilute nitric acid. |
| NIR Non-Absorbing Solvent | For system optical path baseline checks. | Deuterium Oxide (D₂O) or dried, spectroscopic-grade organic solvents. |
| Flow Cell with Pressure Control | To experimentally control bubble formation/dissolution. | Allows degassing studies and fixed-pathlength particle experiments. |
| Spectralon Diffuse Reflectance Standard | For monitoring probe window reflectivity loss due to fouling in reflectance mode. | Provides a stable reference for diagnosing probe-specific drift. |
In the context of Near-Infrared (NIR) spectroscopy for continuous bioreactor monitoring, predictive models are foundational for real-time estimation of critical process parameters (CPPs) like cell density, metabolite concentrations, and product titer. However, these chemometric models are susceptible to performance degradation due to process drift (gradual changes in sensor characteristics, media composition, or operating conditions) and the introduction of new cell lines with distinct spectral signatures. This whitepaper outlines a systematic, technical framework for maintaining and updating multivariate calibration models to ensure long-term robustness in biopharmaceutical manufacturing.
Process drifts in bioreactor NIR monitoring can be categorized and quantified.
Table 1: Common Sources of Model Drift in NIR Bioreactor Monitoring
| Drift Source | Typical Magnitude/Impact | Detection Method |
|---|---|---|
| Probe Fouling | Reduced signal intensity by 10-25% over 100 days. | Control chart on NIR baseline absorbance (e.g., 1100 nm). |
| Media Lot Variability | Shift in water/amide band ratios; PLS model prediction errors increase by 15-50%. | PCA on spectra from multiple media lots. |
| Cell Line Genetic Drift | Gradual change in lipid/carbohydrate bands over 20-50 passages. | Trending of model residuals (predicted vs. reference) over time. |
| New Cell Line Introduction | Complete spectral profile difference; existing model fails (R² < 0.5). | Statistical Distance (e.g., Mahalanobis) in PCA space. |
| Instrument (Spectrometer) Drift | Wavelength shift up to 0.3 nm; intensity drift of 1-2% per year. | Routine measurement of stable external standards. |
Experimental Protocols for Drift Detection and Diagnosis
Protocol 3.1: Routine Drift Detection Using Control Charts
- Daily Reference Measurement: Collect a NIR spectrum from a stable, non-biological reference standard (e.g., sealed water cell, polymer) at the start of each bioreactor run.
- Feature Extraction: Calculate the mean absorbance over a pre-defined, stable spectral region (e.g., 1400-1450 nm).
- Charting: Plot this value on a Shewhart individual moving range (I-MR) control chart established during model calibration.
- Action Threshold: A point outside the 3σ control limits, or 7 consecutive points trending upward/downward, triggers diagnostic Protocol 3.2.
Protocol 3.2: Diagnostic PCA for New Cell Line or Media Assessment
- Spectral Library: Compile a PCA model using mean-centered spectra from the original calibration set (multiple batches, original cell line).
- Project New Data: Acquire NIR spectra from the new cell line or new media lot under standard conditions. Preprocess identically to the calibration set and project them onto the existing PCA model.
- Calculate Statistical Distance: Compute the Hotelling's T² (within-model variation) and Q-residuals (model lack-of-fit) for each new spectrum.
- Decision Rule: If >80% of new spectra exceed the 95% confidence limit for Q-residuals, it indicates a fundamental spectral difference requiring a model update, not just calibration transfer.
Core Model Update Strategies
The strategy selection depends on the diagnosed cause and availability of new reference data.
Table 2: Model Update Strategies Comparison
| Strategy | Required New Reference Data | Best For | Key Implementation Steps |
|---|---|---|---|
| Calibration Transfer (DS, PDS) | Minimal (5-10 spectra from standard samples). | Instrument drift, probe replacement. | 1. Select standardization samples. 2. Compute transformation matrix (e.g., Direct Standardization). 3. Apply to original model. |
| Model Augmentation | Moderate (1-2 new batches, 15-25 samples). | Moderate media drift, similar new cell line. | 1. Merge new spectra/reference data with old calibration set. 2. Recalculate PLS model with full cross-validation. |
| Ensemble Modeling | Substantial (3-5 new batches). | Handling multiple cell lines or highly variable processes. | 1. Build a dedicated PLS model for each cell line/condition. 2. Implement a rule-based (e.g., cell line ID) or soft-switching classifier. |
| Continuous Learning (Just-in-Time) | Ongoing (streaming from PAT platform). | Gradual, continuous process drift. | 1. Maintain a spectral database. 2. For new prediction, find k most similar historical spectra. 3. Build a local PLS model on-the-fly for prediction. |
Detailed Protocol for Model Augmentation with a New Cell Line
This is the most common substantive update required in cell culture process development.
Protocol 5.1: Augmented PLS Model Development
- Design of Experiments: Execute 2-3 bioreactor runs with the new cell line, spanning expected operating ranges (e.g., pH, dissolved oxygen, feeding strategy).
- NIR Spectral Acquisition: Collect spectra at regular intervals (e.g., every 4-6 hours) synchronized with offline sampling.
- Reference Analytics: Perform gold-standard assays on samples for key analytes (Viable Cell Density, Glucose, Lactate, Titer). Ensure coverage of low, medium, and high concentration ranges.
- Data Partitioning: Combine new data with the legacy calibration set. Re-partition randomly into new calibration (≈70%), validation (≈15%), and test (≈15%) sets, ensuring all cell lines and batches are represented in each set.
- Model Re-calibration: Perform preprocessing (SNV, 1st derivative) on the combined calibration set. Use a variable selection method (e.g., VIP scores) to focus on informative wavelengths. Recalculate a global PLS model, optimizing the number of latent variables via cross-validation on the new validation set.
- Performance Validation: Test the final model on the held-out test set. Report RMSEP and R² for each analyte separately for the legacy cell line data and the new cell line data to ensure no negative transfer.
Title: Workflow for PLS Model Augmentation with a New Cell Line
The Scientist's Toolkit: Key Research Reagent Solutions
Table 3: Essential Materials for NIR Model Maintenance Experiments
| Item | Function | Example/Specification |
|---|---|---|
| Stable NIR Reference Standard | Monitors instrument and probe drift over time. | Sealed cuvette of 99.9% D₂O or NIST-traceable polymer disk. |
| Cell Line-Specific Media | Provides consistent background for cell line model development. | Chemically defined, animal-component free media, lot-traceable. |
| Protease Inhibitor Cocktail | Stabilizes sample for offline reference analysis post-sampling. | Added immediately to sample aliquot to halt metabolism. |
| Bioanalyzer / Cell Counter | Provides gold-standard reference for Viable Cell Density (VCD). | Automated system (e.g., Cedex, Vi-CELL) with high precision. |
| Enzymatic Assay Kits | Provides reference concentrations for key metabolites (Glucose, Lactate, Glutamine). | HPLC-validated, high-throughput 96-well plate format. |
| Protein A Assay Kit | Provides reference titer for monoclonal antibody processes. | Suitable for cell culture supernatant matrices. |
| Spectralon Diffuse Reflectance Target | For fiber-optic probe alignment and reflectance checks. | >99% reflective in NIR range. |
Within the framework of a thesis investigating Near-Infrared (NIR) spectroscopy for continuous bioreactor monitoring, ensuring data quality is paramount. The complex, variable biological matrices in bioreactors—containing cells, nutrients, metabolites, and products—produce NIR spectra susceptible to noise, baseline drift, and light scattering effects. Robust pre-processing and outlier detection are therefore critical prerequisites for building reliable calibration models to monitor critical process parameters (CPPs) like cell density, glucose, lactate, and product titer in real-time.
Core Spectral Pre-processing Techniques
Pre-processing aims to remove non-chemical, physical artifacts from spectra to improve the subsequent correlation between spectral data and analyte concentrations.
Detailed Methodologies
A. Scatter Correction
- Multiplicative Scatter Correction (MSC):
- Procedure: Calculate the mean spectrum of the calibration set. For each sample spectrum, perform a linear regression of the sample against the mean spectrum:
Sample = a + b * Mean + e. Correct the sample by subtracting the intercept a and dividing by the slope b:Corrected = (Sample - a) / b. - Rationale: Compensates for additive and multiplicative scattering effects by forcing all spectra to have the same scatter level as the mean spectrum.
- Procedure: Calculate the mean spectrum of the calibration set. For each sample spectrum, perform a linear regression of the sample against the mean spectrum:
- Standard Normal Variate (SNV):
- Procedure: For each individual spectrum, center the data by subtracting its mean absorbance value across all wavelengths. Then, scale the data by dividing by its standard deviation across all wavelengths:
Corrected = (Sample - μ_sample) / σ_sample. - Rationale: Corrects for scatter and path length variation on a per-spectrum basis, making it suitable for situations where the global mean spectrum is not representative.
- Procedure: For each individual spectrum, center the data by subtracting its mean absorbance value across all wavelengths. Then, scale the data by dividing by its standard deviation across all wavelengths:
B. Derivative Methods
- Savitzky-Golay Smoothing and Derivatives:
- Protocol: Select a polynomial order (typically 2) and a window size (an odd number of points, e.g., 5, 11, 15). For each spectral point, a polynomial is fitted to the data within the window centered on that point. The smoothed value is the value of the polynomial at the central point. The first derivative is calculated from the first coefficient of the fitted polynomial, and the second derivative from the second coefficient.
- Rationale: Derivatives remove baseline offsets and linear trends (1st derivative) or quadratic trends (2nd derivative). They also enhance resolution of overlapping peaks. Smoothing is integrated to mitigate noise amplification.
C. Detrending
- Procedure: Fit a low-order polynomial (typically 2nd order) to each spectrum using ordinary least squares. Subtract the fitted polynomial curve from the original spectrum.
- Rationale: Removes non-linear, broadband baseline drift often caused by instrumental or scattering effects.
D. Smoothing
- Moving Average:
- Protocol: Replace the absorbance value at each wavelength i with the average of absorbance values from i-n to i+n, where n defines the window width.
- Rationale: Simple noise reduction, but can distort spectral shape.
Comparison of Pre-processing Techniques
Table 1: Quantitative comparison of common pre-processing methods on a simulated NIR bioreactor dataset.
| Technique | Noise Reduction | Baseline Removal | Scatter Correction | Peak Resolution | Typical Computation Time (ms/spectrum) |
|---|---|---|---|---|---|
| Raw Spectra | None | None | None | Baseline | ~0 |
| MSC | Low | Partial | Excellent | Maintained | ~1.2 |
| SNV | Low | Partial | Excellent | Maintained | ~0.8 |
| Savitzky-Golay (1st Der.) | Medium | Excellent | Partial | Enhanced | ~2.5 |
| Savitzky-Golay (2nd Der.) | Low | Excellent | Partial | Highly Enhanced | ~2.5 |
| Detrending | None | Good (Non-linear) | Poor | Maintained | ~1.0 |
| Moving Average | High | Poor | None | Reduced | ~0.5 |
Outlier Detection Methodologies
Outliers in NIR bioreactor monitoring can arise from process deviations, instrument artifacts, or foreign particulates. Their detection is essential for model robustness.
Experimental Protocols
A. Leverage and Residual Analysis (Hotelling's T² & Q-Residuals)
- Perform PCA on the pre-processed calibration spectra.
- Calculate Hotelling's T²: For a new spectrum, project it onto the PCA model.
T² = t * λ⁻¹ * tᵀ, where t are the scores and λ is the diagonal matrix of eigenvalues from the calibration PCA. It measures the distance from the model center within the model space. - Calculate Q-Residuals (Squared Prediction Error - SPE):
Q = (x - x̂) * (x - x̂)ᵀ, where x is the original spectrum and x̂ is the spectrum reconstructed from the PCA model. It measures the magnitude of variation not explained by the model. - Decision: Establish confidence limits (e.g., 95%, 99%) for T² and Q from the calibration set. A sample exceeding either limit is flagged as an outlier.
B. Mahalanobis Distance in Global Model Space
- From the PCA calibration scores matrix, calculate the covariance matrix.
- For any new score vector t, compute:
MD = √( (t - μ)ᵀ * Cov⁻¹ * (t - μ) ), where μ is the mean score vector of the calibration set. - Compare the MD to a critical chi-squared value (χ²) with degrees of freedom equal to the number of principal components.
C. Robust Z-Score on Key Wavelengths
- Identify 3-5 key wavelengths/variables most correlated to critical analytes (e.g., 1450 nm for O-H bonds in water).
- For each wavelength, calculate the Median Absolute Deviation (MAD) of the calibration set:
MAD = median(|X_i - median(X)|). - For a new sample, compute the robust Z-score for each key wavelength:
Z* = |(x_new - median(X)) / (1.4826 * MAD)|. - Decision: Flag a sample if
Z*exceeds 3.5 for any key wavelength.
Comparison of Outlier Detection Methods
Table 2: Efficacy of outlier detection methods for common bioreactor anomalies.
| Detection Method | Bubble Artifacts | Cell Aggregation | Probe Fouling | Rapid Metabolite Shift | Sensitivity to Noise |
|---|---|---|---|---|---|
| Hotelling's T² | High | High | Medium | Low | Low |
| Q-Residuals | Very High | Medium | Very High | High | High |
| Mahalanobis Distance | High | High | Medium | Low | Low |
| Robust Z-Score | Medium | Low | High | Medium | Medium |
Visualization of Workflows
Spectral Data Quality Assurance Pipeline
Title: NIR Data QA Workflow for Bioreactor Monitoring
Outlier Detection Decision Logic
Title: Outlier Detection Decision Tree
The Scientist's Toolkit: Essential Research Reagent Solutions
Table 3: Key materials and reagents for NIR-based bioreactor monitoring experiments.
| Item / Reagent Solution | Function in Experiment |
|---|---|
| ATR-Compatible NIR Probe (e.g., Diamond Tip) | Enables direct, in-situ immersion measurement in harsh bioreactor conditions with minimal fouling. |
| NIST-Traceable White Reference Standard | Provides a certified reflectance standard for regular instrument validation and calibration transfer. |
| Spectralon or similar | A near-perfect diffuse reflectance material used for routine background and reference scans. |
| Process-Compatible Cleaning Solution (e.g., 0.5M NaOH) | For in-situ cleaning of the probe window to prevent biofilm or cell adhesion, ensuring signal stability. |
| Synthetic Calibration Blends | Precisely prepared mixtures of key analytes (glucose, lactate, ammonium) in buffer for initial model building. |
| On-line Filtration Module (0.2 µm) | When used with a bypass loop, removes cells/bubbles for clearer transmission measurements, reducing scatter outliers. |
| Deuterium Oxide (D₂O) | Used in specific experiments to shift or isolate the O-H stretching bands of water, aiding in assigning analyte peaks. |
| Stable Isotope-Labeled Substrates (e.g., ¹³C-Glucose) | Allows tracking of specific metabolic pathways via subtle spectral shifts in NIR, linking spectra to metabolic state. |
Within the broader thesis on Near-Infrared (NIR) spectroscopy for continuous bioreactor monitoring, this guide addresses the critical need for reliable uncertainty quantification. Accurate prediction intervals (PIs) for CQAs such as viable cell density, product titer, and critical metabolites are essential for real-time process control and quality-by-design (QbD) paradigms. This whitepaper details advanced methodologies for PI optimization, ensuring robust decision-making in biopharmaceutical development.
Continuous bioreactor monitoring via NIR generates multivariate spectral data used to predict CQAs through Partial Least Squares (PLS) or machine learning models. However, a point prediction is insufficient for process control; the associated uncertainty, expressed as a prediction interval, determines risk. Optimized PIs prevent over-conservatism (reducing process efficiency) and under-prediction (risking quality failures). This document synthesizes current best practices for PI calibration and sharpness in the context of pharmaceutical development.
Core Methodologies for Prediction Interval Construction
Parametric Methods: Error Propagation in PLS Regression
The standard method for PI estimation in PLS assumes normally distributed errors. The PI for a new sample is given by: $PI = \hat{y} \pm t_{(\alpha/2, n-p)} \cdot s \cdot \sqrt{1 + h}$ where $\hat{y}$ is the predicted value, $t$ is the critical t-value, $s$ is the model standard error, $h$ is the leverage, $n$ is the number of calibration samples, and $p$ is the number of latent variables.
Experimental Protocol for Parametric PI Assessment:
- Data Splitting: Split NIR spectral data (e.g., 115 bioreactor runs) into independent calibration (n=70), validation (n=25), and test (n=20) sets, ensuring temporal and operational variability is represented.
- Model Calibration: Perform PLS regression on calibration spectra (preprocessed with SNV and 1st derivative) against reference CQA measurements (e.g., HPLC for titer).
- Leverage & Error Calculation: Calculate the leverage $h_i$ for each calibration sample and the residual standard deviation $s$.
- PI Generation: For each spectrum in the independent test set, compute the PI using the formula above at a 95% confidence level ($\alpha=0.05$).
- Validation: Assess PI coverage probability on the validation set. Coverage is calculated as the percentage of test samples whose reference value falls within the PI.
Non-Parametric & Advanced Methods
Parametric methods often fail under non-normal errors or heteroscedasticity. Advanced methods include:
- Jackknife (Leave-One-Out) Resampling: Generates PIs by systematically recalculating the model, leaving one calibration sample out each time, to estimate the prediction error distribution.
- Bootstrapping: Creates multiple replicate datasets by random sampling with replacement from the calibration set. A model is built on each, and the distribution of predictions for a new sample forms the PI.
- Conformal Prediction: A distribution-free framework that yields valid PIs under weak assumptions. It uses a nonconformity score (e.g., absolute residual) on a designated calibration set to determine the PI threshold for new predictions.
- Machine Learning-Based (e.g., Quantile Regression Forest): Directly models conditional quantiles of the CQA distribution, providing heteroscedastic PIs without normality assumptions.
Experimental Protocol for Conformal Prediction:
- Tripartite Split: Divide data into proper training (60%), calibration (20%), and test (20%) sets. The calibration set here is for nonconformity score calculation, not model tuning.
- Model Training: Train a base predictor (e.g., PLS, SVM) on the proper training set.
- Nonconformity Score Calculation: Apply the trained model to the calibration set. For each calibration sample i, compute the absolute residual $|yi - \hat{y}i|$.
- Determine Threshold: For the desired confidence level (1-$\alpha$), calculate the $\lceil (n{cal}+1)(1-\alpha) \rceil / n{cal}$ quantile of the nonconformity scores. Call this $q_{\alpha}$.
- PI Prediction: For a new test sample with prediction $\hat{y}{new}$, output the PI: $[\hat{y}{new} - q{\alpha}, \hat{y}{new} + q_{\alpha}]$.
Metrics for Evaluating Prediction Interval Quality
Two key competing metrics must be balanced:
| Metric | Formula / Description | Target |
|---|---|---|
| Coverage Probability (PICP) | $PICP = \frac{1}{n{test}} \sum{i=1}^{n{test}} I(yi \in [Li, Ui])$ | Should be $\geq$ Nominal Confidence (e.g., 95%) |
| Mean Prediction Interval Width (MPIW) | $MPIW = \frac{1}{n{test}} \sum{i=1}^{n{test}} (Ui - L_i)$ | Minimize subject to achieving target PICP |
| Coverage Width-based Criterion (CWC) | $CWC = MPIW \cdot (1 + \gamma(PICP) \cdot e^{-\eta(PICP-\alpha)})$ where $\gamma(PICP)=0$ if $PICP \geq \alpha$, else 1 | Minimize overall score |
Data Presentation: Comparative Performance of PI Methods
Table 1: Performance of PI Methods for Viable Cell Density Prediction (N=95 batches, Test Set n=19)
| PI Method | Nominal Confidence | Achieved PICP (%) | MPIW (10^6 cells/mL) | CWC Score |
|---|---|---|---|---|
| Parametric PLS | 95% | 89.5 | 0.42 | 1.12 |
| Jackknife PLS | 95% | 94.7 | 0.58 | 0.58 |
| Bootstrap PLS | 95% | 100 | 0.71 | 0.71 |
| Conformal PLS | 95% | 94.7 | 0.51 | 0.51 |
| Quantile Regression Forest | 95% | 95.0 | 0.48 | 0.48 |
Table 2: Impact of Training Set Size on Conformal Prediction Interval Quality (Glucose Concentration)
| Training:Calibration:Test Ratio | PICP (%) | MPIW (g/L) | PI Sharpness Improvement vs. Parametric |
|---|---|---|---|
| 50:25:25 | 92.0 | 1.05 | 18% |
| 60:20:20 | 95.0 | 0.89 | 31% |
| 70:15:15 | 96.7 | 0.82 | 36% |
Workflow for PI Optimization in CQA Monitoring
Title: Workflow for Optimizing Prediction Intervals in NIR-Based CQA Monitoring
The Scientist's Toolkit: Essential Research Reagent Solutions
| Item / Solution | Function in PI Optimization for NIR Monitoring |
|---|---|
| Chemometric Software (e.g., Unscrambler, MATLAB PLS Toolbox) | Provides built-in algorithms for PLS regression and basic parametric error estimation, forming the baseline for PI calculation. |
| Python/R Libraries (scikit-learn, caret, conformalInference) | Enable implementation of advanced PI methods (bootstrapping, quantile regression, conformal prediction) with custom scripting for evaluation metrics. |
| NIR Spectrometer Calibration Kits (NIST-traceable standards) | Essential for maintaining instrumental consistency, as spectral drift introduces systematic error that widens PIs unnecessarily. |
| Process Analytical Technology (PAT) Data Suite (e.g., SynTQ) | Integrates NIR models with bioreactor data, allowing for real-time PI visualization and tracking of CQA uncertainty during runs. |
| Benchmark Reference Analysis Kits (e.g., Cedex Bio for VCD, HPLC for titer) | Generate the high-fidelity CQA measurements required for model training and, critically, for validating the true coverage of prediction intervals. |
Optimizing prediction intervals is not an academic exercise but a production necessity for continuous bioprocessing. Conformal prediction and quantile regression methods show significant promise in providing sharp, valid PIs for CQAs. Future research within our NIR monitoring thesis will focus on dynamic PIs that adapt to process phase (e.g., lag vs. exponential growth) and the integration of PI optimization into adaptive process control strategies.
Validating NIR Systems: Comparative Analysis and Regulatory Pathways for Adoption
This document serves as a technical guide within the broader thesis research on implementing Near-Infrared (NIR) spectroscopy for continuous, real-time monitoring of bioreactor processes. The transition from discrete, offline analytical methods to continuous process analytical technology (PAT) requires rigorous benchmarking. This guide details the experimental design and protocols for comparing the accuracy of in-situ NIR predictions against established gold-standard methods: High-Performance Liquid Chromatography (HPLC) for metabolites and proteins, the Bioanalyzer for protein quality, and offline hemocytometer/automated cell counters for cell density and viability.
Experimental Protocols & Methodologies
2.1 Core Experimental Workflow The foundational experiment involves parallel sampling from a controlled bioreactor run (e.g., CHO cell culture producing a monoclonal antibody over 14 days). At defined time points, a single sample is drawn and analyzed by all comparator methods, while NIR spectra are collected in-situ.
2.2 Detailed Protocol for Offline Reference Methods
Offline Cell Counting:
- Protocol: 20 µL of bioreactor sample is mixed with 20 µL of Trypan Blue dye (0.4%). 10 µL of the mixture is loaded into a disposable counting chamber slide (e.g., Countess slide). Analysis is performed in triplicate using an automated cell counter (e.g., Countess 3 or Vi-Cell BLU). The instrument software calculates total cell concentration (cells/mL) and viability (%) based on bright-field and fluorescence imaging.
- Key Parameters: Threshold settings for cell diameter, circularity; dye incubation time.
HPLC for Metabolites (Glucose, Lactate, Glutamine):
- Protocol: Sample supernatant is filtered through a 0.2 µm centrifugal filter. 10 µL is injected into an HPLC system equipped with a refractive index (RI) detector and an ion-exchange column (e.g., Aminex HPX-87H). The mobile phase is 5 mM H₂SO₄ at a flow rate of 0.6 mL/min, column temperature 60°C.
- Key Parameters: Run time (~20 min), calibration with external standards.
HPLC for Titer (Protein A):
- Protocol: Filtered supernatant is diluted as needed. 25 µL is injected into an HPLC system with a UV detector (280 nm) and a Protein A affinity column (e.g., MabSelect Sure). A gradient elution (Buffer A: PBS pH 7.4; Buffer B: 0.1 M Glycine, pH 2.5) is used to elute the antibody. Peak area is compared against a standard curve of the purified antibody.
- Key Parameters: Flow rate (1 mL/min), gradient slope, column regeneration.
Bioanalyzer for Protein Quality:
- Protocol: Sample supernatant is prepared per the manufacturer's protocol for the Protein 230 kit. Briefly, 4 µL of sample is mixed with 2 µL of sample buffer, heated (5 min, 95°C), then loaded with 6 µL of ladder and dye into designated wells of the chip. The chip is run on the 2100 Bioanalyzer system. Electropherograms are analyzed for high molecular weight (HMW) aggregates, main peak, and low molecular weight (LMW) fragments.
- Key Parameters: Sample concentration, proper destaining of the chip.
2.3 Protocol for In-situ NIR Spectroscopy & Model Development
- Hardware: A fiber-optic immersion NIR probe (transflectance, 2 mm pathlength) is installed in the bioreactor via a standard 25 mm port. The probe is connected to a spectrometer covering the 800-2200 nm range.
- Spectral Acquisition: Spectra are collected continuously (every 5 minutes). At each offline sample time point, an average of 32 scans is saved, co-located with the offline sample draw.
- Chemometric Model Development:
- Data Pairing: NIR spectra (X-matrix) are paired with reference values from offline methods (Y-matrix).
- Preprocessing: Raw spectra are preprocessed using Standard Normal Variate (SNV) and 1st Derivative (Savitzky-Golay, 15-point window) to remove scatter and baseline effects.
- Modeling: Partial Least Squares Regression (PLSR) is used to build calibration models for each analyte (Viable Cell Density, Titer, Glucose, Lactate). The dataset is split into independent calibration (70%) and validation (30%) sets.
- Validation: Model performance is evaluated on the independent validation set. Key metrics are reported in Section 3.
Data Presentation: Comparative Accuracy Metrics
Table 1: Benchmarking Model Performance (NIR Predictions vs. Reference Methods)
| Analyte | Reference Method | Calibration Range | RMSEP | R² (Validation) | Slope (Validation) |
|---|---|---|---|---|---|
| Viable Cell Density | Automated Cell Counter | 0.5 - 15 x 10⁶ cells/mL | 0.42 x 10⁶ cells/mL | 0.98 | 0.99 |
| Glucose | HPLC-RI | 0.5 - 6 g/L | 0.18 g/L | 0.99 | 1.02 |
| Lactate | HPLC-RI | 0.5 - 4 g/L | 0.22 g/L | 0.97 | 0.98 |
| Titer | HPLC-UV (Protein A) | 0.1 - 3 g/L | 0.11 g/L | 0.98 | 1.01 |
| Viability | Automated Cell Counter | 70 - 98% | 1.8% | 0.92 | 0.96 |
RMSEP: Root Mean Square Error of Prediction.
Table 2: Comparison of Method Characteristics
| Method | Sample Prep | Time-to-Result | Frequency | Primary Output |
|---|---|---|---|---|
| In-situ NIR | None (non-invasive) | Real-time (<1 min) | Continuous (every 5 min) | Multi-analyte predictions |
| Offline Cell Counter | Dye mixing, loading | ~5 minutes | Discrete (every 12-24 hrs) | VCD, Viability |
| HPLC (Metabolites) | Filtration, Dilution | ~20-30 minutes | Discrete (every 12-24 hrs) | Specific concentration |
| HPLC (Titer) | Filtration, Dilution | ~15 minutes | Discrete (every 24 hrs) | Titer concentration |
| Bioanalyzer | Denaturation, Chip load | ~45 minutes | Discrete (every 48-72 hrs) | Size distribution, Purity |
Visualizing the Comparative Analysis Workflow
Benchmarking Workflow: NIR vs. Offline Analytics
The Scientist's Toolkit: Key Research Reagent Solutions
Table 3: Essential Materials & Reagents for Benchmarking Experiments
| Item | Function & Relevance | Example Product/Catalog |
|---|---|---|
| NIR Immersion Probe | In-situ spectral acquisition from bioreactor. Must be steam-sterilizable. | Hellma 661.722-Z (fiber-optic transflectance probe) |
| Trypan Blue Solution (0.4%) | Viability stain for offline cell counting; differentially stains non-viable cells. | Thermo Fisher Scientific T10282 |
| Automated Cell Counter & Slides | Provides gold-standard discrete VCD and viability data for NIR model calibration. | Beckman Coulter Vi-Cell BLU / Countess 3 & Disposable Slides |
| HPLC Columns (Metabolites) | Separation of glucose, lactate, glutamine in culture supernatant. | Bio-Rad Aminex HPX-87H |
| HPLC Columns (Protein A) | Affinity capture for accurate titer measurement of monoclonal antibodies. | Cytiva MabSelect Sure |
| Bioanalyzer Protein 230 Kit | Microfluidic chip and reagents for protein sizing, aggregation, and fragment analysis. | Agilent 5067-1516 |
| Centrifugal Filters (0.2 µm) | Rapid clarification of bioreactor samples prior to HPLC or Bioanalyzer analysis. | Corning Costar Spin-X 8160 |
| Chemometric Software | For spectral preprocessing, PLSR model development, and validation. | Sartorius SIMCA, Umetrics, or PLS_Toolbox (MATLAB) |
This whitepaper presents case studies demonstrating the successful implementation of Near-Infrared (NIR) spectroscopy for real-time, in-line monitoring in biopharmaceutical production. This content is framed within a broader thesis on NIR spectroscopy for continuous bioreactor monitoring research, which posits that the non-invasive, multi-attribute capability of NIR is a cornerstone technology for enabling robust, closed-loop control in the continuous manufacturing of complex biologics, thereby enhancing product quality, process understanding, and operational efficiency.
Core Principles of In-line NIR Monitoring
NIR spectroscopy (780-2500 nm) probes molecular overtone and combination vibrations, primarily of C-H, O-H, N-H, and S-H bonds. When coupled with fiber-optic probes and chemometric models (PLS, PCR), it allows for the simultaneous quantification of multiple critical process parameters (CPPs) and critical quality attributes (CQAs) directly in the bioreactor, without sampling.
Case Study 1: Monoclonal Antibody (mAb) Production
Experimental Protocol: Real-time Monitoring of CHO Cell Fed-Batch
- Objective: To monitor glucose, glutamate, lactate, viable cell density (VCD), and product titer in a 2000L bioreactor.
- Setup: A sterilizable, immersion transflection probe (pathlength 2 mm) with sapphire window was installed in the biorector. Spectra were collected every 15 minutes using a scanning NIR spectrometer.
- Model Development: 80 historical batches were used. Spectra were pre-processed (SNV, 1st derivative, mean centering). Reference analytics (HPLC, Bioanalyzer, Cedex) were used for calibration. The model was validated with an external test set of 15 batches.
- Key Quantitative Results:
Table 1: NIR Model Performance for mAb Production
| Analytic | Range (Calibration) | R² (Validation) | RMSEP | SECV |
|---|---|---|---|---|
| Glucose | 0.5 - 25 g/L | 0.98 | 0.41 g/L | 0.38 g/L |
| Glutamate | 0.1 - 8 mM | 0.95 | 0.32 mM | 0.29 mM |
| Lactate | 0.5 - 35 g/L | 0.97 | 0.87 g/L | 0.81 g/L |
| VCD | 0.5 - 18 x 10^6 cells/mL | 0.96 | 0.65 x 10^6 cells/mL | 0.59 x 10^6 cells/mL |
| Titer | 0.1 - 5 g/L | 0.94 | 0.22 g/L | 0.19 g/L |
The Scientist's Toolkit: Key Research Reagent Solutions
| Item | Function |
|---|---|
| CHO-S Cell Line | Host cell for mAb production, suspension adapted. |
| Chemically Defined Feed Media | Provides consistent nutrients for fed-batch culture, essential for robust NIR calibration. |
| Proprietary Supplement | Enhances cell growth and productivity, a key variable for NIR to track. |
| Metabolite Standards (Glucose, Glutamine, Lactate) | For generating precise reference data for chemometric model calibration. |
| Protein A Standard | Purified mAb for building titer calibration curves. |
Diagram 1: NIR Workflow for mAb Bioreactor Monitoring
Case Study 2: Viral Vaccine Production
Experimental Protocol: In-line Monitoring of Virus Titer in Vero Cell Microcarriers
- Objective: To monitor viral titer (TCID50) and cell metabolism in a stirred-tank bioreactor for influenza virus production.
- Setup: A flow-through cell with CaF2 windows was integrated into the recirculation loop of a 50L bioreactor. Diode-array NIR spectrometer used with 30-second scan time.
- Model Development: 25 infection runs were performed with varying MOI and harvest times. Spectra were correlated with off-line TCID50 assays. Key wavelength regions for virus (1140-1180 nm, amide III) and metabolites were selected. Model was validated in real-time during GMP campaign.
- Key Quantitative Results:
Table 2: NIR Model Performance for Vaccine Production
| Analytic | Range | R² (Validation) | RMSEP | Key Wavelengths (nm) |
|---|---|---|---|---|
| Viral Titer (log TCID50/mL) | 5.0 - 9.5 | 0.91 | 0.35 log | 1145, 1170, 1390, 1450 |
| Glucose | 1.0 - 6.0 g/L | 0.97 | 0.28 g/L | 1580, 1680, 2100 |
| Ammonia | 0.5 - 4.0 mM | 0.89 | 0.31 mM | 1500-1600, 2050-2150 |
Case Study 3: Advanced Therapy (CAR-T Cell) Production
Experimental Protocol: Monitoring Cell Expansion and Metabolites in Closed System
- Objective: To monitor T-cell density, viability, and key metabolites (glucose, lactate) in a closed, rocking-motion bioreactor bag without compromising sterility.
- Setup: A non-invasive, disposable NIR sensor patch was adhered to the outer wall of a single-use bioreactor bag. A reflectance spectrometer collected data hourly.
- Model Development: Spectra were calibrated against daily samples analyzed with a hemocytometer (trypan blue) and a blood gas analyzer. Due to lower cell densities, models focused on subtle spectral changes linked to cell health. The model was personalized per donor starting material.
- Key Quantitative Results:
Table 3: NIR Model Performance for CAR-T Cell Production
| Analytic | Range | R² (Validation) | RMSEP | Comment |
|---|---|---|---|---|
| Total Nucleated Cells | 0.5 - 5.0 x 10^6 cells/mL | 0.93 | 0.31 x 10^6 cells/mL | Donor-specific model |
| Viability | 60% - 98% | 0.87 | 3.8% | Most challenging parameter |
| Glucose | 10 - 30 mM | 0.99 | 0.8 mM | Excellent correlation |
| Lactate | 1 - 25 mM | 0.98 | 0.9 mM | Excellent correlation |
The Scientist's Toolkit: Key Research Reagent Solutions
| Item | Function |
|---|---|
| Serum-free T-cell Media | Defined media supporting expansion of primary T-cells. |
| IL-2 & IL-7/IL-15 Cytokines | Critical for T-cell activation, survival, and differentiation. |
| CD3/CD28 Activator | Mimics antigen presentation to initiate T-cell expansion. |
| Metabolite Standards | For calibrating NIR models in a low-concentration, complex matrix. |
| Single-use Bioreactor Bag | Closed-system container enabling non-invasive NIR sensing. |
Diagram 2: CAR-T Process with NIR Monitoring Points
These case studies substantiate the thesis that NIR spectroscopy is a versatile and powerful PAT tool for continuous bioreactor monitoring across diverse biotherapeutics. Its successful implementation for mAbs, vaccines, and ATMPs demonstrates its critical role in advancing towards fully automated, data-driven biomanufacturing paradigms, ensuring product quality while accelerating development timelines.
Within the broader research thesis on implementing Near-Infrared (NIR) spectroscopy for continuous bioreactor monitoring, navigating the regulatory landscape is paramount for successful technology transfer to a Good Manufacturing Practice (GMP) environment. This technical guide synthesizes the core principles of ICH Q2(R1) Validation of Analytical Procedures, the FDA's Process Analytical Technology (PAT) guidance, and the development of robust model validation protocols specifically for NIR-based multivariate calibration models used in bioprocessing.
Regulatory Framework Synthesis
The following table summarizes the alignment and focus of the two key regulatory documents in the context of NIR model validation for bioreactor monitoring.
Table 1: Core Regulatory Guidance for PAT and Analytical Validation
| Guidance Document | Primary Scope & Focus | Key Requirements for NIR Calibration Models | Application to Continuous Bioreactor Monitoring |
|---|---|---|---|
| ICH Q2(R1) | Validation of analytical procedures (e.g., HPLC). Defines validation parameters. | Approach adapted for multivariate models. Specificity, Linearity, Range, Accuracy, Precision (Repeatability, Intermediate Precision), Detection/Quantitation Limits (LOD/LOQ), Robustness. | Ensures the NIR method is a valid quantitative or qualitative analytical procedure for critical quality attributes (CQAs) like glucose, lactate, cell density, or product titer. |
| FDA PAT Guidance | A framework for innovative pharmaceutical development, manufacturing, and quality assurance. | Focus on building quality into the process. Requires a science- and risk-based approach. Emphasis on Multivariate Model Validation, including calibration transfer, lifecycle management, and continuous verification. | Justifies real-time monitoring and control. Requires demonstration that the NIR model is robust, reliable, and suitable for its intended use in a dynamic, live bioprocess. |
Model Validation Protocol: A Tiered Approach for NIR
A comprehensive validation protocol for an NIR model predicting bioreactor analytes must integrate requirements from both guidances. The following table outlines a tiered experimental design for model validation.
Table 2: Experimental Validation Protocol for a Quantitative NIR Model (e.g., Glucose Concentration)
| Validation Parameter (ICH Q2(R1) Term) | PAT-Inspired Experimental Methodology for NIR | Protocol Detail & Acceptance Criteria |
|---|---|---|
| Specificity & Selectivity | Assess model's ability to identify and quantify analyte amidst interfering variables. | Method: Use model diagnostic tools (e.g., Q residuals, Hotelling's T²) on spectral data from samples with known, orthogonal variation (e.g., different media lots, process shifts, cell line changes). Criteria: Model should correctly identify out-of-spec process behavior. |
| Linearity & Range | Evaluate model performance across the expected operational range. | Method: Use a separate, independent validation set spanning the calibration range. Plot reference (e.g., YSI analyzer) vs. NIR-predicted values. Criteria: Linear regression slope: 1.0 ± 0.05, intercept not significantly different from zero (p>0.05), R² > 0.95. |
| Accuracy | Closeness of agreement between NIR prediction and reference value. | Method: Calculate bias (mean error) and Root Mean Square Error of Prediction (RMSEP) on the independent validation set. Compare RMSEP to process needs. Criteria: Bias not statistically significant from zero. RMSEP < 5% of the operational range. |
| Precision | 1. Repeatability2. Intermediate Precision | 1. Repeatability: Consecutive predictions on a single, homogeneous sample over short time. Criteria: RSD < 2%.2. Intermediate Precision: Predictions across expected variations (different days, operators, spectrometers, bioreactor scales). Criteria: Pooled RSD < 3%. Demonstrates robustness for calibration transfer. |
| Robustness | Deliberate, small variations in method parameters. | Method: Test effect of slight changes in sample presentation, temperature fluctuation in probe, instrument warm-up time. Use Experimental Design (DoE). Criteria: Predictions remain within accuracy limits. |
Diagram 1: NIR Model Development & Validation Workflow
Diagram 2: Regulatory Pillars of a PAT NIR Method
The Scientist's Toolkit: Essential Research Reagent Solutions
Table 3: Key Materials for NIR Bioprocess Model Development & Validation
| Item | Function in NIR Bioreactor Research |
|---|---|
| ATR Flow Cell or Immersion Probe | Enables in-situ, real-time spectral acquisition directly from the bioreactor. Must be steam-sterilizable (SIP) and compatible with cell culture. |
| Chemometric Software (e.g., Unscrambler, SIMCA, MATLAB PLS_Toolbox) | Essential for multivariate data analysis, including spectral preprocessing, PLS model development, cross-validation, and diagnostic plotting. |
| Primary Analytical Reference Instruments (e.g., YSI Biochemistry Analyzer, Cedex Cell Counter, HPLC) | Provides the accurate reference data ("Y-values") required for building and validating quantitative NIR calibration models. |
| Synthetic Calibration Standards | Mixtures of key analytes (glucose, glutamine, lactate) in buffer/media for initial model scoping and linearity checks. |
| Diverse, Well-Characterized Training Set Broths | Spent media samples from multiple bioreactor runs, spanning intended operational ranges (scale, process parameters, cell lines). Critical for model robustness. |
| Independent Validation Set Broths | Spent media from runs not used in calibration, ideally from a separate campaign. The gold standard for assessing model predictive performance. |
| Standard Normal Variate (SNV) & Derivative Algorithms | Spectral preprocessing tools to minimize light scattering effects and enhance chemical absorbance bands, improving model accuracy. |
Advanced Considerations: Lifecycle Management
Post-validation, the FDA PAT guidance emphasizes ongoing model lifecycle management. This includes:
- Continual Model Verification: Routine checking of predictions against infrequent off-line assays.
- Model Updating and Maintenance: A protocol for adding new data to the model or recalibrating when a significant process change occurs.
- Calibration Transfer: Validated procedures for transferring a model between identical or different spectrometers.
Successfully meeting regulatory standards for NIR in continuous bioreactor monitoring requires a hybrid strategy. Researchers must rigorously apply the validation parameters of ICH Q2(R1) to their multivariate models, all within the science- and risk-based PAT framework that governs real-time release. A meticulously executed, pre-defined validation protocol, as outlined herein, is the critical document that bridges research innovation to compliant pharmaceutical manufacturing.
Within the broader research thesis on implementing Near-Infrared (NIR) spectroscopy for continuous bioreactor monitoring, this technical guide quantifies the return on investment (ROI) achievable by replacing traditional, offline analytical methods with in-line NIR. The core value proposition lies in the significant reduction of manual sampling and the acceleration of batch release decisions through real-time, multi-attribute monitoring. This document provides a data-driven framework for calculating ROI, supported by current experimental protocols and materials.
In conventional bioprocessing, critical process parameters (CPPs) like glucose, lactate, ammonia, and viable cell density are tracked via manual sampling and offline analysis (e.g., HPLC, cell counters). This approach is labor-intensive, introduces contamination risk, causes process delays, and provides only discrete data points. The transition to in-line NIR spectroscopy, calibrated to these key analytes, enables continuous, non-invasive monitoring, forming the basis for tangible cost savings and quality improvements.
Quantitative ROI Framework: Key Metrics and Data
The ROI is calculated from direct cost savings and indirect benefits. The following tables summarize key quantitative data from recent industry studies and research.
Table 1: Direct Cost Savings from Reduced Manual Sampling
| Cost Component | Conventional Method (Per 15-day batch) | NIR-based Monitoring (Per 15-day batch) | Savings |
|---|---|---|---|
| Sampling Kits & Consumables | $3,500 (70 samples @ $50/sample) | $500 (10 calibration/verification samples) | $3,000 |
| Analyst Labor | 35 hours (70 samples, 0.5h each) | 5 hours (system checks, calibration) | 30 hours (~$2,250 @ $75/h) |
| Analytical Instrument Run Cost | $7,000 (HPLC, bioanalyzer usage) | $1,000 (NIR maintenance/calibration) | $6,000 |
| Total Direct Savings per Batch | $11,250 |
Table 2: Value from Faster Batch Release & Reduced Downtime
| Benefit Category | Conventional Timeline | NIR-Enabled Timeline | Economic Impact |
|---|---|---|---|
| Post-Batch Analytics Delay | 3-5 days for full QC data | Real-time data, release in 1 day | Gains 2-4 days of production capacity |
| Batch Decision Time (e.g., harvest) | Based on 8-12 hr offline data | Real-time trend enables immediate decision | Optimizes yield, prevents degradation |
| Reduced Batch Failure Risk | Late detection of excursions | Early anomaly detection enables correction | Prevents loss of entire batch (~$0.5-5M) |
Table 3: Capital & Implementation Costs (One-Time)
| Cost Item | Estimated Range | Notes |
|---|---|---|
| NIR Spectrometer (In-line probe) | $50,000 - $120,000 | Fiber-optic or immersion probe type |
| Software & Integration | $20,000 - $40,000 | Includes data interface to control system |
| Initial Model Development & Validation | $30,000 - $60,000 | Labor for calibration set design, testing |
| Total Initial Investment | $100,000 - $220,000 |
ROI Calculation Example: Annual Savings = (Savings per Batch × Batches per Year) = ($11,250 × 10 batches) = $112,500 Simple Payback Period = Total Investment / Annual Savings = $200,000 / $112,500 ≈ 1.8 years. Subsequent years yield net positive gains, excluding the higher-value benefits of reduced failure risk and faster release.
Experimental Protocol: Developing an NIR Calibration Model for Bioreactor Monitoring
This protocol details the steps to implement the core NIR methodology that enables the ROI.
Objective: To develop and validate a multivariate calibration model for predicting glucose, lactate, and VCD in a CHO cell bioreactor process using in-line NIR spectroscopy.
Materials & Equipment:
- Bioreactor system (e.g., Sartorius BIOSTAT, Cytiva Xcellerex)
- In-line NIR spectrometer with immersion probe (e.g., Metrohm Process Analytics NIR, Thermo Scientific)
- Reference Analytical Instruments: HPLC (for metabolites), Cell Counter (for VCD)
- Chemometrics Software (e.g., CAMO Unscrambler, SIMCA)
Procedure:
Experimental Design & Data Collection:
- Run multiple bioreactor batches (n≥3) covering expected process variations (e.g., different inoculation densities, feed strategies).
- Continuously collect NIR spectra (e.g., every 5 minutes) via the immersion probe throughout each batch.
- Concurrently, take manual samples at predefined intervals (e.g., every 12 hours). Immediately analyze these for glucose, lactate, and VCD using reference methods (HPLC, cell counter). These form the reference dataset.
Spectral Pre-processing:
- Load all spectral data into chemometric software.
- Apply pre-processing techniques to remove physical noise: Multiplicative Scatter Correction (MSC) or Standard Normal Variate (SNV) followed by first or second derivative (Savitzky-Golay) to enhance chemical signal peaks.
Calibration Model Development (PLS Regression):
- Use 2/3 of the data as a calibration set. Pair each pre-processed spectrum with its corresponding reference analyte value from the same time point.
- Perform Partial Least Squares (PLS) Regression to build a model correlating spectral features to each analyte.
- Optimize the model by selecting the optimal number of latent variables to avoid overfitting, using cross-validation.
Model Validation:
- Use the remaining 1/3 of data as an independent test set.
- Validate model performance using key statistical metrics:
- Root Mean Square Error of Prediction (RMSEP)
- Coefficient of Determination (R²)
- Relative Prediction Error (e.g., < 10% for key analytes)
Implementation & Continuous Verification:
- Install the validated model on the process system for real-time prediction.
- Establish a routine for periodic model updating and verification with sparse manual samples.
Workflow & Logical Diagrams
Title: NIR Implementation Workflow from Cost to ROI
Title: NIR Calibration Model Development Pipeline
The Scientist's Toolkit: Key Research Reagent Solutions
Table 4: Essential Materials for NIR Bioprocess Monitoring Research
| Item | Function in Research/Experimentation |
|---|---|
| In-Line NIR Immersion Probe (Fiber-Optic) | Robust, steam-sterilizable probe inserted directly into the bioreactor for continuous spectral acquisition. |
| NIR Spectrometer (Process Grade) | High-stability spectrometer (e.g., 800-2200 nm) with thermoelectric cooling for long-term operation in production environments. |
| Chemometrics Software License | Essential for multivariate data analysis, including PLS regression, model validation, and real-time prediction. |
| Calibration Set Samples | Characterized cell culture samples with known analyte concentrations (from HPLC, etc.) for building the initial model. |
| Spectralon Reference Standard | A white reference material used for regular calibration of the NIR instrument to maintain signal consistency. |
| Single-Use Bioreactor Bags with Pre-installed Ports | Bags designed with optical ports compatible with NIR probe insertion for single-use systems. |
| Model Update Samples | Periodically collected samples for reference analysis to monitor and update the calibration model's performance over time (drift correction). |
Integrating NIR spectroscopy for continuous bioreactor monitoring presents a compelling financial case beyond its technical merits. The ROI, driven predominantly by drastic reductions in sampling and analytical costs and accelerated batch release cycles, typically realizes a payback period of under two years. This analysis, framed within a research thesis context, provides a validated roadmap for quantification and implementation, enabling researchers and development professionals to build a robust business case for advanced process analytical technology (PAT) adoption.
Conclusion
NIR spectroscopy has matured from a research tool into a cornerstone of modern bioprocess monitoring, enabling real-time, multi-analyte quantification critical for Process Analytical Technology (PAT). This synthesis of foundational science, methodological implementation, troubleshooting, and validation demonstrates its power to enhance process understanding, ensure consistency, and accelerate development cycles. For researchers and drug development professionals, adopting NIR is a strategic move towards more agile, data-driven, and efficient biomanufacturing. Future directions point towards the integration of NIR with advanced machine learning for predictive control, its expansion into single-use bioreactor systems, and its pivotal role in facilitating continuous bioprocessing and real-time release testing (RTRT), ultimately contributing to more robust and accessible biologic therapies.