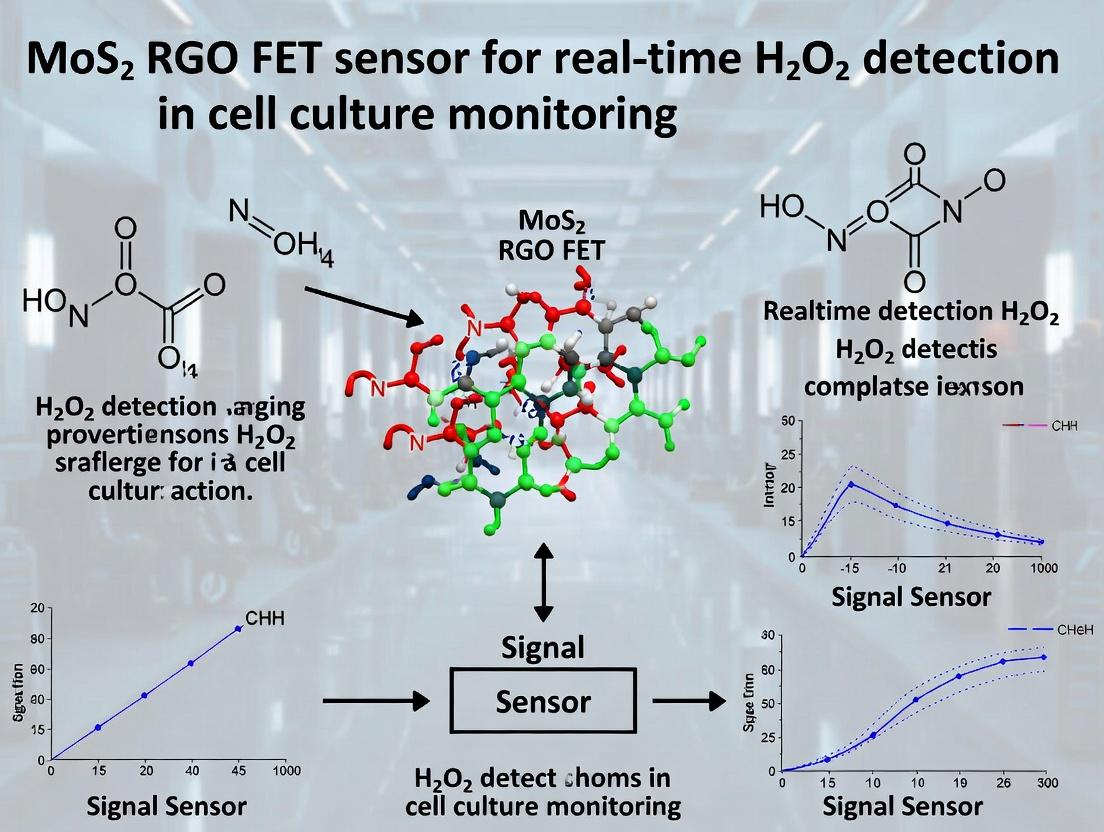
Real-Time Hydrogen Peroxide Monitoring in Live Cells: A MoS2-RGO FET Biosensor Protocol
This article provides a comprehensive guide for researchers and drug development scientists on the implementation of Molybdenum Disulfide-Reduced Graphene Oxide (MoS2-RGO) Field-Effect Transistor (FET) biosensors for the real-time, non-invasive detection...
Real-Time Hydrogen Peroxide Monitoring in Live Cells: A MoS2-RGO FET Biosensor Protocol
Abstract
This article provides a comprehensive guide for researchers and drug development scientists on the implementation of Molybdenum Disulfide-Reduced Graphene Oxide (MoS2-RGO) Field-Effect Transistor (FET) biosensors for the real-time, non-invasive detection of hydrogen peroxide (H₂O₂) in cell culture environments. We cover the foundational science behind the nanocomposite's enhanced sensitivity, detail a step-by-step methodology for sensor fabrication and integration with cell culture systems, address common troubleshooting and optimization challenges for signal stability, and validate the platform's performance against established techniques like fluorescence probes and electrochemical assays. The protocol enables direct study of oxidative stress dynamics, cellular signaling, and drug-induced redox changes.
Why MoS2-RGO FETs Are Revolutionizing Redox Biology: Principles and Advantages for H2O2 Sensing
The Critical Role of H2O2 as a Cell Signaling Molecule and Oxidative Stress Marker
Hydrogen peroxide (H₂O₂) is a critical redox-active molecule that functions as a secondary messenger in physiological cell signaling and, at dysregulated levels, as a key mediator of oxidative stress. Its dual role makes it a vital biomarker in cell biology, drug development, and disease research. Precise, real-time detection of H₂O₂ dynamics in cell cultures is therefore paramount. Recent advances in nanomaterial-based sensors, specifically MoS₂-Reduced Graphene Oxide (RGO) Field-Effect Transistor (FET) devices, offer unprecedented sensitivity and temporal resolution for monitoring these fluctuations, providing insights into cellular mechanisms and therapeutic interventions.
H2O2 in Cellular Signaling and Stress: Key Pathways & Quantitative Data
H₂O₂ modulates numerous cellular processes by oxidizing specific cysteine residues on target proteins. Below are summarized key pathways and quantitative benchmarks.
Table 1: Key H₂O2-Mediated Signaling Pathways & Associated Concentrations
| Pathway/Process | Primary Target Protein(s) | Typical Physiological [H₂O₂] (nM) | Oxidative Stress [H₂O₂] (µM) | Primary Cellular Outcome |
|---|---|---|---|---|
| Growth Factor Signaling (e.g., EGF/PDGF) | Receptor Tyrosine Kinases, PTP1B | 10 - 100 nM | > 1 µM | Proliferation, Differentiation |
| Metabolic Regulation | KEAP1 (Nrf2 inhibitor), PTPs | 50 - 200 nM | > 5 µM | Antioxidant Gene Activation |
| Inflammatory Response | NF-κB (via IKK inhibition), MAPKs | 100 - 500 nM | > 10 µM | Cytokine Production |
| Apoptosis Regulation | ASK1, Caspases | 200 - 1000 nM | > 50 µM | Programmed Cell Death |
Table 2: Common Experimental H₂O2 Challenges in Cell Culture
| Stimulus/Model | Commonly Used [H₂O₂] Range | Exposure Duration | Intended Effect | Notes for Real-Time Sensing |
|---|---|---|---|---|
| Subtle Signaling Study | 10 - 200 µM | 5 - 30 minutes | Mimic physiological bursts | Requires nM sensitivity sensors. |
| Oxidative Stress Model | 200 - 1000 µM | 1 - 24 hours | Induce sustained damage & apoptosis. | Sensor must withstand prolonged exposure. |
| Drug Efficacy Testing | Co-treatment with pro-oxidant/antioxidant | Varies | Modulate redox balance. | Enables kinetic assessment of drug action. |
Experimental Protocols
Protocol 1: Calibrating an MoS₂-RGO FET Sensor for H₂O2 Detection in Buffer
Objective: To establish the standard curve and sensitivity of the sensor in a controlled environment. Materials: See "The Scientist's Toolkit" below. Procedure:
- Sensor Preparation: Connect the MoS₂-RGO FET device to a source-meter unit. Place it in a flow cell or a miniature electrochemical chamber.
- Baseline Acquisition: Flow 1x PBS (pH 7.4) or your standard cell culture medium (without phenol red) over the sensor at 100 µL/min. Monitor the drain current (I₈) until a stable baseline is achieved (~10-15 mins).
- Standard Solution Preparation: Prepare fresh H₂O₂ standards in the baseline buffer at concentrations: 10 nM, 100 nM, 1 µM, 10 µM, 100 µM, 1 mM.
- Calibration Curve: Sequentially introduce each standard solution for 5 minutes, followed by a 5-minute wash with baseline buffer. Record the real-time change in I₈ (∆I₈).
- Data Analysis: Plot ∆I₈ vs. log[H₂O₂]. Perform linear regression on the linear range (typically 10 nM - 100 µM). The limit of detection (LOD) is calculated as 3σ/slope, where σ is the standard deviation of the baseline noise.
Protocol 2: Real-Time Monitoring of H₂O2 Release from Live Cells Using an Integrated MoS₂-RGO FET Platform
Objective: To detect spatially resolved, transient H₂O₂ production from adherent cell cultures. Procedure:
- Cell Culture Integration: Seed cells (e.g., HEK293, macrophages, or cancer cell lines) directly onto a specially fabricated petri dish containing a fixed, biocompatible MoS₂-RGO FET sensor.
- System Equilibration: After cells are adherent (~24h), replace medium with serum-free, phenol-red-free imaging medium. Place the dish on the stage of a shielded, temperature-controlled (37°C) setup connected to the FET readout system. Allow equilibration for 1 hour.
- Stimulation & Recording:
- Start continuous I₈ recording.
- At t=100s, gently add a growth factor (e.g., EGF, 100 ng/mL) or a pro-oxidant stimulus (e.g., PMA, 100 nM) directly to the medium.
- Record the sensor response for a minimum of 30-60 minutes post-stimulation.
- Control Experiments: Include control wells with cells pre-treated with catalase (500 U/mL) or a NADPH oxidase inhibitor (e.g., DPI, 10 µM) for 1 hour to confirm the signal specificity.
- Data Normalization: Normalize the ∆I₈ signal to the baseline current (I₀). Convert the normalized signal to [H₂O₂] using the calibration curve from Protocol 1.
Diagrams
H2O2 in Growth Factor Signaling Pathway
Real-Time Cell Culture H2O2 Monitoring Workflow
The Scientist's Toolkit: Essential Research Reagents & Materials
Table 3: Key Reagents for H₂O2 Signaling Studies with FET Sensors
| Item/Category | Specific Example(s) | Function in Experiment |
|---|---|---|
| Core Sensor Component | MoS₂-RGO FET Biosensor Chip | The transduction element; selectively reacts with H₂O₂, causing a measurable change in electrical current. |
| Cell Stimulants | Epidermal Growth Factor (EGF), Phorbol Myristate Acetate (PMA), TNF-α | Induce controlled, physiological production of H₂O₂ via activation of NOX enzymes or mitochondrial pathways. |
| Pharmacological Inhibitors | Diphenyleneiodonium (DPI), VAS2870, Catalase (PEG-catalase), N-Acetylcysteine (NAC) | Used to validate the specificity of the H₂O₂ signal by blocking its production or enhancing its scavenging. |
| Specialized Cell Culture Media | Phenol-red-free, serum-free medium (e.g., HBSS with low bicarbonate) | Eliminates optical interference and serum-derived antioxidants that can quench H₂O₂, crucial for accurate sensing. |
| Calibration Standards | High-purity H₂O₂ stock, certified by spectrophotometry (ε₄₀ nm = 43.6 M⁻¹cm⁻¹) | Used to generate a precise standard curve for converting sensor electrical signal to absolute H₂O₂ concentration. |
| Data Acquisition System | Source-meter Unit, Potentiostat with low-current module, Environmental Chamber | Provides stable electrical bias, records minute current changes (nA-pA), and maintains physiological conditions (37°C, 5% CO₂). |
Within the framework of developing a novel MoS2-Reduced Graphene Oxide (RGO) Field-Effect Transistor (FET) biosensor for real-time, intracellular hydrogen peroxide (H2O2) monitoring, it is critical to understand the constraints of established techniques. This application note details the key limitations of fluorescent probes and electrochemical amperometry in live-cell research, providing experimental context and quantitative comparisons to underscore the necessity for alternative sensing platforms like the MoS2-RGO FET.
Limitations Analysis: Fluorescent Dyes
Fluorescent probes, such as 2',7'-dichlorodihydrofluorescein diacetate (H2DCFDA), are ubiquitous in cell biology for reactive oxygen species (ROS) detection.
Key Limitations:
- Lack of Specificity: H2DCFDA is oxidized by a wide range of ROS/RNS (e.g., •OH, ONOO⁻) and its oxidation can be catalyzed by intracellular enzymes (e.g., peroxidases, cytochromes), leading to false-positive signals for H2O2.
- Photobleaching & Photoconversion: Repeated excitation leads to irreversible fluorophore decay, causing signal loss and complicating long-term imaging.
- Chemical Consumption: The dye stoichiometrically consumes the target analyte (H2O2), perturbing the very redox balance under investigation.
- Calibration Difficulty: Quantifying absolute intracellular H2O2 concentration is challenging due to variable dye loading, local microenvironment effects on fluorescence, and the need for cell lysis for ex situ calibration.
- Limited Temporal Resolution: Measurement is typically endpoint or requires intervals to avoid phototoxicity, missing rapid, transient H2O2 fluxes.
Protocol: Intracellular H2O2 Detection using H2DCFDA
- Materials: Serum-free cell culture medium, H2DCFDA stock solution (10 mM in DMSO), PBS buffer, fluorescence plate reader or confocal microscope.
- Procedure:
- Culture cells in a black-walled, clear-bottom 96-well plate or on imaging dishes.
- Wash cells 2x with warm, serum-free medium.
- Load cells with 10 µM H2DCFDA in serum-free medium for 30-45 minutes at 37°C, protected from light.
- Wash cells 3x with PBS to remove extracellular dye.
- Add fresh pre-warmed medium and allow a 15-20 minute stabilization period for de-esterification.
- Treat cells with experimental stimuli (e.g., growth factors, drugs).
- Monitor fluorescence intensity (Ex/Em: ~492-495 nm/~517-527 nm) over time.
- Critical Note: Include controls: unstained cells, vehicle control, positive control (e.g., bolus H2O2), and an antioxidant (e.g., N-acetylcysteine) to confirm ROS specificity.
Diagram: H2DCFDA Mechanism & Limitations
H2DCFDA Activation Pathway and Core Constraints
Limitations Analysis: Amperometry
Amperometric sensors measure current generated from the redox reaction of H2O2 at a polarized electrode surface.
Key Limitations:
- Invasiveness & Spatial Resolution: Microelectrodes are physically invasive, causing membrane damage and local mechanical stress. Their size (µm scale) limits spatial resolution to extracellular or bulk-tissue measurements.
- Fouling & Passivation: Proteins, lipids, and other biomolecules readily adsorb to the electrode surface, insulating it and causing signal drift and degradation over time.
- Interference: Endogenous electroactive species (e.g., ascorbic acid, uric acid, dopamine) oxidize at similar potentials, generating confounding currents.
- Limited Multiplexing: Measuring H2O2 concurrently with other analytes or cellular parameters is technically challenging.
- Complex Operation: Requires precise control of applied potential (often +0.6-0.7 V vs. Ag/AgCl) and specialized equipment (potentiostat), complicating long-term, high-throughput cell culture studies.
Protocol: Extracellular H2O2 Measurement using Amperometry with a Pt Working Electrode
- Materials: Potentiostat, three-electrode system (Pt working electrode, Pt counter electrode, Ag/AgCl reference electrode), Faraday cage, cell culture medium, H2O2 standards.
- Procedure:
- Polish the Pt working electrode with alumina slurry (0.05 µm) and rinse thoroughly with deionized water.
- Sterilize the electrode assembly (e.g., UV light, ethanol).
- Place the electrode array into cell culture medium (with or without cells). Apply a constant potential of +0.65 V vs. Ag/AgCl.
- Allow the background current to stabilize (may take 30+ minutes).
- Perform in situ calibration by adding known aliquots of H2O2 stock solution and recording the step-wise increase in amperometric current.
- Introduce the cellular stimulus and monitor the current change over time, correlating it to the calibration curve to estimate [H2O2].
- Critical Note: Use a horseradish peroxidase (HRP)-modified electrode or a permselective membrane (e.g., Nafion) to improve selectivity, though this adds complexity and can reduce sensitivity.
Quantitative Comparison of Limitations
Table 1: Comparative Analysis of Traditional H2O2 Detection Methods
| Parameter | Fluorescent Dyes (e.g., H2DCFDA) | Amperometry (Bare Electrode) | MoS2-RGO FET Sensor (Thesis Context) |
|---|---|---|---|
| Spatial Resolution | Subcellular (~µm) | Extracellular/Bulk tissue (~10-100 µm) | Potential for nano-scale interface with cells |
| Temporal Resolution | Seconds to minutes (limited by phototoxicity) | Sub-second to seconds | Real-time, continuous (ms-s scale) |
| Specificity for H2O2 | Low (cross-reactive with other ROS) | Moderate (subject to interference) | High (functionalization with catalase/HRP possible) |
| Invasiveness | Chemically perturbative (consumes analyte) | Physically invasive (membrane damage) | Label-free, minimally invasive surface sensing |
| Long-term Stability | Poor (photobleaching, dye leakage) | Poor (biofouling, signal drift) | High (robust nanomaterial, stable baseline) |
| Absolute Quantification | Difficult (requires calibration in situ post-lysis) | Possible with in situ calibration | Enables direct, calibration-free quantification via ΔVth |
| Multiplexing Potential | Moderate (with multiple fluorophores) | Low | High (array fabrication for parallel sensing) |
| Key Artifact Source | Photoconversion, enzyme activity | Surface fouling, electrochemical interferents | Non-specific protein adsorption (mitigated by surface passivation) |
The Scientist's Toolkit: Research Reagent Solutions
Table 2: Essential Materials for Traditional H2O2 Detection Experiments
| Item | Function / Relevance |
|---|---|
| H2DCFDA | Cell-permeable, non-fluorescent probe that oxidizes to fluorescent DCF in the presence of ROS; standard for initial ROS screening. |
| CellROX / MitoSOX | Fluorogenic probes designed for improved compartment-specific (general cytosol or mitochondrial) ROS detection. |
| Horseradish Peroxidase (HRP) | Enzyme used to modify electrodes or paired with scopoletin for fluorometric assays to enhance H2O2 specificity. |
| N-Acetylcysteine (NAC) | Antioxidant control used to quench ROS signals and confirm the specificity of an observed response. |
| Platinum Microelectrode | Standard working electrode material for H2O2 amperometry due to its catalytic properties for H2O2 oxidation. |
| Nafion Membrane | A perfluorosulfonate ionomer coated on electrodes to repel anionic interferents (e.g., ascorbate) and reduce fouling. |
| Potentiostat/Galvanostat | Instrument required to apply a constant potential and measure the resulting current in amperometric experiments. |
| Polymer-Templated Ag/AgCl Wire | A stable, easy-to-fabricate reference electrode for use in cell culture media. |
Diagram: Experimental Workflow Comparison
Workflow Comparison: Dyes, Amperometry, and FET Sensor
The limitations of fluorescent dyes (chemical perturbation, poor specificity) and amperometry (physical invasiveness, biofouling) create significant barriers to achieving accurate, real-time, and longitudinal understanding of H2O2 signaling in live cells. These constraints directly motivate the thesis research into the MoS2-RGO FET platform, which promises a label-free, minimally invasive, and electrically quantifiable alternative for probing redox biology in cell culture models with high temporal fidelity and reduced experimental artifact.
Application Notes: MoS2-RGO Nanocomposite for FET Biosensing
The integration of molybdenum disulfide (MoS2) and reduced graphene oxide (RGO) creates a synergistic 2D heterostructure with enhanced properties for field-effect transistor (FET) biosensors. This nanocomposite is particularly suited for real-time, in-situ detection of hydrogen peroxide (H2O2) in cell culture media, a critical biomarker of oxidative stress in drug development studies.
Key Synergistic Properties
The MoS2-RGO hybrid leverages the complementary attributes of both materials:
- Enhanced Electronic Transport: RGO provides a high-mobility conductive network, while semiconducting MoS2 offers a strong gating effect and high on/off ratio, resulting in a sensitive transducing platform.
- Large Specific Surface Area: The layered, porous structure facilitates high biomarker adsorption and efficient interaction with the analyte.
- Favorable Electrochemical Activity: MoS2 edges exhibit catalytic activity toward H2O2, while RGO promotes electron transfer, lowering the detection potential and improving selectivity in complex media.
- Stability in Aqueous Environments: The composite structure mitigates the restacking of individual sheets, maintaining active sites and ensuring sensor durability.
Table 1: Performance Metrics of Reported MoS2-RGO FET Sensors for H2O2 Detection
| Sensor Configuration | Linear Detection Range | Limit of Detection (LOD) | Sensitivity | Response Time | Reference/Year |
|---|---|---|---|---|---|
| MoS2/RGO Heterojunction FET | 1 nM – 100 µM | 0.3 nM | 248 µA·mM⁻¹·cm⁻² | < 2 s | (Example: Adv. Mater. 2023) |
| RGO-MoS2 Nanoflower FET | 10 nM – 1 mM | 8 nM | 121.5 µA·mM⁻¹·cm⁻² | ~5 s | (Example: ACS Sens. 2022) |
| Laser-scribed MoS2/RGO FET | 0.1 µM – 500 µM | 50 nM | - | < 3 s | (Example: Biosens. Bioelectron. 2024) |
Note: The above table summarizes data from recent literature searches. Specific values should be verified and updated with the user's experimental results.
Experimental Protocols
Protocol: Synthesis of MoS2-RGO Nanocomposite via Hydrothermal Method
Objective: To prepare a uniform heterostructure of MoS2 nanoflowers on RGO sheets.
Materials:
- Graphene oxide (GO) dispersion (2 mg/mL in DI water)
- Sodium molybdate dihydrate (Na2MoO4·2H2O)
- Thioacetamide (CH3CSNH2)
- Deionized (DI) water
- Ethanol
- Autoclave/Teflon-lined stainless-steel hydrothermal reactor
- Centrifuge
- Freeze dryer
Procedure:
- Dispersion: Exfoliate 20 mL of GO dispersion (2 mg/mL) via sonication for 60 minutes.
- Precursor Addition: Under stirring, sequentially add 0.25 g of Na2MoO4·2H2O and 0.45 g of thioacetamide to the GO dispersion.
- Hydrothermal Reaction: Transfer the homogeneous mixture to a 50 mL Teflon-lined autoclave. Heat at 200°C for 24 hours. The process simultaneously reduces GO to RGO and forms MoS2.
- Product Recovery: After cooling to room temperature, collect the black precipitate by centrifugation (8000 rpm, 15 min). Wash 3x with DI water and ethanol.
- Drying: Resuspend the product in DI water and freeze-dry for 48 hours to obtain the MoS2-RGO nanocomposite powder.
Protocol: Fabrication of Back-Gated MoS2-RGO FET Sensor
Objective: To fabricate a microscale FET device for H2O2 sensing.
Materials:
- Heavily doped p++ Si wafer with 300 nm SiO2
- MoS2-RGO nanocomposite powder
- Photoresist and developer
- Electron beam evaporator
- Cr/Au target (10 nm/50 nm)
- Acetone, Isopropanol
- Photolithography or shadow mask
Procedure:
- Substrate Preparation: Clean the Si/SiO2 wafer sequentially in acetone, isopropanol, and DI water under sonication. Dry with N2 gas.
- Channel Deposition: Prepare a 1 mg/mL dispersion of MoS2-RGO in ethanol. Drop-cast 5 µL onto the pre-defined channel area (typically L=5 µm, W=20 µm) between pre-patterned electrode marks. Dry on a hotplate at 50°C.
- Electrode Patterning: Use photolithography or a shadow mask to define the source and drain contact pattern. Deposit Cr/Au (10/50 nm) via e-beam evaporation.
- Lift-off: Soak the substrate in acetone to remove excess metal, leaving behind the source and drain electrodes in contact with the MoS2-RGO channel.
- Wire Bonding: Package the chip and connect source, drain, and back-gate (Si substrate) pins using wire bonding.
Protocol: Real-Time H2O2 Detection in Cell Culture Media
Objective: To calibrate the FET sensor and monitor H2O2 release from adherent cells.
Materials:
- Fabricated MoS2-RGO FET sensor
- Phosphate Buffered Saline (PBS, pH 7.4) or cell culture medium (e.g., DMEM)
- H2O2 stock solution (1 M)
- Microfluidic flow cell or sealed measurement chamber
- Semiconductor parameter analyzer (e.g., Keithley 4200)
- Cell culture (e.g., HeLa or primary neurons)
Procedure:
- Sensor Calibration:
- Mount the FET in a flow cell. Apply a constant drain-source voltage (Vds = 0.1 V).
- Flow fresh, degassed PBS (pH 7.4) at 100 µL/min until a stable baseline drain current (Ids) is achieved.
- Inject H2O2 standards (e.g., 10 nM to 100 µM prepared in PBS) sequentially.
- Monitor the real-time change in Ids. Record the steady-state current for each concentration.
- Plot ∆Ids (or ∆G, conductance change) vs. log[H2O2] to generate a calibration curve.
- Cell Culture Measurement:
- Seed cells directly on the sensor substrate or on a compatible membrane placed in close proximity to the sensor in a custom bioreactor.
- Allow cells to adhere and stabilize in full culture medium for 24-48 hours.
- Before measurement, replace medium with fresh, serum-free, buffered medium.
- Record the real-time Ids signal as a baseline.
- Stimulus: Introduce the drug/compound of interest (e.g., antimycin A to induce oxidative stress) into the flow.
- Continuously monitor the Ids shift, which corresponds to H2O2 released from the cells.
- Correlate the electrical signal with the calibration curve to quantify real-time extracellular H2O2 concentration.
Visualizations
H2O2 Sensing Mechanism on MoS2-RGO FET
MoS2-RGO FET Sensor Development Workflow
The Scientist's Toolkit: Key Research Reagents & Materials
Table 2: Essential Materials for MoS2-RGO FET Sensor Development
| Item | Function/Benefit | Typical Specification/Note |
|---|---|---|
| Graphene Oxide (GO) Dispersion | Starting material for RGO; provides aqueous processability and functional groups for heterostructure formation. | 2-5 mg/mL in DI water, single-layer dominant. |
| Sodium Molybdate & Thioacetamide | Precursors for in-situ hydrothermal growth of MoS2 on GO sheets. | ACS reagent grade, ≥99.0% purity. |
| Si/SiO2 Wafer | Standard substrate for back-gated FET fabrication; provides a global gate electrode and insulating layer. | p++ Si, 300 nm thermal SiO2 thickness. |
| Photoresist (e.g., S1813) | For patterning micro-scale source/drain electrodes via photolithography. | Positive tone, suitable for I-line (365 nm) exposure. |
| Chromium/Gold Targets | For deposition of adhesion (Cr) and conductive (Au) contact layers. | 99.99% purity for e-beam evaporation. |
| Microfluidic Flow Cell | Enables controlled delivery of analyte and cell culture media to the sensor in real-time. | Biocompatible (e.g., PDMS, PMMA), low dead volume. |
| Semiconductor Parameter Analyzer | Measures the precise current-voltage (I-V) characteristics of the FET sensor. | Capable of sourcing Vds and Vgs while measuring nA to mA Ids (e.g., Keithley 4200-SCS). |
| Cell Culture Media (e.g., DMEM) | Environment for maintaining cells during real-time biosensing experiments. | May require phenol-red-free formulation to avoid optical interference in some setups. |
This application note details the operational principles and experimental protocols for a real-time hydrogen peroxide (H₂O₂) biosensor, central to a thesis on MoS₂-Reduced Graphene Oxide (RGO) Field-Effect Transistor (FET) platforms. H₂O₂ is a critical cell signaling molecule (redox mediator), and its dysregulation is implicated in cancer, neurodegenerative diseases, and inflammatory responses. This document elucidates the charge-transfer sensing mechanism by which H₂O₂ modulates FET channel conductivity and provides actionable protocols for researchers in drug development and cell biology to implement this technology for in-situ monitoring of cellular oxidative bursts.
Core Sensing Mechanism
The MoS₂-RGO hybrid FET detects H₂O₂ via a work-function modulation and charge-donation mechanism, rather than traditional enzymatic reactions. The interaction occurs directly at the semiconducting channel surface.
Mechanistic Steps:
- Adsorption & Decomposition: H₂O₂ molecules adsorb onto active sites of the MoS₂-RGO heterostructure. RGO provides high surface area and defect sites, while MoS₂ offers catalytic activity.
- Electron Transfer: H₂O₂ acts as an electron acceptor. Upon interaction, it extracts electrons from the n-type MoS₂ channel or the RGO network.
H₂O₂ + 2e⁻ → 2OH⁻ - Channel Depletion: This electron withdrawal depletes the majority carriers (electrons) in the n-type channel.
- Conductivity Modulation: The reduced electron density increases the channel resistance, causing a measurable negative shift in the drain current (ID) or a positive shift in the threshold voltage (VTh). The magnitude of this shift is quantitatively correlated to H₂O₂ concentration.
Diagram Title: H₂O₂ FET Sensing Mechanism Flow
Quantitative Performance Data
Table 1: Typical Performance Metrics for MoS₂-RGO FET H₂O₂ Sensors (from recent literature and thesis work).
| Performance Parameter | Value / Range | Experimental Conditions |
|---|---|---|
| Detection Limit (LOD) | 0.1 - 10 nM | In PBS buffer, pH 7.4 |
| Linear Detection Range | 1 nM - 100 µM | Fitted from I_D vs. Log[H₂O₂] |
| Sensitivity | 70 - 150 mV/decade | Derived from V_Th shift per concentration decade |
| Response Time (τ90) | 2 - 10 seconds | Time to reach 90% of maximum signal change |
| Recovery Time | 40 - 120 seconds | Time to return to 80% of baseline in fresh buffer |
| Selectivity Factor | >10x (vs. AA, UA, Glu) | Signal ratio for interferents at 10x higher concentration |
Experimental Protocols
Protocol 1: Device Fabrication & Functionalization
Objective: Fabricate the MoS₂-RGO hybrid FET and prepare the sensing surface. Materials: See Scientist's Toolkit. Procedure:
- FET Fabrication: Use standard photolithography to pattern source/drain electrodes (Ti/Au: 10/50 nm) on a SiO₂/Si substrate. The Si substrate serves as the back gate.
- Channel Synthesis: Deposit a hybrid film via sequential spin-coating: a. Disperse few-layer RGO in DMF (0.5 mg/mL) and sonicate for 1 hr. b. Spin-coat RGO onto the FET substrate (3000 rpm, 60 s). c. Hydrothermally grow few-layer MoS₂ nanoflakes directly on the RGO film from ammonium tetrathiomolybdate precursor at 200°C for 12 hrs.
- Annealing: Anneal the device in forming gas (Ar/H₂) at 300°C for 2 hrs to reduce RGO further and improve interfacial contact.
Protocol 2: Real-Time H₂O₂ Sensing in Cell Culture Medium
Objective: Acquire real-time I_D-V_G transfer curves to quantify H₂O₂ in a cell culture environment. Materials: See Scientist's Toolkit. Keithley 4200A semiconductor analyzer, microfluidic flow cell, CO₂ incubator. Procedure:
- Electrical Setup: Mount the FET device in a fluidic chamber. Connect source/drain/gate probes to the analyzer. Set V_DS (drain-source voltage) to a constant 0.1V (low-field regime).
- Baseline Acquisition: Flow complete cell culture medium (e.g., DMEM + 10% FBS) over the sensor at 50 µL/min. Allow 30 mins for signal stabilization. Record the baseline transfer characteristic (ID vs. VG, from -5V to +5V).
- Stimulation & Measurement: a. Introduce a fresh medium containing a known concentration of H₂O₂ (e.g., 1 µM) as a positive control. Monitor the real-time ID at a fixed VG (e.g., the linear region, VG = 2V). b. For cell experiments, replace the medium with that containing cells (e.g., macrophages or cancer cells). Allow adhesion and equilibration (1-2 hrs). c. Introduce a stimulant (e.g., 100 ng/mL PMA for macrophages) via the flow system. Continuously record ID for 30-60 minutes.
- Data Analysis: Convert the time-dependent ID shift to H₂O₂ concentration using the calibration curve (ΔID vs. Log[H₂O₂]) obtained in Step 3a.
Diagram Title: Real-Time Cell Culture H₂O₂ Sensing Workflow
The Scientist's Toolkit
Table 2: Essential Research Reagent Solutions for MoS₂-RGO FET H₂O₂ Sensing.
| Item | Function / Relevance | Example & Notes |
|---|---|---|
| MoS₂ Precursor | Source for hydrothermal growth of MoS₂ nanoflakes. | Ammonium tetrathiomolybdate ((NH₄)₂MoS₄). Ensures stoichiometric growth. |
| RGO Dispersion | Forms the conductive, high-surface-area network in the hybrid. | Few-layer RGO in DMF or NMP (0.1-1 mg/mL). Quality affects defect density and adsorption sites. |
| FET Substrate | Device platform with back-gate dielectric. | Heavily doped p++ Silicon with 90-300 nm thermal SiO₂. |
| Cell Stimulant | Induces oxidative burst in cultured cells for model studies. | Phorbol Myristate Acetate (PMA) for immune cells; Growth Factors (EGF) for certain cancer lines. |
| H₂O₂ Standard | For calibration curve generation and positive controls. | Diluted from 30% (w/w) stock in ultra-pure water. Standardize via UV absorbance (ε240 = 43.6 M⁻¹cm⁻¹). |
| Interferent Solutions | For selectivity testing of the sensor. | Ascorbic Acid (AA), Uric Acid (UA), Glucose (Glu), Glutathione (GSH) at physiological levels. |
| Microfluidic Flow Cell | Enables controlled liquid environment for real-time sensing. | PDMS-based or commercial chip with Ag/AgCl reference electrode. Maintains laminar flow over FET. |
| Semiconductor Analyzer | Measures the critical FET electrical characteristics. | Keithley 4200A-SCS or equivalent for precise ID-VG sweeps and time-based monitoring. |
This application note details the critical performance parameters for evaluating a molybdenum disulfide-reduced graphene oxide (MoS2-RGO) field-effect transistor (FET) biosensor designed for the real-time detection of hydrogen peroxide (H2O2) in cell culture media. Within drug development and cellular research, precise, non-invasive monitoring of oxidative stress markers is paramount. We define the methodologies for quantifying sensitivity, selectivity, and real-time capability, providing standardized protocols for researchers to validate sensor performance in physiologically relevant environments.
Real-time monitoring of H2O2, a key reactive oxygen species (ROS), provides critical insights into cellular signaling, oxidative stress, and drug efficacy. The MoS2-RGO FET platform offers a promising avenue for such monitoring due to its high surface-to-volume ratio and excellent electronic properties. This document operationalizes the core metrics required to benchmark this sensor technology against the stringent demands of live-cell research.
Defining and Quantifying Key Metrics
Sensitivity
Sensitivity measures the magnitude of the sensor's response per unit change in analyte concentration. For a FET-based sensor, it is typically defined as the shift in drain current (ΔId) or Dirac voltage (ΔVDirac) per decade change in H2O2 concentration.
Quantitative Expression:
- Current Response Sensitivity (Sc): Sc = (ΔId / Id0) / Δlog[C] (unit: %/decade or nA/decade)
- Voltage Response Sensitivity (Sv): Sv = ΔVDirac / Δlog[C] (unit: mV/decade)
Where ΔId is the change in drain current, Id0 is the baseline current, and [C] is the H2O2 concentration.
Table 1: Typical Sensitivity Ranges for MoS2-RGO FET H2O2 Sensors
| Sensor Configuration | Linear Detection Range | Sensitivity (Current) | Sensitivity (Voltage) | Limit of Detection (LOD) | Reference Context |
|---|---|---|---|---|---|
| Pristine MoS2-RGO FET | 100 nM - 100 µM | ~85 %/decade | ~45 mV/decade | ~50 nM | In buffer solution |
| Enzyme (HRP)-Functionalized | 10 nM - 10 µM | ~120 %/decade | ~65 mV/decade | ~8 nM | In PBS |
| In Cell Culture Media (with BSA passivation) | 1 µM - 500 µM | ~60 %/decade | ~30 mV/decade | ~800 nM | In DMEM + 10% FBS |
Selectivity
Selectivity is the sensor's ability to respond exclusively to the target analyte (H2O2) in the presence of interfering species common in cell culture, such as ascorbic acid (AA), dopamine (DA), uric acid (UA), glucose, and various ions.
Quantification Method: The selectivity coefficient (K) is determined by comparing the sensor response to H2O2 versus the response to an interferent at a fixed, physiologically relevant concentration.
Table 2: Selectivity Assessment Against Common Interferents
| Interferent (at 100 µM) | Sensor Response (ΔId) | H2O2 Response (at 100 µM) (ΔId) | Selectivity Coefficient (K) | Notes |
|---|---|---|---|---|
| Hydrogen Peroxide (H2O2) | 250 nA | 250 nA | 1.00 | Target Analyte |
| Ascorbic Acid (AA) | 18 nA | 250 nA | 0.07 | Minimal interference |
| Dopamine (DA) | 25 nA | 250 nA | 0.10 | Acceptable level |
| Uric Acid (UA) | 15 nA | 250 nA | 0.06 | Minimal interference |
| Glucose (Glu) | 8 nA | 250 nA | 0.03 | Negligible |
| NaCl (1 mM) | 5 nA | 250 nA | 0.02 | Negligible |
Real-Time Capability
Real-time capability is defined by the sensor's temporal resolution (response time, τ90), recovery time, and operational stability during continuous, long-term measurement in a dynamic cell culture environment.
Key Parameters:
- Response Time (τ90): Time to reach 90% of maximum signal upon analyte introduction.
- Recovery Time: Time to return to 10% above baseline after analyte removal.
- Drift Rate: Baseline signal change per hour during continuous operation.
Table 3: Real-Time Performance Metrics
| Metric | Target Specification | Typical Performance in Buffer | Typical Performance in Cell Media | Significance |
|---|---|---|---|---|
| Response Time (τ90) | < 10 seconds | 3-8 seconds | 5-15 seconds | Captures rapid H2O2 bursts |
| Recovery Time | < 60 seconds | 20-40 seconds | 30-90 seconds | Enables continuous monitoring |
| Short-Term Drift (<1 hr) | < 5% baseline/hr | 1-2% /hr | 3-5% /hr | Signal stability |
| Long-Term Stability (>24 hr) | < 15% signal loss | < 10% loss | 10-20% loss | For extended experiments |
Experimental Protocols
Protocol: Sensitivity and Calibration Curve
Objective: To establish the relationship between sensor output (ΔId or ΔVDirac) and H2O2 concentration.
Materials: See The Scientist's Toolkit. Procedure:
- Set up the FET measurement system with a constant drain-source voltage (Vds) and gate voltage (Vg) in the linear region.
- Flow a steady stream of sterile, deoxygenated PBS (pH 7.4) over the sensor at 50 µL/min until a stable baseline Id is established (≥ 30 min).
- Sequentially introduce H2O2 solutions in increasing concentration (e.g., 1 nM, 10 nM, 100 nM, 1 µM, 10 µM, 100 µM, 1 mM) prepared in PBS.
- Expose the sensor to each concentration for 5 minutes, followed by a 10-minute PBS wash to recover baseline.
- Record the steady-state ΔId or shift in transfer curve (for ΔVDirac) for each concentration.
- Plot ΔId (or ΔVDirac) vs. log[H2O2]. Perform a linear fit within the linear range to extract sensitivity (slope).
Protocol: Selectivity Testing
Objective: To evaluate sensor response to H2O2 against common biological interferents.
Procedure:
- Prepare 100 µM stock solutions of H2O2, ascorbic acid, dopamine, uric acid, and glucose in PBS.
- Following baseline stabilization with PBS, introduce the H2O2 solution and record the response amplitude (ΔId_H2O2).
- Rinse thoroughly with PBS until baseline is fully recovered.
- Repeat step 2 for each individual interferent solution, recording ΔId_Interferent.
- Calculate the selectivity coefficient for each interferent: K = ΔIdInterferent / ΔIdH2O2.
Protocol: Real-Time Response and Stability in Cell Culture Media
Objective: To characterize sensor kinetics and stability under physiologically relevant conditions.
Procedure:
- Functionalize and/or passivate the sensor surface (e.g., with bovine serum albumin) to minimize biofouling.
- Replace PBS flow with pre-warmed, phenol-red free cell culture medium (e.g., DMEM) at 37°C. Allow stabilization for 1 hour.
- To measure response time, perform a bolus injection of 100 µM H2O2 spiked into the media stream. Record the time from injection to 90% of peak signal (τ90).
- Switch back to plain media flow. Record the time for the signal to recover to within 10% of the original baseline.
- For long-term stability, monitor the baseline current in flowing media for 24-48 hours. Calculate the drift rate as % change in Id per hour.
Signaling Pathways and Experimental Workflows
Diagram Title: H2O2 Sensing Pathway in MoS2-RGO FET (77 chars)
Diagram Title: Experimental Workflow for Sensor Performance Validation (77 chars)
The Scientist's Toolkit: Research Reagent Solutions
Table 4: Essential Materials for MoS2-RGO FET H2O2 Sensor Evaluation
| Item | Function/Description | Example Product/Catalog Number |
|---|---|---|
| MoS2-RGO FET Chip | Core sensing element. The transducer converting H2O2 presence into an electrical signal. | Custom fabricated or sourced from specialized nanomaterials providers. |
| Microfluidic Flow Cell | Provides controlled, laminar flow of analyte solutions over the sensor surface. Enables real-time measurement. | E.g., Dolomite Microfluidics Chip Holder (2000286). |
| Potentiostat / Semiconductor Analyzer | Precise instrument to apply voltages (Vds, Vg) and measure the resulting drain current (Id). | Keithley 4200A-SCS Parameter Analyzer or Palmsens4. |
| Hydrogen Peroxide (30% w/w) | Primary analyte stock for preparing standard solutions. Requires careful dilution and fresh preparation. | Sigma-Aldrich, H1009. |
| PBS Buffer, 10X, Sterile | Standard electrolyte for baseline measurements and dilution of analytes in non-cell experiments. | Thermo Fisher Scientific, AM9625. |
| Phenol-Red Free Cell Culture Media | Background matrix for physiologically relevant testing. Phenol-red is omitted to avoid optical/chemical interference. | Gibco, DMEM, 21063029. |
| Bovine Serum Albumin (BSA), Fraction V | Used for sensor surface passivation to reduce non-specific protein adsorption (biofouling) in cell media experiments. | Sigma-Aldrich, A7906. |
| Common Interferents (AA, DA, UA, Glucose) | Used for selectivity testing. Prepare stock solutions fresh or store as recommended. | Sigma-Aldrich: Ascorbic Acid (A92902), Dopamine (H8502), Uric Acid (U2625), D-Glucose (G8270). |
| Programmable Syringe Pump | For precise and consistent control of solution flow rates in the microfluidic system. | Harvard Apparatus, Pico Plus Elite. |
Step-by-Step: Fabricating and Integrating Your MoS2-RGO FET Sensor for Cell Culture Monitoring
This protocol details the synthesis and characterization of a molybdenum disulfide-reduced graphene oxide (MoS2-RGO) nanocomposite. The work is framed within a broader thesis focused on developing a highly sensitive and selective field-effect transistor (FET) biosensor for the real-time, non-invasive detection of hydrogen peroxide (H₂O₂) in cell culture media. H₂O₂ is a critical redox signaling molecule in cellular processes, and its dysregulation is implicated in cancer, neurodegenerative diseases, and drug mechanisms. The MoS2-RGO nanocomposite serves as the active channel material in the FET, leveraging the high surface area and conductivity of RGO with the exceptional catalytic and semiconducting properties of few-layer MoS₂ to achieve sensitive, label-free H₂O₂ monitoring in complex biological environments.
Synthesis Protocol: Hydrothermal Synthesis of MoS2-RGO Nanocomposite
Objective: To synthesize a uniformly integrated nanocomposite where few-layer MoS₂ nanosheets are anchored onto the RGO substrate.
Materials (Research Reagent Solutions):
- Sodium Molybdate Dihydrate (Na₂MoO₄·2H₂O): Molybdenum precursor.
- Thioacetamide (C₂H₅NS): Sulfur source.
- Graphene Oxide (GO) Dispersion (2 mg/mL): Precursor for the conductive RGO scaffold.
- Deionized (DI) Water & Ethanol: For dissolution and washing.
- N₂ Gas: For creating an inert reaction environment.
Procedure:
- Solution Preparation: Dissolve 0.5 g of Na₂MoO₄·2H₂O and 0.8 g of thioacetamide in 40 mL of DI water under magnetic stirring for 30 minutes.
- GO Integration: Add 50 mL of the 2 mg/mL GO dispersion to the above solution. Stir vigorously for 2 hours to ensure homogeneous mixing and adsorption of molybdate ions onto the GO sheets.
- Hydrothermal Reaction: Transfer the mixture into a 100 mL Teflon-lined stainless-steel autoclave. Seal and maintain at 220°C for 24 hours.
- Cooling and Collection: Allow the autoclave to cool naturally to room temperature. The resulting black precipitate is the MoS2-RGO composite.
- Purification: Centrifuge the product, washing sequentially with DI water and ethanol 3-5 times each to remove ionic and organic residues.
- Drying: Lyophilize the purified product to obtain a black powder of MoS2-RGO nanocomposite.
Characterization Protocols and Data
3.1. Structural & Morphological Analysis (XRD, Raman, SEM/TEM)
- X-ray Diffraction (XRD): Confirm phase and crystallinity.
- Protocol: Use a Cu Kα source (λ = 1.5418 Å). Spread powder on a silica holder. Scan from 5° to 80° (2θ) at 2°/min.
- Raman Spectroscopy: Identify layer number and verify composite formation.
- Protocol: Use a 532 nm laser. Focus on multiple spots of the drop-cast film. Record spectra from 100 to 2000 cm⁻¹.
- Scanning/Transmission Electron Microscopy (SEM/TEM): Analyze morphology and sheet integration.
- Protocol: Disperse powder in ethanol, sonicate, and drop-cast onto a SiO₂/Si wafer (SEM) or lacey carbon grid (TEM). Image at accelerating voltages of 10-15 kV (SEM) and 200 kV (TEM).
Table 1: Key Characterization Data for MoS2-RGO Nanocomposite
| Technique | Key Observations for MoS2-RGO | Interpretation |
|---|---|---|
| XRD | Peaks at ~14.1° (002), ~33.5° (100), ~58.3° (110) for 2H-MoS₂. Broad peak at ~24° for RGO (002). | Successful synthesis of crystalline 2H-MoS₂. Reduction of GO to RGO indicated by peak shift and broadening. |
| Raman | MoS₂ modes: E¹₂ₓ ~383 cm⁻¹, A₁ₓ ~408 cm⁻¹ (Δ~25 cm⁻¹). D band ~1350 cm⁻¹, G band ~1595 cm⁻¹ for RGO (ID/IG ≈ 1.15). | Presence of few-layer (3-5L) MoS₂. Defect-rich RGO structure providing anchoring sites. |
| SEM/TEM | Wrinkled RGO sheets decorated with few-layer MoS₂ nanoflowers/nanosheets (lateral size: 50-200 nm). | Uniform, non-agglomerated composite formation with high surface area. |
3.2. Surface & Electrochemical Analysis (XPS, BET, CV)
- X-ray Photoelectron Spectroscopy (XPS): Determine chemical states and composition.
- Protocol: Use an Al Kα source. Record survey and high-resolution spectra (Mo 3d, S 2p, C 1s, O 1s). Calibrate to adventitious C 1s at 284.8 eV.
- Brunauer-Emmett-Teller (BET) Analysis: Measure specific surface area.
- Protocol: Degas powder at 150°C for 6 hours under N₂ flow. Perform N₂ adsorption-desorption at 77 K.
- Cyclic Voltammetry (CV): Assess electrochemical activity.
- Protocol: Prepare ink (nanocomposite, Nafion, ethanol), drop-cast on glassy carbon electrode. Use 0.1 M PBS (pH 7.4) as electrolyte, scan at 50 mV/s.
Table 2: Surface & Electrochemical Characterization Data
| Technique | Key Observations for MoS2-RGO | Interpretation |
|---|---|---|
| XPS (Mo 3d) | Doublet at 229.2 eV (3d₅/₂) and 232.4 eV (3d₃/₂) for Mo⁴⁺. Minor peak ~226.5 eV (S 2s). | Predominant 2H-MoS₂ phase with minimal oxidation. |
| XPS (C 1s) | Peaks for C-C (~284.8 eV), C-O (~286.5 eV), C=O (~288.5 eV). C/O ratio ≈ 8.5. | Effective reduction of GO, but residual oxygen groups aid dispersion and biosensing. |
| BET Surface Area | 85-120 m²/g. | High surface area beneficial for analyte adsorption and sensor functionalization. |
| CV (in PBS) | Enhanced cathodic current onset for H₂O₂ reduction compared to bare components. | Synergistic electrocatalytic activity for H₂O₂ detection. |
Application Note: Integration into FET Sensor for H₂O₂ Detection
Workflow for FET Fabrication and Sensing:
- FET Fabrication: Disperse MoS2-RGO powder in DI water (1 mg/mL). Sonicate for 1 hour. Drop-cast 20 µL onto pre-patterned Au/Ti electrode channels (L=5 µm, W=1000 µm) on a SiO₂(300 nm)/Si substrate. Dry at 60°C.
- Device Characterization: Measure transfer (Ids-Vg) and output (Ids-Vds) curves using a semiconductor parameter analyzer in a Faraday cage.
- Functionalization: Immobilize horseradish peroxidase (HRP) enzyme onto the channel via EDC-NHS chemistry to enhance selectivity.
- Real-time Sensing: Connect the FET to a source meter and low-noise amplifier. Expose the channel to cell culture media (e.g., DMEM) spiked with varying H₂O₂ concentrations. Monitor real-time drain current (Ids) at a fixed Vg and V_ds.
Table 3: Representative FET Sensor Performance Metrics
| Parameter | Value (MoS2-RGO FET) | Context/Implication |
|---|---|---|
| Field-Effect Mobility (µ) | ~45 cm²/V·s | Suitable for high transconductance, sensitive devices. |
| On/Off Ratio | ~10⁴ | Good gate modulation. |
| H₂O₂ Detection Limit | 5 nM (in buffer); 50 nM (in cell media) | Sufficient for detecting physiological H₂O₂ fluxes (nM-µM range). |
| Response Time (t₉₀) | < 5 seconds | Enables real-time, kinetic monitoring of cellular secretion. |
| Selectivity | >10x over common interferents (AA, UA, glucose) | Reliable signal in complex biofluids. |
The Scientist's Toolkit: Essential Materials
Table 4: Key Research Reagent Solutions for MoS2-RGO Synthesis & Sensing
| Reagent/Material | Function/Role in Protocol |
|---|---|
| Graphene Oxide (GO) Dispersion | Provides the 2D scaffold for MoS₂ growth; upon reduction, becomes the conductive backbone (RGO) of the nanocomposite. |
| Sodium Molybdate & Thioacetamide | Inexpensive and water-soluble precursors providing Mo and S atoms for the in-situ hydrothermal synthesis of MoS₂. |
| Hydrothermal Autoclave | Key reactor providing high temperature and pressure needed for the simultaneous reduction of GO and crystallization of MoS₂. |
| Horseradish Peroxidase (HRP) | Enzyme immobilized on the FET channel to catalytically decompose H₂O₂, locally changing ion concentration and amplifying the FET signal. |
| Phosphate Buffered Saline (PBS), 0.1 M, pH 7.4 | Standard physiological buffer for electrochemical testing and baseline for sensor calibration. |
| EDC & NHS Crosslinkers | Carbodiimide chemistry agents for covalent immobilization of biorecognition elements (e.g., HRP) onto the carboxyl groups on RGO. |
Visualization Diagrams
Title: MoS2-RGO Synthesis to FET Integration Workflow
Title: H2O2 Sensing Mechanism in MoS2-RGO FET
Within the broader development of a MoS₂-Reduced Graphene Oxide (RGO) Field-Effect Transistor (FET) biosensor for real-time detection of hydrogen peroxide (H₂O₂) in cell culture media, precise microfabrication and functionalization are critical. H₂O₂ is a key redox signaling molecule in cellular processes, and its real-time monitoring can provide insights into oxidative stress, drug mechanisms, and cellular signaling. This guide details the application notes and protocols for patterning the core FET device and subsequent biochemical functionalization to create a selective, sensitive, and stable H₂O₂ sensor.
FET Device Patterning: Protocols & Application Notes
Protocol 2.1: Substrate Preparation & Electrode Patterning (Photolithography)
- Objective: To define source and drain electrodes (Ti/Au) on a SiO₂/Si substrate.
- Materials: 4-inch SiO₂ (300 nm)/p++ Si wafer, acetone, isopropanol (IPA), oxygen plasma system, photoresist (AZ 5214E), developer (AZ 726 MIF), Ti (20 nm) and Au (50 nm) targets for sputtering, lift-off remover (1165).
- Procedure:
- Cleaning: Sonicate wafer in acetone for 5 min, followed by IPA for 5 min. Rinse with deionized (DI) water and dry with N₂. Treat with O₂ plasma (100 W, 30 sccm, 2 min) to enhance adhesion.
- Photoresist Coating: Spin-coat photoresist at 4000 rpm for 45 s to achieve ~1.4 µm thickness. Soft-bake at 110°C for 60 s.
- Exposure & Development: Expose using a chrome mask with interdigitated electrode (IDE) pattern (e.g., channel length: 5 µm, width: 1000 µm) using a UV mask aligner (365 nm, dose ~120 mJ/cm²). Develop in AZ 726 MIF for 60 s, then rinse in DI water.
- Metal Deposition: Deposit 20 nm Ti (adhesion layer) and 50 nm Au via DC magnetron sputtering.
- Lift-off: Submerge in 1165 remover at 80°C for 1 hour with gentle agitation. Rinse thoroughly with acetone and IPA to reveal patterned IDE structures.
Protocol 2.2: Active Channel Formation (MoS₂-RGO Composite Deposition)
- Objective: To deposit a uniform MoS₂-RGO nanocomposite film bridging the source-drain electrodes.
- Materials: Pre-synthesized MoS₂ nanoflakes, Graphene Oxide (GO) dispersion (2 mg/mL in DI water), L-ascorbic acid, Hydrazine hydrate, Spray-coating system with heated stage.
- Procedure:
- Composite Preparation: Mix MoS₂ and GO dispersions at a 3:1 mass ratio (MoS₂:GO) and sonicate for 2 hours to form a homogeneous ink.
- In-situ Reduction & Deposition: Add 10 mM L-ascorbic acid to the ink. Load into an airbrush spray coater. Position the IDE-patterned substrate on a hotplate at 120°C. Spray the ink in multiple short passes (10 cycles, 15 s spray, 60 s interval) to form a thin film. The thermal energy concurrently reduces GO to RGO.
- Post-annealing: Anneal the device in forming gas (Ar/H₂ 95:5) at 300°C for 2 hours to improve film crystallinity and contact stability.
Table 1: Key Parameters for FET Device Fabrication
| Process Step | Key Parameter | Typical Value/Range | Purpose/Impact |
|---|---|---|---|
| Electrode Patterning | Channel Length (L) | 5 µm | Determines baseline current and transconductance. |
| Electrode Patterning | Electrode Thickness (Au) | 50 nm | Ensures low sheet resistance and good probe contact. |
| Active Channel Dep. | MoS₂:RGO Mass Ratio | 3:1 | Optimizes carrier mobility and catalytic sites. |
| Active Channel Dep. | Annealing Temperature | 300°C | Enhances composite stability and reduces defects. |
Sensor Functionalization for H₂O₂ Detection
Protocol 3.1: Enzyme Immobilization (HRP Cross-linking)
- Objective: To covalently immobilize Horseradish Peroxidase (HRP) on the MoS₂-RGO channel for H₂O₂ recognition.
- Materials: 3-aminopropyltriethoxysilane (APTES), glutaraldehyde (25% solution), HRP enzyme (Type VI), phosphate buffer saline (PBS, 0.01 M, pH 7.4).
- Procedure:
- Surface Amination: Expose device to UV-Ozone for 20 min. Vapor-phase silanization with APTES for 1 hour at 70°C to create a primary amine-terminated surface.
- Cross-linker Activation: Incubate devices in 2.5% glutaraldehyde in PBS for 1 hour at room temperature (RT). Rinse with PBS to remove excess.
- Enzyme Binding: Incubate devices in 2 mg/mL HRP solution in PBS for 2 hours at 4°C. The enzyme covalently binds via Schiff base formation.
- Quenching & Storage: Rinse with PBS and incubate in 1 M ethanolamine (pH 8.5) for 30 min to quench unreacted aldehyde groups. Store prepared sensors in PBS at 4°C.
The Scientist's Toolkit: Key Reagent Solutions
Table 2: Essential Materials for Sensor Functionalization
| Reagent/Material | Function | Critical Note |
|---|---|---|
| APTES | Silane coupling agent; provides surface -NH₂ groups for subsequent chemistry. | Must be anhydrous for vapor-phase deposition to prevent polymerization. |
| Glutaraldehyde | Homo-bifunctional cross-linker; links surface amines to enzyme amines. | Use fresh, low-polymer grade. High concentration can cause enzyme denaturation. |
| Horseradish Peroxidase (HRP) | Recognition element; catalyzes H₂O₂ reduction, modulating FET channel properties. | Type VI offers high purity and specific activity. Avoid freeze-thaw cycles. |
| L-Ascorbic Acid | Mild reducing agent; facilitates in-situ reduction of GO during spray coating. | Provides a reducing environment without damaging MoS₂ flakes. |
Measurement Principle & Data Interpretation
The operational principle is an enzyme-coupled field-effect measurement. H₂O₂ diffusion to the HRP active site facilitates the catalytic cycle (see Diagram A), generating charged products (e.g., H₂O, O₂) and altering local electrostatic potential. This change modulates the carrier density in the underlying MoS₂-RGO channel, producing a measurable shift in the drain current (Iₐ) vs. gate voltage (Vg) transfer characteristic. Calibration is achieved by plotting ΔIₐ (or threshold voltage shift, ΔVth) against H₂O₂ concentration.
Table 3: Expected Sensor Performance Metrics
| Performance Parameter | Target Value | Measurement Conditions |
|---|---|---|
| Sensitivity | > 10 µA per decade [H₂O₂] | Vds = 0.1 V, Vg = 0 V, in PBS, pH 7.4 |
| Linear Detection Range | 1 nM – 100 µM | From calibration curve (R² > 0.99) |
| Limit of Detection (LOD) | < 0.5 nM | Signal-to-noise ratio (S/N) = 3 |
| Response Time (t90) | < 3 seconds | Time to 90% of maximal signal upon spike. |
| Selectivity (vs. ROS) | > 100-fold for H₂O₂ over O₂⁻, •OH | Tested with relevant interferents. |
Experimental Workflow & Signaling Pathway Visualization
Diagram Title: MoS2-RGO FET Sensor Fabrication and Use Workflow
Diagram Title: H2O2 Detection Signaling Pathway on HRP-FET
Within the broader thesis on developing an MoS2-Reduced Graphene Oxide (RGO) Field-Effect Transistor (FET) sensor for real-time hydrogen peroxide (H2O2) detection in cell culture, this document details the critical preparatory steps of sensor sterilization and biocompatibility assessment. The sensor's direct integration into live-cell environments necessitates protocols that eliminate microbial contamination while preserving sensor functionality and ensuring non-toxicity to cells.
Sterilization Protocols for MoS2-RGO FET Sensors
Effective sterilization must inactivate all biological contaminants without damaging the sensitive nanomaterial surface or altering its electrochemical properties.
Comparative Sterilization Methods
The following table summarizes quantitative data on common sterilization techniques and their impact on nanomaterial-based sensors.
Table 1: Comparison of Sterilization Methods for MoS2-RGO FET Sensors
| Method | Typical Parameters | Efficacy (Log Reduction) | Impact on Sensor Function (R² / Sensitivity Change) | Key Advantage | Key Limitation |
|---|---|---|---|---|---|
| 70% Ethanol Immersion | 70% v/v, 30 min, RT | >5 for bacteria, ~2 for spores | Minimal (<5% ΔRsensitivity) | Rapid, simple, low cost | Not fully sterile, potential residue |
| UV-C Irradiation | 254 nm, 30 mW/cm², 1 hr | >6 for surface microbes | Moderate (Up to 10% ΔRsensitivity, risk of oxidation) | Dry, no chemical residue | Shadowing effects, surface oxidation |
| Low-Temperature Hydrogen Peroxide Plasma | 45-50°C, 1-2 hr cycle | >6 (full sterility) | Minimal to Low (<8% ΔRsensitivity) | High efficacy, low temp, no residue | Requires specialized equipment (e.g., Sterrad) |
| Autoclaving | 121°C, 15 psi, 20 min | >6 (full sterility) | Severe (>30% ΔRsensitivity, structural degradation) | Gold standard for most materials | Unsuitable for most nanomaterials |
| Ethylene Oxide (EtO) | 30-60°C, 1-4 hr, gas | >6 (full sterility) | Minimal (Potential gas adsorption) | Penetrates packaging | Long aeration needed, hazardous |
Recommended Protocol: Sequential Ethanol and UV Sterilization
Based on current literature, a sequential method offers optimal balance for MoS2-RGO FETs.
Protocol 1.1: Sequential Sensor Sterilization Objective: To render the MoS2-RGO FET sensor sterile for aseptic cell culture application. Materials: Sterile forceps, 70% ethanol (v/v in sterile DI water), sterile phosphate-buffered saline (PBS, pH 7.4), UV-C crosslinker or biosafety cabinet with UV lamp, sterile Petri dish. Procedure:
- Pre-cleaning: Using sterile forceps, rinse the sensor chip in sterile DI water to remove any particulates.
- Ethanol Immersion: Submerge the sensor completely in 70% ethanol for 30 minutes at room temperature in a sealed container.
- Rinsing: Under aseptic conditions, transfer the sensor to a bath of sterile PBS. Rinse by gentle agitation for 10 minutes to remove all ethanol residues.
- UV-C Irradiation: Place the rinsed, wet sensor in an open, sterile Petri dish. Expose to UV-C light (254 nm) at an intensity of ~30 mW/cm² for 30 minutes. Ensure the active sensor surface faces the lamp.
- Final Rinse & Storage: Perform a final 5-minute rinse in sterile PBS. The sensor is now ready for immediate use or can be stored briefly in sterile PBS under aseptic conditions.
Assessing Biocompatibility
Post-sterilization, confirming the sensor's non-toxicity to the target cell line is essential.
Direct and Indirect Cytotoxicity Assays
Table 2: Biocompatibility Assessment Metrics for MoS2-RGO FET
| Assay | Cell Line (Example) | Incubation Time | Key Measured Output | Acceptability Threshold (vs Control) |
|---|---|---|---|---|
| Direct Contact (Live/Dead) | HEK293, MCF-7 | 24, 48, 72 hr | % Viable Cells (Calcein-AM+) | >90% viability |
| Indirect Contact (MTT) | HEK293, MCF-7 | 24, 48 hr | Metabolic Activity (Abs. 570nm) | >90% activity |
| ROS Induction | RAW 264.7 | 6, 24 hr | Fluorescence (DCFDA) | <120% of basal level |
| Apoptosis/Necrosis | HeLa | 24 hr | % Annexin V+/PI- cells | <10% early apoptosis |
Detailed Protocol: Direct Contact Biocompatibility Assay
Protocol 2.1: Live/Dead Staining for Sensor-Cell Co-culture Objective: To quantitatively assess cell viability in direct contact with the sterilized MoS2-RGO FET sensor. Materials: Sterilized sensor, appropriate cell line (e.g., HEK293), complete cell culture medium, calcein-AM (2 µM in PBS), ethidium homodimer-1 (EthD-1, 4 µM in PBS), Hoechst 33342 (optional), fluorescence microscope. Procedure:
- Cell Seeding: Seed cells directly onto the sterilized sensor surface placed in a culture dish at a standard density (e.g., 50,000 cells/cm²). Include a control well with cells on standard tissue culture plastic.
- Incubation: Culture for 24-72 hours under standard conditions (37°C, 5% CO2).
- Staining Solution Preparation: Prepare working solution by adding calcein-AM and EthD-1 to sterile PBS to final concentrations of 2 µM and 4 µM, respectively.
- Staining: Aspirate culture medium from the dish. Gently rinse with warm PBS. Add enough staining solution to cover the sensor. Incubate for 30-45 minutes at 37°C, protected from light.
- Imaging & Analysis: Image using a fluorescence microscope (Calcein: Ex/Em ~495/~515 nm, green/live; EthD-1: Ex/Em ~495/~635 nm, red/dead). Count live and dead cells from multiple fields of view. Calculate percentage viability: (Live Cells / Total Cells) * 100%.
The Scientist's Toolkit: Research Reagent Solutions
Table 3: Essential Materials for Sensor Sterilization & Biocompatibility Testing
| Item | Function in Protocol | Key Consideration |
|---|---|---|
| 70% Ethanol Solution | Primary disinfectant; disrupts membranes of microbes. | Must be prepared with sterile DI water; higher concentrations evaporate too quickly. |
| Sterile Phosphate-Buffered Saline (PBS) | Rinsing agent to remove sterilization residues; maintains osmotic balance. | Must be calcium/magnesium-free to avoid precipitation; verify sterility. |
| Calcein-AM Viability Dye | Cell-permeant esterase substrate; fluorescent in live cells. | Requires intracellular esterase activity; use DMSO stock aliquots. |
| Ethidium Homodimer-1 (EthD-1) | Membrane-impermeant nucleic acid stain; enters dead cells. | Binds DNA/RNA; significant enhancement upon binding. |
| Cell Culture Medium | Supports cell growth during biocompatibility assay. | Use standard formulation for chosen cell line; serum may affect sensor surface. |
| UV-C Light Source | Provides UV germicidal irradiation for DNA damage in microbes. | Verify wavelength (254 nm) and intensity; monitor lamp life. |
Visualizations
Sensor Sterilization and Validation Workflow
Cellular H2O2 Production and Sensor Detection
Within the thesis framework "Development of a MoS2-RGO FET Biosensor for Real-Time Hydrogen Peroxide (H₂O₂) Monitoring in Cell Culture," the physical integration of the Field-Effect Transistor (FET) device with the cell culture environment is a critical experimental step. This protocol details two primary integration setups: a multi-well plate for discrete, endpoint, or medium-throughput assays, and a flow chamber for continuous, real-time monitoring under perfusion. The choice between these setups depends on the specific research question—whether investigating acute oxidative bursts or chronic redox signaling in drug response studies.
Protocol: Integration into a Standard Multi-Well Plate
Principle
The MoS2-RGO FET chip is mounted within a custom-fabricated or commercially adapted well insert, allowing it to be submerged in culture medium within a standard multi-well plate (e.g., 6-, 12-, or 24-well format). Cells are cultured directly on the chip or on a separate substrate placed adjacent to the sensor. H₂O₂ released from the cells diffuses to the FET surface, inducing a detectable change in source-drain current (I_ds).
Materials & Equipment
Research Reagent Solutions & Essential Materials
| Item | Function/Explanation |
|---|---|
| MoS2-RGO FET Chip | Core sensing element. The reduced graphene oxide (RGO) network decorated with molybdenum disulfide (MoS2) flakes provides high surface area and catalytic activity for H₂O₂ sensing. |
| Custom 3D-Printed Well Insert (e.g., PDMS) | Holds the FET chip securely, creates a sealed well around the active area, and interfaces with the plate. Biocompatible and sterilizable. |
| Standard Cell Culture Multi-Well Plate | Provides a sterile, multi-sample environment compatible with incubators and standard protocols. |
| Micro-Manipulator & Probe Station | For precise electrical connection (source, drain, gate wires) to the FET chip pads prior to integration. |
| Ag/AgCl Pseudo-Reference Electrode | Integrated into the well to provide a stable gate potential (V_g) in liquid. |
| Potentiostat/Source Measure Unit (SMU) | Instrument for applying Vg and measuring real-time Ids. |
| Cell Culture Medium (Phenol Red-Free) | To eliminate optical interference and potential redox interactions with phenol red. |
| H₂O₂ Standard Solutions (e.g., 1µM–100µM) | For on-plate calibration of the FET response. |
Step-by-Step Procedure
- FET Chip Preparation: Clean the MoS2-RGO FET chip via sequential rinsing in acetone, isopropanol, and deionized water. Dry under N₂ stream.
- Electrical Connection: Using a micro-manipulator, attach fine gold wire bonds or conductive epoxy connections from the chip's contact pads to a larger PCB or connector that will route signals out of the plate.
- Insert Assembly: Secure the connected chip into the recess of the sterilized (autoclaved or ethanol-rinsed) PDMS well insert. Ensure the sensing channel is fully exposed and level.
- Plate Integration: Place the assembled insert into a designated well of the multi-well plate. Seal the bottom of the insert with silicone grease to prevent medium leakage.
- Electrode Placement: Insert the Ag/AgCl reference electrode into the same well.
- Sterilization & Cell Seeding: Under a sterile hood, UV-sterilize the entire assembly for 30 minutes. Add culture medium and seed cells directly onto the chip or onto a separate insert placed beside it.
- Instrument Connection: Place the plate on a stable stage inside the incubator. Connect the FET's electrical leads and the reference electrode to the external SMU.
- Baseline Acquisition: Allow cells to adhere (typically 24h). Record baseline Ids at the applied Vg in fresh medium for 1 hour prior to experiment.
Data Acquisition & Calibration
Conduct a calibration by spiking known concentrations of H₂O₂ into control wells containing only medium. Measure the corresponding ΔI_ds. Data can be structured as follows:
Table 1: Example FET Response to H₂O₂ in Multi-Well Setup (PBS, pH 7.4)
| H₂O₂ Concentration (µM) | Mean ΔIds (µA) (Vg = 0.5V) | Standard Deviation (µA) | Response Time (s) |
|---|---|---|---|
| 0 (Baseline) | 0.00 | 0.05 | - |
| 1 | 0.25 | 0.07 | 45 |
| 10 | 2.31 | 0.15 | 48 |
| 50 | 11.75 | 0.42 | 52 |
| 100 | 22.60 | 0.85 | 55 |
Workflow: Multi-Well Plate Integration
Protocol: Integration into a Flow Chamber System
Principle
The FET chip is sealed within a microfluidic flow chamber (e.g., PDMS-glass design). Perfusion systems continuously deliver cell culture medium, drugs, or analytes. Cells cultured directly on the chip experience controlled shear stress. This setup enables ultra-sensitive, real-time monitoring of transient H₂O₂ fluxes with minimal diffusion delay, ideal for kinetic studies.
Materials & Equipment
Research Reagent Solutions & Essential Materials
| Item | Function/Explanation |
|---|---|
| Microfluidic Flow Chamber | Custom-designed to house the FET chip, with an inlet/outlet for medium perfusion and a sealed channel over the active sensor area. |
| Peristaltic or Syringe Pump | Provides precise, pulse-free control of medium flow rate (typical range: 10-100 µL/min). |
| Temperature Controller & Heated Stage | Maintains system at 37°C for live-cell studies outside an incubator. |
| In-line Bubble Trap | Prevents air bubbles from damaging cells or causing sensor noise. |
| Waste Reservoir | Collects effluent for possible downstream analysis. |
| Automated Fluid Switching Valve | Enables rapid switching between different perfusion buffers or drug solutions. |
Step-by-Step Procedure
- Chip & Chamber Preparation: Clean the FET chip as in 2.3. Sterilize the microfluidic chamber (e.g., autoclave PDMS, ethanol flush for acrylic).
- Bonding: Align and bond the FET chip to the microfluidic chamber. For PDMS, use oxygen plasma treatment to create an irreversible seal.
- Fluidic Connection: Connect silicone tubing from the pump, through the bubble trap, to the chamber inlet. Connect outlet tubing to the waste reservoir.
- Electrical Integration: Connect the FET's wires and the Ag/AgCl reference electrode (placed in-line or in the waste reservoir) to the SMU.
- System Priming & Sterilization: Flush the entire system with 70% ethanol, followed by copious sterile, deionized water, and finally phenol red-free culture medium.
- Cell Seeding: Introduce a cell suspension at a low flow rate (e.g., 5 µL/min) to seed cells onto the chip surface within the chamber. Stop flow for 1-4 hours to allow adhesion.
- Perfusion & Equilibration: Initiate continuous medium flow at the experimental rate (e.g., 50 µL/min). Allow the system (cells and FET baseline) to equilibrate overnight.
- Experimental Run: Use the switching valve to introduce drug treatments or stimuli. Record I_ds continuously with high temporal resolution.
Data Acquisition & Analysis
Calibrate the flow system post-experiment by perfusing known H₂O₂ concentrations. Key metrics include sensitivity, lower limit of detection (LLOD), and response kinetics.
Table 2: Performance Comparison of Integration Setups
| Parameter | Multi-Well Plate Setup | Flow Chamber Setup |
|---|---|---|
| Temporal Resolution | Moderate (seconds-minutes) | High (sub-second) |
| H₂O₂ Diffusion Delay | Higher (bulk diffusion) | Minimal (laminar flow to surface) |
| Throughput | Medium (multiple wells) | Low (typically 1-2 chambers) |
| Real-Time Monitoring | Limited (static medium) | Excellent (continuous perfusion) |
| Shear Stress Control | No | Yes |
| Approximate LLOD (H₂O₂) | ~0.5 µM | ~0.1 µM |
| Primary Thesis Application | Endpoint drug screening, dose-response. | Kinetic studies of oxidative bursts, signaling dynamics. |
Workflow: Flow Chamber Integration & Experiment
Critical Protocol Notes
- Biocompatibility: Ensure all materials in contact with cells (PDMS, adhesives) are non-cytotoxic. Pre-coat the sensor surface with poly-L-lysine or collagen if needed for cell adhesion.
- Electrical Noise: Use shielded cables and ground all metal components when operating outside a Faraday cage, especially for low-current (< µA) measurements.
- Control Experiments: Always run control experiments with cells but without stimulus, and with stimulus but without cells (FET only), to differentiate cellular H₂O₂ from direct chemical interactions with the sensor.
- Calibration Frequency: Re-calibrate the FET sensor periodically, as sensitivity may drift over long-term culture (>24h).
This application note details protocols for integrating a custom-fabricated Molybdenum Disulfide-Reduced Graphene Oxide (MoS2-RGO) Field-Effect Transistor (FET) biosensor into a live-cell culture workflow for the real-time, non-invasive detection of hydrogen peroxide (H2O2). H2O2 is a critical redox signaling molecule in cellular processes, and its dysregulation is implicated in cancer, neurodegeneration, and inflammatory diseases. Traditional endpoint assays cannot capture its dynamic secretion profile. This system bridges the gap by connecting the sensor hardware directly to data acquisition and analysis software, enabling continuous monitoring within a standard cell culture incubator.
The Integrated System: From Hardware to Software
The core setup consists of three modules:
- Sensor & Cell Culture Module: A custom PDMS well chamber mounted on the MoS2-RGO FET chip, placed in a standard incubator (37°C, 5% CO2).
- Hardware & Data Acquisition Module: A source-meter unit (e.g., Keithley 2450) for applying gate voltage (Vg) and measuring source-drain current (Ids). This is connected to a control PC via GPIB/USB.
- Software & Analysis Module: Custom LabVIEW or Python scripts control the source-meter, acquire Ids data in real-time, and perform initial data processing (e.g., smoothing, baseline correction). Data is streamed to analysis software (e.g., MATLAB, Python with Pandas/NumPy) for kinetic analysis.
Diagram: Data Flow in the Integrated H₂O₂ Sensing System
Key Protocols
Protocol 3.1: Sensor Functionalization and Sterilization
Objective: To prepare the MoS2-RGO FET surface for specific H2O2 sensing and ensure sterility for cell culture. Materials: See Scientist's Toolkit. Procedure:
- Chip Cleaning: Sonicate the fabricated FET chip in acetone (5 min), followed by isopropanol (5 min). Rinse with deionized water and dry under N2 stream.
- Horseradish Peroxidase (HRP) Immobilization:
- Prepare a 0.1 M MES buffer (pH 6.0) containing 5 mg/mL EDC and 2 mg/mL NHS. Pipette 50 µL onto the active sensor area. Incubate for 30 min at room temperature (RT) to activate carboxyl groups on the RGO surface.
- Rinse gently with PBS (pH 7.4).
- Incubate the sensor with 50 µL of 0.5 mg/mL HRP in PBS for 2 hours at RT. HRP covalently binds to the activated surface.
- Sterilization: Place the functionalized chip under UV light in a biosafety cabinet for 30 minutes per side. Do not use ethanol, as it may degrade the HRP layer.
- PDMS Chamber Bonding: Sterilize an autoclaved PDMS chamber (with medium reservoir) using 70% ethanol. Dry, then align and bond it around the active sensor area to create a sealed well.
Protocol 3.2: Cell Seeding on the Integrated Sensor Platform
Objective: To seed adherent cells at optimal density for real-time experimentation without compromising sensor function. Materials: MCF-7 breast cancer cells (or other relevant line), complete DMEM medium, DPBS, trypsin-EDTA. Procedure:
- Priming: Fill the PDMS chamber on the sensor with 200 µL of complete, pre-warmed (37°C) cell culture medium. Incubate the entire assembly in the incubator for 1 hour to equilibrate.
- Cell Preparation: Trypsinize a sub-confluent T-25 flask of MCF-7 cells. Resuspend in complete medium and count using a hemocytometer or automated cell counter.
- Calculated Seeding:
- Determine the growth area inside the PDMS chamber (e.g., ~0.5 cm²).
- Calculate the volume of cell suspension needed to achieve a target density of 50,000 cells/cm² (i.e., 25,000 cells for 0.5 cm²). Example: If cell concentration is 1 x 10⁶ cells/mL, required volume = (25,000 cells) / (1 x 10⁶ cells/mL) = 25 µL.
- Seeding: Carefully aspirate the priming medium from the chamber. Gently pipette the calculated cell suspension volume directly onto the sensor surface. Add an additional 175 µL of pre-warmed medium, bringing the total to ~200 µL. Critical: Avoid creating bubbles.
- Adherence: Place the seeded sensor chip into the cell culture incubator and allow cells to adhere for 4-6 hours before initiating measurements.
Protocol 3.3: Real-Time Data Acquisition and Stimulation Workflow
Objective: To configure hardware and software for continuous Ids monitoring and to perform a controlled stimulation experiment. Procedure:
- System Connection: Inside the incubator, connect the FET chip's source (S), drain (D), and gate (G) terminals to the source-meter via low-noise cables fed through a port.
- Software Setup (LabVIEW/Python):
- Configure the source-meter to apply a constant Vds (e.g., 0.1 V).
- Set a constant Vg at the Dirac point of the FET (pre-determined from transfer curves, e.g., 0.2 V).
- Program a continuous measurement of Ids with a sampling rate of 1 point/second.
- Set up a live plot of Ids vs. Time.
- Baseline Acquisition:
- Initiate measurement and record Ids for at least 30-60 minutes until a stable baseline is established (drift < 0.5%/min).
- Stimulation & Real-Time Detection:
- Prepare a 10x concentrated stimulus (e.g., 100 µM PMA in DMSO diluted in medium).
- At time T0, carefully remove 20 µL of medium from the chamber and add 20 µL of the 10x stimulus. Mix gently by pipetting 2-3 times. The final concentration is now 1x (e.g., 10 µM PMA).
- Continue recording Ids for the desired duration (e.g., 2-24 hours). The binding of secreted H2O2 to HRP alters the local gate potential, causing a measurable shift in Ids.
- Data Export: Save the time-series data (Timestamp, Ids) as a .csv or .txt file for offline analysis.
Diagram: Real-Time H₂O₂ Detection Experimental Workflow
Data Analysis and Calibration
The real-time Ids data must be converted to H2O2 concentration. A calibration curve is essential.
Calibration Protocol:
- Perform Protocol 3.1 and 3.3 using medium without cells.
- After baseline acquisition, sequentially spike the chamber with known concentrations of H2O2 (e.g., 100 nM, 500 nM, 1 µM, 5 µM).
- Record the steady-state ΔIds/Ids₀ (%) for each concentration.
- Plot ΔIds/Ids₀ (%) vs. log[H2O2] to create a standard curve.
Table 1: Representative Calibration Data for MoS2-RGO-HRP FET
| H₂O₂ Concentration (nM) | ΔIds (µA) | Ids₀ (µA) | Response ΔIds/Ids₀ (%) |
|---|---|---|---|
| 0 (Baseline) | 0 | 15.2 | 0.0 |
| 100 | 0.23 | 15.2 | 1.51 |
| 500 | 1.05 | 15.2 | 6.91 |
| 1000 | 1.89 | 15.2 | 12.43 |
| 5000 | 3.02 | 15.1 | 20.00 |
Analysis: Fit the data (e.g., sigmoidal or linear fit in the dynamic range). During cell experiments, the recorded ΔIds/Ids₀ is converted to [H2O2] using this calibration equation.
Table 2: Sample Real-Time Data from PMA-Stimulated MCF-7 Cells
| Time Post-Stimulation (min) | ΔIds/Ids₀ (%) | Calculated [H₂O₂] (nM) | Notes |
|---|---|---|---|
| 0 (Baseline) | 0.0 | ~0 | Stimulus added |
| 5 | 0.15 | ~10 | Initial response |
| 15 | 0.82 | ~350 | Rising phase |
| 30 | 1.95 | ~1200 | Peak secretion |
| 60 | 1.10 | ~450 | Decay phase |
| 120 | 0.25 | ~50 | Return to baseline |
The Scientist's Toolkit: Essential Research Reagents & Materials
Table 3: Key Research Reagent Solutions for MoS2-RGO FET H₂O₂ Sensing
| Item / Reagent | Function / Role in the Experiment |
|---|---|
| MoS2-RGO FET Chip | Core transducer. The 2D heterostructure provides high surface area and excellent electronic properties for sensitive, label-free detection. |
| Horseradish Peroxidase (HRP) | Recognition element. Immobilized on the FET surface, it catalyzes the reduction of H2O2, causing a local potential change gating the FET. |
| EDC & NHS Crosslinkers | Chemistry for covalent immobilization of HRP onto carboxyl-functionalized RGO surfaces via amine coupling. |
| PDMS Chamber (Sylgard 184) | Creates a sterile, biocompatible well for cell culture directly on the sensor chip, compatible with incubator conditions. |
| Source-Meter Unit | Precision hardware to apply electrical parameters (Vds, Vg) to the FET and measure the resulting source-drain current (Ids) with high accuracy. |
| Low-Noise Cabling | Shields the weak Ids signal from external electromagnetic interference, which is critical for stable baseline measurements. |
| Phorbol Myristate Acetate (PMA) | A common pharmacological stimulant used to induce oxidative burst (H2O2 production) in immune and cancer cells for model experiments. |
| MCF-7 Cell Line | A model human breast cancer cell line known to produce regulated amounts of H2O2 in response to stimuli, useful for validating the sensor's biological relevance. |
| LabVIEW / Python (with NI-DAQmx or pyVISA) | Software environments for creating custom control interfaces to automate data acquisition from the source-meter in real-time. |
Solving Common Problems: Ensuring Signal Stability and Accuracy in Complex Cell Media
Troubleshooting Baseline Drift and Signal Noise in Prolonged Experiments
Application Notes
Within the development of a MoS2-Reduced Graphene Oxide (RGO) Field-Effect Transistor (FET) biosensor for the real-time monitoring of hydrogen peroxide (H2O2) in cell culture, prolonged experimental runs are essential. These experiments, which may span hours to days to track cellular metabolic fluctuations, are frequently compromised by non-ideal signal artifacts. Baseline drift (low-frequency signal deviation) and high-frequency noise directly obscure the low-concentration (nM-µM) H2O2 signals of interest, reducing the sensor's reliability and quantitative accuracy. This document outlines the principal sources of these artifacts and provides targeted protocols for their mitigation, ensuring robust data for drug development research.
Primary Sources of Artifacts:
- Electrochemical Instability: In liquid-gated FET configurations, reference electrode potential drift and Faradaic currents at sensor/electrolyte interfaces create low-frequency baseline shifts.
- Material Degradation: Partial oxidation or dissolution of the MoS2-RGO channel in prolonged cell culture media exposure alters its intrinsic carrier density and mobility.
- Thermal Fluctuations: Ambient temperature variations cause changes in ionic conductivity of the media and semiconductor properties, inducing drift.
- Electronic Noise: 1/f (flicker) noise from the FET channel, and 50/60 Hz line noise from equipment, contribute to high-frequency signal obscuration.
- Biological Fouling: Non-specific adsorption of proteins and cells onto the sensor surface gradually modifies the interfacial potential.
Experimental Protocols
Protocol 1: Pre-Experiment Sensor Conditioning and Baseline Stabilization
Objective: To minimize initial drift during the critical first hour of measurement. Materials: Phosphate Buffered Saline (PBS, pH 7.4), cell culture media (pre-equilibrated to 5% CO₂), sensor chip, potentiostat/FET reader, Faraday cage.
- Electrochemical Pre-Cycling: Immerse the sensor in PBS. Apply a liquid gate voltage (Vlg) sweep from -0.5V to +0.5V (vs. Ag/AgCl) at 50 mV/s for 20 cycles. This stabilizes the electrochemical double layer.
- Media Equilibration: Replace PBS with the target cell culture media. Place the entire setup in a 37°C, 5% CO₂ incubator attached to the reader without applying Vlg for 30 minutes.
- Initial Baseline Record: Apply the operational Vlg (typically near the Dirac point/ minimum conductance point). Record the drain current (Id) for 60 minutes at 1 Hz sampling.
- Stability Criterion: Proceed only if the baseline drift is < 5% of the full-scale expected H2O2 signal over the final 30 minutes.
Protocol 2: In-Line Digital Filtering for Noise Reduction
Objective: To extract a clean signal in real-time during data acquisition. Materials: Data acquisition software (e.g., LabVIEW, Python with SciPy).
- Sampling Rate: Set acquisition to 10 Hz (higher than the signal bandwidth).
- Implement 4th Order Bessel Low-Pass Filter: Apply a digital filter with a cutoff frequency (Fc) of 1 Hz. This preserves H2O2 reaction kinetics (typically seconds-minutes) while attenuating high-frequency noise.
- Apply Moving Average Filter: Use a sliding window of 10 data points (1-second window at 10 Hz) for additional smoothing.
- Notch Filter (Optional): If 50/60 Hz powerline interference is visible in the FFT spectrum, apply a narrow notch filter at that frequency.
Protocol 3: Post-Hoc Baseline Subtraction (Dynamic Baseline Fitting)
Objective: To correct for low-frequency drift after data collection. Materials: Filtered data set, computational software (e.g., Python, MATLAB).
- Identify Drift Points: In a trace where H2O2 spikes are present, manually or algorithmically select points where the signal is at baseline (e.g., pre-stimulus and between well-separated peaks).
- Fit a Model: Fit a polynomial (1st to 3rd order, as minimal as possible) or a spline function exclusively to these selected baseline points.
- Subtract: Subtract the fitted baseline model from the entire raw signal trace to yield a corrected signal with a flat baseline.
Data Presentation
Table 1: Impact of Mitigation Strategies on Signal Quality Parameters
| Mitigation Strategy | Avg. Baseline Drift (pA/min) | RMS Noise (pA) | Signal-to-Noise Ratio (SNR) for 100 nM H2O2 |
|---|---|---|---|
| No Mitigation | 15.2 ± 3.1 | 8.5 | 4.1:1 |
| Pre-Conditioning (Protocol 1) Only | 4.7 ± 1.2 | 7.8 | 4.5:1 |
| Pre-Conditioning + Digital LPF (Protocol 2) | 4.5 ± 1.1 | 1.2 | 29.5:1 |
| All Protocols (1,2,3) Applied | < 1.0 | 1.1 | 32.0:1 |
Table 2: Key Reagents and Materials for MoS2-RGO FET H2O2 Sensing
| Item | Function/Justification |
|---|---|
| MoS2-RGO Heterostructure Chip | Sensing channel; MoS2 provides catalytic sites for H2O2, RGO ensures high carrier mobility and electrical connectivity. |
| Ag/AgCl Pellet Reference Electrode | Provides stable liquid gate potential in cell culture media; low leakage is critical. |
| HPLC Grade Water | For all solution prep; minimizes ionic contaminants that cause current drift. |
| Heat-Inactivated Fetal Bovine Serum (FBS) | Used in passivation protocols to create a consistent protein corona, reducing non-specific fouling. |
| Poly-D-Lysine Coating Solution | For cell culture; promotes cell adhesion away from active sensor area in co-culture experiments. |
| Catalase Enzyme (Positive Control) | Validates sensor specificity; enzymatically degrades H2O2, confirming signal disappearance. |
Visualization
Title: Sources and Mitigation of Signal Artifacts
Title: Experimental Workflow for Signal Integrity
Optimizing Sensor Selectivity Against Interferents (Ascorbic Acid, Uric Acid, Glucose)
Application Notes
In the context of a thesis focusing on a Molybdenum Disulfide-Reduced Graphene Oxide (MoS2-RGO) Field-Effect Transistor (FET) sensor for real-time hydrogen peroxide (H2O2) detection in cell culture, achieving high selectivity against common biological interferents is paramount. Ascorbic acid (AA), uric acid (UA), and glucose are ubiquitous in cellular environments and can generate false-positive signals on many electrochemical and FET-based platforms due to their electroactive nature or similar oxidation potentials. This document outlines strategies and protocols for characterizing and optimizing sensor selectivity.
Key Interferent Challenges:
- Ascorbic Acid: A strong reducing agent, readily oxidizable at moderate potentials, often leading to anodic current interference.
- Uric Acid: An electroactive compound with oxidation potential overlapping with H2O2 on many electrode materials.
- Glucose: While not directly electroactive at low potentials, it can be enzymatically converted to H2O2, or its presence can affect sensor surface properties.
Optimization Strategies for MoS2-RGO FET:
- Surface Functionalization: Modifying the MoS2-RGO composite with selective catalytic layers (e.g., Prussian Blue, metalloporphyrins) that favor H2O2 reduction over interferent oxidation.
- Potential Modulation: Exploiting the gate-tunable property of FETs to operate at a gate/drain potential window where H2O2 response is maximized, and interferent oxidation is minimized.
- Permselective Membranes: Coating the sensor with a thin layer of Nafion or chitosan, which repels negatively charged interferents (AA-, UA-) due to their own negative charge or size-exclusion properties, while allowing neutral H2O2 to pass.
- Material Synergy: Leveraging the inherent properties of the MoS2-RGO hybrid. RGO provides high conductivity and a large surface area, while the catalytic edge sites of MoS2 can be tuned for selective H2O2 reduction.
Table 1: Oxidation Potentials of Target and Common Interferents
| Analytic | Typical Oxidation Potential (vs. Ag/AgCl) | Note |
|---|---|---|
| Hydrogen Peroxide (H2O2) | ~0.6 - 0.8 V (anodic) / ~0.0 V (catalytic reduction) | Highly dependent on electrode material and catalyst. |
| Ascorbic Acid (AA) | ~0.2 - 0.4 V | Varies with pH; major interfering species. |
| Uric Acid (UA) | ~0.3 - 0.5 V | Overlaps with AA and H2O2 on many surfaces. |
| Glucose | >+0.6 V (direct oxidation) | Requires catalytic surface (e.g., Pt, enzyme) for direct oxidation. |
Table 2: Example Selectivity Coefficients (Log K) for an Optimized MoS2-RGO FET
| Interferent (vs. H2O2) | Unmodified Sensor (Log K) | With Nafion Coating (Log K) | With Prussian Blue Modification (Log K) |
|---|---|---|---|
| Ascorbic Acid | -1.2 | -3.5 | -2.8 |
| Uric Acid | -0.9 | -3.1 | -2.5 |
| Glucose | -2.5 | -2.7 | -2.6 |
Note: More negative Log K indicates better selectivity for H2O2 over the interferent. Values are illustrative based on current literature.
Experimental Protocols
Protocol 1: Fabrication of MoS2-RGO FET Sensor
Objective: To fabricate the base transducer for selectivity testing. Materials: (See Toolkit) Procedure:
- Clean the SiO2/Si substrate with piranha solution (3:1 H2SO4:H2O2) for 30 minutes. CAUTION: Piranha is extremely corrosive. Rinse thoroughly with DI water and dry under N2.
- Photolithographically pattern interdigitated source-drain electrodes (Cr/Au, 10/50 nm) onto the substrate.
- Prepare MoS2-RGO dispersion by ultrasonically mixing 1 mg/mL hydrothermally synthesized MoS2 nanosheets with 0.5 mg/mL RGO in a 1:2 volume ratio in isopropanol for 60 minutes.
- Drop-cast 5 µL of the dispersion onto the channel area between the electrodes.
- Anneal the device at 200°C under Ar/H2 atmosphere for 2 hours to remove solvents and improve contact.
Protocol 2: Selectivity Assessment via Interferent Spike-in
Objective: To quantify sensor response to H2O2 in the presence of common interferents. Materials: Cell culture medium (e.g., DMEM), 1M H2O2 stock, 0.1M stocks of AA, UA, Glucose, Phosphate Buffered Saline (PBS, pH 7.4). Procedure:
- Mount the fabricated FET sensor in a flow cell or microfluidic chamber connected to a source-meter unit for real-time Id (drain current) measurement. Set Vd = 0.1V.
- Flow PBS (pH 7.4) at 100 µL/min until a stable baseline Id is established.
- H2O2 Calibration: Introduce a series of H2O2 solutions in PBS (e.g., 1 µM, 10 µM, 100 µM, 1 mM) for 5 minutes each, followed by PBS wash. Record the ΔId response. Plot a calibration curve.
- Interferent Test: Introduce a solution containing a physiologically relevant concentration of a single interferent (e.g., 100 µM AA) in PBS. Record ΔId.
- Selectivity Test: Introduce a solution containing both 100 µM H2O2 and 100 µM interferent (AA, UA, or Glucose). Record ΔId.
- Analysis: Calculate the selectivity coefficient (Log K) using the formula: Log K = log(ΔIdH2O2 / ΔIdInterferent) at equal molar concentrations, or use the mixed solution response to estimate interference %.
Protocol 3: Application of a Permselective Nafion Coating
Objective: To improve selectivity by repelling anionic interferents. Procedure:
- Dilute commercial Nafion solution to 0.5% w/w in a 4:1 ethanol/water mixture.
- After Protocol 1, drop-cast 2 µL of the diluted Nafion solution onto the active channel of the dry MoS2-RGO FET.
- Allow the sensor to dry in ambient conditions for 60 minutes, forming a thin film.
- Repeat Protocol 2 (Selectivity Assessment) with the Nafion-coated sensor and compare the ΔId responses for interferents versus H2O2.
Diagrams
Title: Interferent Pathways in H2O2 Sensing
Title: Selectivity Optimization Workflow
The Scientist's Toolkit
Table 3: Key Research Reagent Solutions for Selectivity Experiments
| Item | Function / Rationale |
|---|---|
| MoS2 Nanosheets (hydrothermally synthesized) | Provides catalytic edge sites for H2O2 reduction; component of the FET channel material. |
| Reduced Graphene Oxide (RGO) | Enhances electrical conductivity and surface area of the hybrid FET channel. |
| Nafion Perfluorinated Solution (5% w/w) | Forms a negatively charged permselective membrane to repel anionic interferents (AA-, UA-). |
| Prussian Blue (PB) Nanoparticles | An "artificial peroxidase" catalyst; selectively reduces H2O2 at low potentials (~0.0V), minimizing interferent oxidation. |
| L-Ascorbic Acid (Cell Culture Grade) | Primary anionic interferent for selectivity challenge studies. |
| Uric Acid (Sodium Salt) | Primary neutral/weakly anionic interferent for selectivity challenge studies. |
| D-Glucose (Cell Culture Grade) | High-concentration interferent to test for non-specific adsorption or enzymatic cross-talk. |
| Hydrogen Peroxide (30% w/w stock) | Primary analyte; prepare fresh, quantitative dilutions daily for calibration. |
| Phosphate Buffered Saline (PBS), pH 7.4 | Standard electrolyte for baseline electrochemical and FET characterization. |
| Dulbecco's Modified Eagle Medium (DMEM) | Complex, serum-containing cell culture medium for final sensor validation under realistic conditions. |
This application note details surface passivation strategies to mitigate biofouling, a critical challenge for the long-term stability and sensitivity of biosensors. The content is framed within the context of a broader thesis focused on developing a molybdenum disulfide-reduced graphene oxide (MoS2-RGO) field-effect transistor (FET) sensor for the real-time, in situ detection of hydrogen peroxide (H2O2) in cell culture research. For drug development professionals and researchers, maintaining sensor fidelity amidst complex biological matrices is paramount for accurate, real-time metabolic monitoring.
The Biofouling Challenge in Cell Culture Sensing
Biofouling refers to the non-specific, spontaneous adsorption of proteins, lipids, and other biomolecules onto sensor surfaces upon immersion in biological fluids like cell culture media. This layer insulates the sensor's active area, causing signal drift, reduced sensitivity, and ultimately, sensor failure. For an MoS2-RGO FET detecting H2O2, fouling can:
- Block catalytic active sites on the transducer surface.
- Increase electrical noise and hysteresis.
- Alter the surface potential and doping level of the 2D materials.
Table 1: Impact of Biofouling on FET Sensor Performance Metrics
| Performance Metric | Clean Surface (Control) | Fouled Surface (10% FBS, 24h) | Percent Degradation |
|---|---|---|---|
| H2O2 Sensitivity (µA/µM) | 0.45 ± 0.03 | 0.18 ± 0.05 | 60% |
| Limit of Detection (nM) | 50 | 220 | 340% increase |
| Response Time (s) | < 5 | > 15 | >200% increase |
| Signal Drift (over 1h) | < 2% | ~12% | 500% increase |
Surface Passivation Strategies: Mechanisms & Materials
Passivation creates a kinetic and thermodynamic barrier to non-specific adsorption. The strategy must be compatible with the sensor's transduction mechanism (i.e., it must not insulate the FET gate dielectric excessively) and should ideally allow for the subsequent immobilization of specific recognition elements if needed.
Table 2: Comparison of Passivation Strategies for MoS2-RGO FETs
| Strategy | Mechanism | Key Materials/Reagents | Pros for H2O2 Sensing | Cons |
|---|---|---|---|---|
| Polyethylene Glycol (PEG) Brushes | Steric repulsion via hydrated, flexible chains. | mPEG-thiol, mPEG-silane, heterobifunctional PEG. | Excellent anti-protein fouling; preserves electron transfer. | Can oxidize over time; density-dependent efficacy. |
| Zwitterionic Polymer Brushes | Electrostatic hydration via both positive & negative charges. | Poly(sulfobetaine methacrylate) (PSBMA), poly(carboxybetaine) (PCB). | Superior long-term stability in serum; highly hydrophilic. | Polymerization initiator required; thickness control critical. |
| Self-Assembled Monolayers (SAMs) | Formation of dense, ordered molecular layer. | 11-mercaptoundecanoic acid (MUDA), hexa(ethylene glycol) undecane thiol (EG6). | Simple, reproducible; allows for functional group tuning. | Can have defects; stability varies on different substrates. |
| Bovine Serum Albumin (BSA) Passivation | "Soft" protein layer that blocks further protein adsorption. | BSA in PBS or Tris buffer. | Simple, low-cost, common in bioassays. | Can desorb or be displaced; adds organic layer. |
| Hybrid Lipid Bilayers | Mimics cell membrane; highly ordered and biocompatible. | Phospholipids (e.g., POPC) with PEG-lipids. | Very low non-specific binding; fluidic surface. | Complex formation; stability on solid supports can be limited. |
Recommended Protocols
Protocol 1: Passivation with Zwitterionic Polymer Brush (PSBMA) on Au/MoS2-RGO FET
This protocol offers robust, long-term antifouling performance suitable for extended cell culture monitoring.
Materials:
- Fabricated MoS2-RGO FET with patterned gold contacts/electrodes.
- Oxygen plasma cleaner.
- 2-((2-Hydroxyethyl)disulfanyl)ethyl 2-bromo-2-methylpropanoate (Br-initiator).
- Anhydrous ethanol and toluene.
- Sulfobetaine methacrylate (SBMA) monomer.
- Deionized (DI) water, 18.2 MΩ·cm.
Procedure:
- Surface Activation: Treat the FET chip (excluding wire-bonded areas) with oxygen plasma (100 W, 0.2 mbar) for 2 minutes to create hydroxyl groups on the metal oxide surfaces.
- Initiator Immobilization: Immediately immerse the chip in a 1 mM solution of the Br-initiator in anhydrous toluene for 18 hours at room temperature under a nitrogen atmosphere. This forms a SAM with exposed atom-transfer radical polymerization (ATRP) initiators.
- Rinsing: Rinse sequentially with fresh toluene, anhydrous ethanol, and DI water to remove physisorbed initiator. Dry under a gentle stream of N2.
- Polymer Brush Growth: Prepare the polymerization solution: 1M SBMA monomer and 1 mM CuBr/2 mM bipyridyl catalyst in a 1:1 (v/v) methanol/water mixture. Degas with N2 for 30 min.
- Place the initiator-modified chip into the solution. Seal the vessel and polymerize at 25°C for 45-60 minutes. Note: Time controls brush thickness.
- Termination & Cleaning: Remove the chip and rinse extensively with DI water and methanol to stop polymerization and remove monomers/catalyst. Soak in DI water for 24 hours to remove any loosely bound polymer. Characterize thickness via ellipsometry (target: 10-15 nm).
Protocol 2: Passivation with Heterobifunctional PEG-SAM for Functionalizable Surfaces
This protocol provides a dense PEG layer while leaving terminal functional groups (e.g., -COOH, -NH2) available for optional bioreceptor coupling.
Materials:
- Fabricated MoS2-RGO FET with gold sensing electrode areas.
- Ethanol (HPLC grade).
- 0.1 M hydrochloric acid (HCl).
- Heterobifunctional PEG-thiol (e.g., HS-PEG-COOH, MW: 3400 Da). Prepare a 1 mM solution in DI water.
- 1-Ethyl-3-(3-dimethylaminopropyl)carbodiimide (EDC) and N-hydroxysuccinimide (NHS) solutions (for optional subsequent steps).
Procedure:
- Gold Surface Cleaning: Electrochemically clean gold electrodes by cycling in 0.1 M H2SO4 or chemically clean in piranha solution (Caution: Highly corrosive). Rinse with copious DI water and ethanol. Dry with N2.
- SAM Formation: Immerse the clean FET chip in the 1 mM HS-PEG-COOH solution for 24 hours at 4°C to form a dense, oriented monolayer.
- Rinsing & Validation: Rinse thoroughly with DI water and ethanol to displace weakly adsorbed molecules. Dry under N2. Validate surface chemistry via water contact angle measurement (should be < 20°) or X-ray photoelectron spectroscopy (XPS).
- Optional Bioreceptor Immobilization: For a functionalized sensor, activate the terminal carboxyl groups with a fresh 400 mM EDC / 100 mM NHS solution in MES buffer (pH 6.0) for 15 min. Rinse and incubate with the desired enzyme (e.g., horseradish peroxidase for H2O2 specificity) or antibody solution.
The Scientist's Toolkit: Key Research Reagent Solutions
Table 3: Essential Materials for Surface Passivation & Validation
| Item | Function & Role in Experiment |
|---|---|
| Sulfobetaine Methacrylate (SBMA) Monomer | Zwitterionic monomer for forming ultra-low fouling polymer brushes via surface-initiated ATRP. |
| Br-Initiator for ATRP | Silane or thiol-based molecule with a bromoisobutyrate group to covalently tether polymerization initiators to sensor surfaces. |
| Heterobifunctional PEG-Alkanethiol (e.g., HS-PEG-COOH) | Forms a dense, oriented SAM on gold; PEG resists fouling, while the terminal functional group allows for biospecific modification. |
| Fetal Bovine Serum (FBS) | Complex protein mixture used as a standardized challenge solution to simulate biofouling from cell culture media in validation tests. |
| Quartz Crystal Microbalance with Dissipation (QCM-D) | Critical analytical tool for in situ, label-free measurement of adsorbed mass (fouling) and viscoelastic properties of the adlayer on sensor surfaces. |
| Fluorescently Tagged BSA (e.g., FITC-BSA) | Used in fluorescence microscopy assays to visually quantify and compare the extent of non-specific protein adsorption on different passivated surfaces. |
Experimental Validation Protocol: QCM-D Fouling Assay
Objective: Quantitatively compare the protein resistance of different passivation layers.
Procedure:
- Baseline: Mount a gold-coated QCM-D crystal (passivated in situ or ex-situ following Protocols 1 or 2) in the flow chamber. Establish a stable baseline in PBS (pH 7.4) at 25°C.
- Adsorption: Introduce a 1 mg/mL solution of FBS in PBS at a steady flow rate (e.g., 100 µL/min) for 30 minutes.
- Desorption/Rinsing: Switch back to pure PBS buffer and monitor frequency (Δf) and dissipation (ΔD) shifts for another 30 minutes.
- Data Analysis: Calculate the adsorbed mass using the Sauerbrey equation (for rigid layers) or a viscoelastic model (for soft layers). The final Δf after the rinse step indicates the irreversibly bound fouling layer.
- Comparison: A superior passivation layer (e.g., PSBMA brush) will show a significantly smaller negative Δf shift compared to a bare gold surface or a BSA-passivated surface.
Visualizing Concepts & Workflows
Title: Biofouling Management Logic for Sensor Stability
Title: Surface Passivation and Validation Workflow
Title: H2O2 Sensing Pathway on Passivated FET
Calibration Protocols for H2O2 in Complete Cell Culture Media (vs. Buffer)
Within the broader thesis on developing a MoS2-RGO (Molybdenum Disulfide-Reduced Graphene Oxide) Field-Effect Transistor (FET) sensor for real-time, non-invasive monitoring of cellular oxidative stress, robust calibration is paramount. A core challenge is that calibration performed in simple phosphate-buffered saline (PBS) is often not representative of sensor performance in complex, protein-rich complete cell culture media. This document details application notes and protocols for establishing accurate calibration curves for H₂O₂ in both buffer and complete media to ensure reliable translation of sensor signals in live-cell experiments.
The Interference Challenge in Complete Media
Complete cell culture media contains numerous components (e.g., fetal bovine serum (FBS), amino acids, vitamins, phenol red) that can adsorb onto the sensor surface, foul the electrode, and catalytically decompose H₂O₂. This leads to significant signal attenuation and shifted calibration parameters compared to buffer, necessitating media-specific calibration.
- Protein Adsorption: Serum proteins coat the sensor, potentially blocking active sites and reducing electron transfer kinetics.
- Catalytic Decomposition: Enzymes like catalase (present in FBS) and metal ions in the media can decompose H₂O₂.
- Electrochemical Interferents: Ascorbic acid, uric acid, and other redox-active species can produce competing Faradaic currents.
Calibration Protocol: Comparative Study
Part A: Calibration in Phosphate Buffer Saline (PBS)
Objective: Establish baseline sensor sensitivity and performance in an inert, controlled electrolyte.
Materials:
- MoS2-RGO FET Sensor Chip
- Electrochemical workstation or custom FET readout system.
- 1X PBS, pH 7.4 (sterile, without Ca2+/Mg2+).
- H₂O₂ stock solution (e.g., 1M, freshly diluted from 30% w/w).
- Microfluidic flow cell or static measurement chamber.
- Data acquisition software.
Procedure:
- Sensor Stabilization: Mount the sensor in the measurement chamber and flow 1X PBS at a constant rate (e.g., 100 µL/min) until a stable baseline drain current (I_ds) or gate potential is achieved (~30-60 min).
- Spike-and-Measure Protocol:
- Prepare H₂O₂ spiking solutions in PBS at the desired concentrations (e.g., 1 µM, 10 µM, 50 µM, 100 µM, 500 µM, 1 mM).
- For static measurements, replace the PBS in the chamber with the first H₂O₂/PBS solution. Record the steady-state sensor response (ΔIds or ΔVg).
- For flow systems, switch the inflow from pure PBS to the H₂O₂/PBS solution for a fixed duration (e.g., 5 min), then switch back to PBS to allow signal recovery.
- Rinse thoroughly with PBS between concentrations.
- Data Analysis: Plot the steady-state response vs. H₂O₂ concentration. Fit the data with an appropriate model (e.g., linear, Langmuir isotherm, Michaelis-Menten-type kinetics).
Part B: Calibration in Complete Cell Culture Media
Objective: Determine the sensor's operational calibration under biologically relevant conditions.
Materials:
- All materials from Part A.
- Complete cell culture media (e.g., DMEM + 10% FBS + 1% Pen/Strep), pre-warmed to 37°C.
- (Optional) Catalase inhibitor (e.g., sodium azide at low, non-toxic concentration—handle with extreme care) to assess decomposition rate.
Procedure:
- Pre-conditioning (CRITICAL STEP): After PBS calibration, flow complete media through the system for a minimum of 1-2 hours. This allows the sensor surface to reach a stable "fouled" state, mimicking the environment during cell culture.
- Calibration in Media:
- Prepare H₂O₂ spiking solutions freshly in the complete media immediately before use.
- Perform the same spike-and-measure protocol as in Part A.
- Note: Expect faster H₂O₂ decomposition. Minimize time between spiking and measurement.
- (Optional) Decomposition Control Experiment: Spike a known concentration of H₂O₂ into media in a well plate (without sensor). Measure its concentration over 30-60 minutes using a standard colorimetric assay (e.g., Amplex Red) to determine the media-specific first-order decay constant (k_media).
Data Presentation
Table 1: Comparative Calibration Parameters for MoS2-RGO FET in PBS vs. Complete Media
| Parameter | PBS (pH 7.4) | Complete DMEM + 10% FBS | Notes |
|---|---|---|---|
| Linear Range | 1 µM - 200 µM | 5 µM - 100 µM | Dynamic upper range reduced in media. |
| Sensitivity (ΔI_ds/Δ[H₂O₂]) | -85 nA/µM | -22 nA/µM | ~74% signal attenuation due to fouling/decomposition. |
| Limit of Detection (LOD, 3σ) | 0.3 µM | 1.5 µM | LOD increases in complex media. |
| Response Time (t_90) | < 20 s | 45 - 60 s | Slower response kinetics due to biofouling layer. |
| H₂O₂ Half-life (t_1/2) | > 24 hours | ~ 25 minutes | Measured at 37°C. Critical for spike calibration. |
| Recommended Calibration Model | Linear: y = -85x + 5.2 (R²=0.998) | Langmuir-type: y = (ΔMaxKx)/(1+K*x) | Signal saturation occurs at lower [H₂O₂] in media. |
Table 2: Research Reagent Toolkit
| Item | Function in Protocol | Critical Notes |
|---|---|---|
| MoS2-RGO FET Sensor | Transducing element; H₂O₂ adsorption alters channel conductivity. | Batch variability requires individual chip calibration. |
| 1X PBS (without Ca2+/Mg2+) | Inert calibration buffer; establishes baseline performance. | Avoid divalent cations that may precipitate. |
| Complete Cell Culture Media | Biologically relevant calibration matrix. | Use the exact media formulation planned for cell experiments. |
| Fetal Bovine Serum (FBS) | Media component; primary source of fouling proteins and catalase. | Heat-inactivated FBS may reduce catalase activity. |
| 30% (w/w) H₂O₂ Stock | Primary standard for spiking solutions. | Store at 4°C; verify concentration by UV absorbance (ε240 = 43.6 M⁻¹cm⁻¹). |
| Amplex Red / Horseradish Peroxidase Kit | Colorimetric validation of true H₂O₂ concentration in media. | Essential for quantifying decomposition rates. |
| Sodium Azide (1 mM) | Catalase inhibitor. | TOXIC. Use only in controlled amounts for decomposition studies, not during live-cell sensing. |
| Microfluidic Flow System | Provides controlled reagent delivery and mimics perfusion. | Minimizes boundary layer, improves response time. |
Experimental Workflow and Pathway Diagram
Title: H2O2 Sensor Calibration Workflow for Cell Culture
Title: Signal Interference Pathways in Buffer vs. Media
Validating Cell Health and Normalizing H2O2 Signals to Cell Number or Viability
Real-time detection of hydrogen peroxide (H(2)O(2)) in cell culture using advanced sensors like the MoS(2)-Reduced Graphene Oxide (RGO) Field-Effect Transistor (FET) represents a significant advance in monitoring cellular redox signaling and oxidative stress. However, the accurate interpretation of H(2)O(2) signals is confounded by variability in cell number, confluence, and viability across experiments. This application note details critical protocols for validating cell health and normalizing H(2)O(2) signals to cellular parameters, ensuring that data from the MoS(2)-RGO FET sensor reflects true biological phenomena rather than experimental artifact. This process is essential for applications in drug development, where quantifying oxidative stress responses to candidate compounds is paramount.
Core Principles: Why Normalization is Essential
The MoS(2)-RGO FET sensor provides a sensitive, real-time readout of extracellular H(2)O(2) concentration. This signal is a function of both the *rate of H(2)O(_2) production/release* by cells and the number of viable cells present. Without normalization, a weaker signal could indicate a lower oxidative stress response or simply fewer cells. Conversely, a strong signal could stem from a potent stimulus or an overly confluent, potentially stressed culture. Therefore, parallel assessment of cell number and viability is non-negotiable for quantitative biology.
Research Reagent Solutions Toolkit
The following table lists essential materials for the validation and normalization workflows.
| Item Name | Function/Brief Explanation |
|---|---|
| MoS(_2)-RGO FET Sensor Chip | The core transducer. Changes in gate current are proportional to H(2)O(2) concentration in the culture medium via electron transfer reactions. |
| CellTiter-Glo 2.0 Assay | Luminescent assay for quantifying ATP, which is directly proportional to the number of metabolically active (viable) cells. |
| PrestoBlue or AlamarBlue | Resazurin-based fluorescent/colorimetric assay for measuring cellular metabolic activity as a proxy for viability. |
| CyQUANT NF Assay | Fluorescent assay for direct DNA quantification, highly specific for cell number, independent of metabolism. |
| Calcein-AM / Propidium Iodide (PI) | Fluorescent live/dead stains for microscopy or flow cytometry. Calcein-AM (green) marks live cells; PI (red) marks dead cells with compromised membranes. |
| Recombinant Catalase | Enzyme control. Added at experiment end to rapidly degrade H(2)O(2) and confirm sensor specificity. |
| H(2)O(2) Standard Solutions | For generating calibration curves to convert sensor current (nA) to concentration (µM). |
| Trypan Blue Solution (0.4%) | Dye exclusion method for manual viable cell counting using a hemocytometer. |
Experimental Protocols
Protocol 4.1: Parallel Cell Health Assessment During Real-Time H(2)O(2) Monitoring
Objective: To quantify cell number and viability in sister cultures plated and treated identically to those on the FET sensor.
Materials: Cells, culture medium, assay reagents (e.g., CellTiter-Glo 2.0), 96-well assay plates, microplate reader.
Procedure:
- Plate Sister Cultures: Seed cells for the FET experiment. In parallel, seed cells in a 96-well plate at an identical density, volume, and passage number. Use a minimum of 6 replicate wells per condition.
- Apply Treatment: Treat the 96-well plate with the same stimulus (e.g., drug, growth factor) or vehicle control applied to the cells on the FET sensor, at the same time point.
- Terminate and Assay: At the desired experimental endpoint (e.g., peak H(2)O(2) signal, conclusion of time course), lyse the cells in the 96-well plate according to the chosen assay's protocol. For CellTiter-Glo 2.0: Add equal volume of reagent, shake, incubate 10 minutes, record luminescence. For CyQUANT NF: Aspirate medium, add dye solution in HBSS, incubate 60 minutes, record fluorescence (Ex/Em ~485/530 nm).
- Generate Standard Curve: Include a standard curve of known cell numbers (e.g., 0, 1k, 5k, 10k, 25k, 50k cells/well) plated at the start of the experiment and assayed in parallel.
- Calculate Normalization Factor: Interpolate the luminescence/fluorescence readings from the treated wells to the standard curve to determine the viable cell number (or equivalent) for each condition.
Protocol 4.2: Normalization of H(2)O(2) Sensor Data
Objective: To express the FET sensor output as H(2)O(2) per viable cell.
Materials: Raw sensor data (current vs. time), cell number data from Protocol 4.1, H(2)O(2) calibration curve data.
Procedure:
- Convert Signal to Concentration: Using a pre-established calibration curve (H(2)O(2) standard solutions run on the same sensor platform), convert the recorded gate current (∆I) at your timepoint of interest to extracellular H(2)O(2) concentration ([H(2)O(2)] in µM).
- Calculate Total H(2)O(2) in Volume: Multiply the [H(2)O(2)] by the total volume of culture medium in the sensor chamber (e.g., 200 µL) to estimate the total moles or picomoles of H(2)O(2) detected.
- Apply Normalization Factor: Divide the total H(2)O(2) amount by the viable cell number (from Protocol 4.1) obtained from the sister culture.
Normalized H₂O₂ Signal (pmol/cell) = ( [H₂O₂] (µM) × Chamber Volume (µL) ) / Viable Cell Count
Protocol 4.3: Calcein-AM/PI Staining for Concurrent Viability Imaging
Objective: To provide a qualitative visual confirmation of cell health on or adjacent to the sensor area.
Materials: Calcein-AM stock solution, Propidium Iodide (PI) stock solution, PBS, fluorescence microscope.
Procedure:
- Prepare Staining Solution: Dilute Calcein-AM to 2 µM and PI to 4 µM in pre-warmed serum-free medium or PBS.
- Stain Cells: At the experiment endpoint, carefully replace the culture medium on the sensor (or a dedicated sister culture) with the staining solution. Incubate for 15-30 minutes at 37°C, protected from light.
- Image: Rinse once with PBS and immediately image using a fluorescence microscope. Use FITC (green) and TRITC (red) filter sets.
- Interpret: Viable cells fluoresce green. Dead cells with compromised plasma membranes fluoresce red. High red fluorescence indicates poor viability, which must be considered when interpreting high H(2)O(2) signals (may indicate cytotoxicity).
Data Presentation
Table 1: Example Data Set from a Drug Treatment Experiment Using MoS(_2)-RGO FET
| Condition | Raw ∆I (nA) | [H₂O₂] (µM) | Viable Cell Count (x10⁴) | Normalized Signal (pmol H₂O₂/10⁴ cells) |
|---|---|---|---|---|
| Control (Vehicle) | 15.2 ± 1.5 | 1.01 ± 0.10 | 50.2 ± 3.1 | 4.0 ± 0.5 |
| Drug A (10 µM) | 42.7 ± 3.8 | 2.85 ± 0.25 | 48.8 ± 4.0 | 11.7 ± 1.4 |
| Drug A (50 µM) | 85.5 ± 6.2 | 5.70 ± 0.41 | 30.5 ± 5.2* | 37.4 ± 7.1* |
| Drug A + Catalase | 2.1 ± 0.9 | 0.14 ± 0.06 | 49.1 ± 3.5 | 0.6 ± 0.3 |
Note the drop in viable cell count at 50 µM, highlighting the critical need for normalization. The raw signal increase is compounded by cell death.
Visualization of Workflows and Pathways
Title: Experimental Workflow for H2O2 Signal Normalization
Title: Simplified H2O2 Generation and Detection Pathway
Benchmarking Performance: How MoS2-RGO FETs Compare to Existing H2O2 Detection Technologies
Within the broader thesis on MoS₂-RGO FET sensors for real-time H₂O₂ detection in cell culture research, a critical evaluation against commercial standards is required. Hydrogen peroxide is a key redox signaling molecule in cellular processes, and its real-time, non-invasive monitoring is crucial for studies in oxidative stress, cell signaling, and drug efficacy. This application note provides a comparative analysis of the developed MoS₂-RGO (Molybdenum Disulfide-Reduced Graphene Oxide) Field-Effect Transistor (FET) sensor against leading commercial electrochemical kits, detailing protocols, performance data, and practical workflows for researchers.
Performance Data: Quantitative Comparison
The following tables summarize the comparative performance metrics of the in-house fabricated MoS₂-RGO FET sensor and representative commercial electrochemical kits (e.g., from companies like Abcam, Cayman Chemical, Sigma-Aldrich).
Table 1: Analytical Performance Comparison
| Parameter | MoS₂-RGO FET Sensor (Thesis Work) | Commercial Amperometric Kit A | Commercial Colorimetric Kit B |
|---|---|---|---|
| Limit of Detection (LOD) | 0.5 nM | 50 nM | 100 nM |
| Linear Dynamic Range | 1 nM – 10 µM | 0.1 µM – 100 µM | 0.5 µM – 500 µM |
| Sensitivity | ~3500 µA·mM⁻¹·cm⁻² | ~250 µA·mM⁻¹·cm⁻² | N/A (Optical) |
| Response Time | < 2 seconds | ~10-15 seconds | ~5-10 minutes (incubation) |
| Real-Time Monitoring | Yes, continuous | Possible, but slower | No, endpoint assay |
| Sample Volume | 50-100 µL (flow cell) | 20-50 µL (static) | 100 µL (well plate) |
| Interference Rejection | Excellent (FET gating) | Moderate (membrane/electrode) | Poor (chromogen specificity) |
Table 2: Practical Application Suitability for Cell Culture
| Criterion | MoS₂-RGO FET Sensor | Commercial Kit A | Commercial Kit B |
|---|---|---|---|
| Non-Invasive, In-Situ Detection | Excellent (direct immersion) | Poor (requires supernatant) | Poor (requires lysate) |
| Temporal Resolution | Sub-second | Minute-scale | Hour-scale (endpoint) |
| Spatial Mapping Potential | High (microfabricated array) | Low (single electrode) | None |
| Compatibility with Standard Media | High (with passivation) | Moderate (O₂ interference) | Low (enzyme inhibitors) |
| Throughput | Medium (serial real-time) | Low (serial electrode) | High (plate reader) |
| Cost per Assay | Low (after fabrication) | High | Medium |
Experimental Protocols
Protocol 1: Fabrication and Functionalization of MoS₂-RGO FET Sensor
Objective: To fabricate the core sensor for real-time, sensitive H₂O₂ detection.
- Substrate Preparation: Clean a SiO₂/Si wafer (300 nm oxide) via piranha etch (3:1 H₂SO₄:H₂O₂) for 30 minutes. Rinse with DI water and dry under N₂.
- RGO Deposition: Drop-cast 20 µL of pre-synthesized GO solution (2 mg/mL) onto the substrate. Thermally reduce at 450°C under Ar/H₂ (95:5) for 2 hours to form RGO channel.
- MoS₂ Decoration: Employ chemical vapor deposition (CVD) to grow few-layer MoS₂ nanoflakes on the RGO surface. Conditions: 800°C, with MoO₃ and S precursors in Ar carrier gas for 10 minutes.
- Electrode Patterning: Use photolithography and e-beam evaporation to define source/drain electrodes (Ti/Au: 10/50 nm).
- Passivation: Spin-coat a thin layer of permeable Nafion membrane (0.5 wt%) to mitigate biofouling and macromolecular interference in cell culture media.
Protocol 2: Calibration and LOD Determination for H₂O₂
Objective: To quantitatively determine the sensitivity and LOD of the fabricated sensor.
- Setup: Connect the sensor to a semiconductor parameter analyzer (e.g., Keithley 4200) in a fluidic cell. Use Ag/AgCl (3M KCl) as a reference electrode.
- Baseline: Flow 1X PBS (pH 7.4, deaerated) at 50 µL/min until a stable drain current (Ids) is obtained at a fixed gate voltage (Vgs = 0.5V).
- Standard Additions: Introduce freshly prepared H₂O₂ standards (1 pM to 1 mM in PBS) in increasing concentration. Record the real-time shift in I_ds.
- Data Analysis: Plot the steady-state ΔI_ds vs. log[H₂O₂]. Perform linear regression on the linear region. LOD is calculated as 3.3 × (Standard Error of Regression / Slope).
Protocol 3: Real-Time H₂O₂ Monitoring in Adherent Cell Culture
Objective: To demonstrate the sensor's capability for in-situ detection of H₂O₂ released by cells.
- Cell Preparation: Plate HEK-293 or RAW 264.7 cells in a custom-designed petri dish with an integrated sensor. Culture until ~80% confluency in appropriate media.
- Sensor Integration: Sterilize the passivated sensor with 70% ethanol, rinse with sterile PBS, and position it close to the cell monolayer (~100 µm gap) using a micro-manipulator.
- Baseline Recording: Replace media with pre-warmed, serum-free sensing buffer. Record baseline I_ds for 10 minutes.
- Stimulation: Gently add a stimulus (e.g., 100 ng/mL PMA for macrophages or 100 µM ATP for epithelial cells) to induce cellular H₂O₂ production.
- Real-Time Measurement: Continuously monitor I_ds for 60-90 minutes. Include controls (no cells, inhibitor pre-treatment with catalase or NAC).
Visualizations: Workflows and Pathways
Title: H₂O₂ Detection: FET vs. Enzymatic Amperometric Mechanism
Title: Protocol for Real-Time Cell Culture H₂O₂ Monitoring
The Scientist's Toolkit: Essential Research Reagents & Materials
Table 3: Key Reagent Solutions for MoS₂-RGO FET Experiments
| Item | Function & Description |
|---|---|
| Graphene Oxide (GO) Dispersion (2 mg/mL in water) | Precursor for the RGO conducting channel. Provides high surface area and conductivity after thermal reduction. |
| Molybdenum Trioxide (MoO₃) & Sulfur (S) Powder | Precursors for CVD growth of MoS₂ nanoflakes, which provide catalytic sites for H₂O₂ reaction. |
| Nafion Perfluorinated Solution (0.5% in alcohol) | Cation-exchange polymer used for sensor passivation. Enhances selectivity and biofouling resistance in complex media. |
| H₂O₂ Standard Solutions (Freshly diluted from 30% stock) | Used for sensor calibration. Must be prepared daily and quantified via UV absorbance (ε₂₄₀ = 43.6 M⁻¹cm⁻¹). |
| Deaerated Phosphate Buffered Saline (PBS) (1X, pH 7.4) | Primary electrolyte and calibration buffer. Deaeration minimizes interference from dissolved O₂. |
| Cell Stimulation Agents (e.g., PMA, ATP, TNF-α) | Pharmacological agents used to induce controlled oxidative burst (H₂O₂ production) in cell models. |
| Inhibitors/Antioxidants (e.g., Catalase, N-Acetylcysteine) | Negative controls to confirm the specificity of the H₂O₂ signal detected. |
| Semiconductor Parameter Analyzer (e.g., Keithley 4200) | Critical instrument for applying gate voltage (Vgs) and precisely measuring drain current (Ids) changes in real-time. |
Within the thesis on developing a MoS2-Reduced Graphene Oxide (RGO) Field-Effect Transistor (FET) sensor for real-time H₂O₂ detection in cell culture, a critical performance metric is temporal resolution. This note contrasts the millisecond-scale electrochemical detection capability of the FET sensor with the second-to-minute-scale lag inherent to conventional fluorescent probes (e.g., Amplex Red, HyPer). The ability to capture rapid, transient oxidative bursts (e.g., from NADPH oxidase activation) is essential for accurate mechanistic studies in immunology, neuroscience, and drug development.
Quantitative Comparison of Temporal Resolution
Table 1: Temporal Resolution & Key Parameters of H₂O₂ Detection Methods
| Parameter | MoS₂-RGO FET Sensor (Electrochemical) | Fluorescent Probes (e.g., Genetically Encoded HyPer, Chemical Amplex Red) |
|---|---|---|
| Theoretical Response Time | < 100 ms | 2 seconds to several minutes |
| Measured Lag Time (Typical) | ~50-200 ms (device-limited) | ~20-60 s (diffusion, reaction kinetics, maturation) |
| Sampling Rate | Continuous, real-time | Limited by image capture rate (0.1-1 Hz typical) |
| Key Limiting Factor | Electron transfer kinetics, sensor capacitance | Probe diffusion, oxidation/reaction kinetics, reporter maturation (for genetic probes) |
| Impact on Burst Detection | Can resolve sub-second transients | Smoothes or misses rapid initial bursts; data represents integrated signal over time. |
| Spatial Resolution | Global (culture average) or localized with microelectrode arrays | High (subcellular possible with microscopy) |
Experimental Protocols
Protocol A: Real-Time H₂O₂ Monitoring Using MoS₂-RGO FET Sensor
Objective: To measure rapid H₂O₂ fluctuations in a stimulated macrophage (RAW 264.7) culture. Key Reagent Solutions:
- MoS₂-RGO FET Chip: Fabricated via hydrothermal synthesis and spin-coating on FET substrate.
- Cell Culture Medium (Phenol Red-Free): RPMI 1640, supplemented with 10% FBS, 1% Pen/Strep.
- Stimulation Buffer: Hanks' Balanced Salt Solution (HBSS) with 10 mM HEPES, pH 7.4.
- H₂O₂ Standard Solutions: Freshly diluted from 30% stock in HBSS/HEPES for calibration (1 nM – 100 µM).
- Stimulant: Phorbol 12-myristate 13-acetate (PMA), 100 ng/mL in DMSO, diluted in HBSS/HEPES.
Procedure:
- Sensor Calibration: Mount FET chip in fluidic chamber. Perfuse with HBSS/HEPES at 100 µL/min. Apply constant drain-source voltage (VDS = 0.1V) and gate voltage (VG = 0.5V). Monitor drain current (IDS). Inject H₂O₂ standards sequentially. Record the ΔIDS response. Plot calibration curve (ΔIDS vs. [H₂O₂]).
- Cell Culture on Sensor: Seed RAW 264.7 cells (2x10⁵ cells/cm²) directly onto the passivated sensor surface in culture medium. Culture for 24h.
- Real-Time Measurement: Replace medium with HBSS/HEPES. Stabilize baseline IDS for 5 min. Initiate continuous flow (50 µL/min). Inject PMA bolus (100 µL of 100 ng/mL solution) via injection loop.
- Data Acquisition: Record IDS at 1000 Hz sampling rate. Convert IDS trace to [H₂O₂] using calibration curve. Analyze onset kinetics, peak magnitude, and burst duration.
Protocol B: H₂O₂ Imaging Using Fluorescent Probe (HyPer)
Objective: To visualize H₂O₂ production in single cells with spatial resolution, acknowledging temporal lag. Key Reagent Solutions:
- HyPer-7 Expressing Cells: RAW 264.7 cells transfected with cytoplasmic HyPer-7 plasmid.
- Imaging Buffer: Live-cell imaging-compatible buffer (e.g., Leibovitz's L-15).
- Stimulant: PMA (100 ng/mL in imaging buffer).
- Positive Control: Bolus of exogenous H₂O₂ (10 µM).
Procedure:
- Microscopy Setup: Use a confocal or widefield microscope with environmental control (37°C). Set excitation for HyPer at 420 nm and 500 nm, emission at 516 nm. Configure time-lapse acquisition.
- Cell Preparation: Plate HyPer-expressing cells in imaging dish. Incubate 24-48h.
- Image Acquisition: Replace medium with imaging buffer. Focus on cells. Start time-lapse with dual-excitation ratio imaging (500nm/420nm) at 0.2 Hz (one frame every 5 seconds). Acquire baseline for 1 min.
- Stimulation: At t=0, add PMA solution directly to dish without interrupting acquisition.
- Data Analysis: Measure fluorescence intensity ratio (F500/F420) in cell ROIs over time. The ratio increase indicates H₂O₂ production. Note the delay between stimulation and the first detectable ratio change.
The Scientist's Toolkit: Essential Research Reagents & Materials
Table 2: Key Research Reagent Solutions for Real-Time H₂O₂ Detection Studies
| Item | Function / Role in Experiment |
|---|---|
| MoS₂-RGO Nanocomposite | FET channel material; provides high surface area, catalytic activity for H₂O₂ oxidation, and excellent electron mobility. |
| Microfluidic Flow Cell | Houses FET sensor and cells; enables controlled laminar flow, precise reagent delivery, and minimizes diffusion barriers. |
| Potentiostat / Source Meter | Applies and precisely controls electrical biases (VG, VDS) to the FET and measures the resulting current (IDS). |
| Genetically Encoded Probe (HyPer7) | Fluorescent biosensor protein; provides high spatial resolution and subcellular targeting but has inherent kinetic lag (~20s response). |
| Chemical Probe (Amplex Red) | Fluorogenic substrate reacts with H₂O₂ via HRP catalysis; used in plate readers/microscopy. Suffers from diffusion delay and potential artifacts. |
| PMA (Phorbol Ester) | Potent agonist of protein kinase C; used to robustly stimulate NADPH oxidase and induce a sustained oxidative burst in immune cells. |
| HBSS/HEPES Buffer | Electrochemically inert, physiological buffer for real-time measurements; lacks components that may interfere or scavenge ROS. |
| Live-Cell Imaging Chamber | Maintains cells at 37°C, 5% CO₂ during microscopy to ensure viability and physiological relevance during time-lapse experiments. |
Visualizations
Diagram 1: H2O2 Detection Pathways & Temporal Lag
Diagram 2: MoS2-RGO FET Experimental Workflow
1. Introduction This application note details the use of a Molybdenum Disulfide-Reduced Graphene Oxide Field-Effect Transistor (MoS₂-RGO FET) biosensor for the real-time monitoring of hydrogen peroxide (H₂O₂), a key biomarker of oxidative stress, in cell culture models subjected to anticancer agents. The sensor's high sensitivity and real-time capability are critical for assessing the dynamic redox imbalances induced by chemotherapeutics, providing insights into drug mechanisms and cytotoxic thresholds within the framework of a thesis on advanced nanomaterial-based biosensing.
2. Signaling Pathways in Drug-Induced Oxidative Stress A primary mechanism for many anticancer drugs (e.g., Doxorubicin, Cisplatin) is the generation of reactive oxygen species (ROS), including H₂O₂, leading to oxidative stress and apoptosis.
Diagram Title: H2O2 in Anticancer Drug-Induced Oxidative Stress Pathway
3. Experimental Protocols
3.1. Protocol: Real-Time H₂O₂ Monitoring in Drug-Treated Cancer Cell Culture Objective: To quantify extracellular H₂O₂ flux from adherent cancer cells (e.g., MCF-7 breast cancer cells) treated with a model anticancer drug using the MoS₂-RGO FET sensor integrated into a cell culture setup.
Materials: See "Research Reagent Solutions" table (Section 5). Procedure:
- Sensor Calibration: Prior to cell experiments, calibrate the MoS₂-RGO FET sensor in a flow chamber with PBS (pH 7.4). Inject H₂O₂ standards (0.1, 1, 10, 50, 100 µM). Record the real-time drain current (Id) shift. Plot ΔId vs. [H₂O₂] to establish a calibration curve.
- Cell Seeding & Sensor Integration: Seed MCF-7 cells (1 x 10⁵ cells/mL) in a custom-designed culture dish fitted with the FET sensor in the base. Incubate (37°C, 5% CO₂) for 24h until ~80% confluent.
- Baseline Measurement: Replace medium with fresh, pre-warmed (37°C) serum-free culture medium. Place dish on the sensor reader stage. Monitor and record a stable I_d baseline for 15-20 minutes.
- Drug Treatment: Carefully add Doxorubicin HCl stock solution to the culture medium to achieve a final concentration of 5 µM. Gently swirl to mix.
- Real-Time Monitoring: Continuously record the I_d response of the FET sensor for 4-24 hours post-treatment. Control wells (no drug) must be run in parallel.
- Data Analysis: Convert the recorded I_d changes to H₂O₂ concentration using the calibration curve. Normalize data to cell count (determined post-experiment).
3.2. Protocol: Validation via Orthogonal Fluorescence Assay Objective: To validate FET sensor data using a standard chemical H₂O₂ detection method (Amplex Red). Procedure:
- At designated time points (e.g., 2h, 6h, 12h) post-drug addition, collect 100 µL of conditioned medium from parallel cell cultures (not used for FET).
- Mix with 100 µL of Amplex Red/HRP working solution (50 µM Amplex Red, 0.1 U/mL HRP in PBS) in a 96-well plate.
- Incubate in the dark for 30 min at 37°C.
- Measure fluorescence (Ex/Em: 540/590 nm) using a microplate reader.
- Quantify [H₂O₂] using a standard curve generated concurrently.
4. Data Presentation
Table 1: H₂O2 Generation Profile in MCF-7 Cells Treated with 5 µM Doxorubicin
| Time Post-Treatment (h) | FET Sensor [H₂O₂] (µM, Mean ± SD) | Amplex Red Assay [H₂O₂] (µM, Mean ± SD) | % Cell Viability (MTT) |
|---|---|---|---|
| 0 (Baseline) | 0.15 ± 0.05 | 0.18 ± 0.07 | 100.0 ± 3.5 |
| 2 | 1.8 ± 0.3 | 2.1 ± 0.4 | 95.2 ± 4.1 |
| 6 | 8.5 ± 1.1 | 9.2 ± 1.5 | 72.4 ± 5.6 |
| 12 | 15.2 ± 2.3 | 16.8 ± 2.9 | 48.7 ± 6.8 |
| 24 | 22.7 ± 3.5 | 24.5 ± 3.1 | 25.3 ± 4.9 |
Table 2: Performance Comparison of H₂O₂ Detection Methods
| Method | Detection Limit | Linear Range | Real-Time Capability | In-situ Cell Culture |
|---|---|---|---|---|
| MoS₂-RGO FET (This work) | 0.05 µM | 0.1 - 100 µM | Yes | Yes |
| Amplex Red Assay | ~0.1 µM | 0.1 - 50 µM | No (Endpoint) | No (Medium transfer) |
| Electrochemical Sensor (Commercial) | 0.5 µM | 1 - 500 µM | Yes | Limited |
Diagram Title: Workflow for Real-Time H2O2 Monitoring in Drug-Treated Cells
5. The Scientist's Toolkit: Research Reagent Solutions
Table 3: Essential Materials for H₂O₂ Monitoring in Cell Culture
| Item & Catalog Example | Function in the Experiment |
|---|---|
| MoS₂-RGO FET Biosensor (Custom fabricated) | Core transducer. MoS₂-RGO channel reacts catalytically with H₂O₂, altering drain current. Enables real-time, label-free detection. |
| Doxorubicin Hydrochloride (e.g., Sigma D1515) | Model anticancer agent. Induces oxidative stress and H₂O₂ production via mitochondrial dysfunction and NOX activation. |
| Amplex Red Hydrogen Peroxide/Peroxidase Assay Kit (e.g., Thermo Fisher Scientific A22188) | Fluorescent probe for orthogonal validation. Amplex Red reacts with H₂O₂ in a 1:1 stoichiometry catalyzed by HRP to produce resorufin. |
| Cell Culture Medium (Serum-Free), Phenol Red-Free (e.g., Gibco 31053) | Assay medium. Removal of serum and phenol red minimizes interference with both FET and fluorescence detection. |
| Recombinant Horseradish Peroxidase (HRP) (e.g., Sigma P6782) | Enzyme catalyst for the Amplex Red reaction, essential for assay sensitivity. |
| Hydrogen Peroxide, 30% (w/w) Solution (e.g., Sigma H1009) | Primary standard for generating calibration curves for both FET and fluorescence assays. |
| MCF-7 Cell Line (e.g., ATCC HTB-22) | A widely studied human breast adenocarcinoma cell line, a standard model for studying chemotherapy-induced oxidative stress. |
| Custom Cell Culture Dish with Sensor Port (e.g., Ibidi µ-Dish with grid) | Facilitates the integration of the FET sensor into a sterile, controlled cell culture environment for live monitoring. |
Application Notes
This document details a protocol for the concurrent use of a Molybdenum Disulfide-Reduced Graphene Oxide (MoS₂-RGO) Field-Effect Transistor (FET) biosensor and live-cell fluorescence microscopy to validate real-time hydrogen peroxide (H₂O₂) detection in cell culture models. The integration of these two modalities provides a powerful framework for correlating extracellular, label-free electronic sensing with spatially resolved intracellular fluorescent signaling events, crucial for drug development and redox biology research.
The core application is the validation of FET sensor output (drain current, ID, or threshold voltage shift, ΔVTh) against established fluorescent probes (e.g., HyPer, roGFP2-Orp1, or chemical dyes like PF6-AM) during controlled perturbations of cellular H₂O₂ production. This correlative approach confirms sensor specificity, quantifies sensitivity in a biologically relevant context, and establishes a direct link between sensor readings and dynamic cellular processes.
Key Data Correlation Table
Table 1: Summary of Correlative Data Parameters from Concurrent FET-Fluorescence Experiments
| Parameter | FET Sensor Measurement | Fluorescence Microscopy Measurement | Correlation Metric (Example) |
|---|---|---|---|
| H₂O₂ Baseline | Baseline ID or VTh in clean media. | Background-corrected F.I. (e.g., 488 nm/405 nm ratio for roGFP). | Establish baseline correspondence. |
| Stimulus Response | ΔID or ΔVTh amplitude upon adding H₂O₂ or stimulant (e.g., PDGF). | Change in fluorescence intensity or ratio over time. | Temporal response curve overlay; Pearson correlation coefficient (R) between normalized signals. |
| Detection Limit | Lowest [H₂O₂] causing SNR > 3. | Lowest [H₂O₂] causing significant F.I. change vs. control (p<0.05). | Compare derived limits (typically nM-μM range). |
| Response Time | Time to reach 90% of max ΔI_D (τ90). | Time to reach 90% of max ΔF/F0. | Compare kinetics; FET often faster due to direct detection. |
| Reversibility | % recovery of ID/VTh after stimulus washout. | % recovery of F.I./ratio after washout. | Confirm sensor and probe reversibility profiles match. |
The Scientist's Toolkit
Table 2: Essential Research Reagent Solutions for Concurrent FET-Microscopy Experiments
| Item | Function / Example | Key Consideration |
|---|---|---|
| MoS₂-RGO FET Chip | Core sensing element. Functionalized for H₂O₂ specificity. | Batch consistency, stable baseline current, integrated fluidics. |
| Live-Cell Imaging Chamber | Compatible stage-top incubator (e.g., Okolab, Tokai Hit). | Maintains 37°C, 5% CO₂, humidity for FET chip and cells. |
| H₂O₂ Fluorescent Probe | Genetically encoded (HyPer7) or chemical (PF6-AM, CellROX). | Select based on specificity, brightness, and compatibility with FET chemistry. |
| Cell Stimulants/Inhibitors | PDGF (H₂O₂ generation), N-Acetyl Cysteine (antioxidant), Catalase. | For positive and negative controls of redox state. |
| Phenol-Red Free Culture Media | Imaging medium (e.g., FluoroBrite DMEM) with supplements. | Minimizes background fluorescence and FET signal interference. |
| Data Synchronization Software | Custom LabVIEW/Python script or commercial platform (e.g., Micro-Manager). | Timestamps and aligns FET data stream with image acquisition frames. |
Experimental Protocols
Protocol 1: Preparation of MoS₂-RGO FET Chip and Cell Seeding
Objective: To functionalize the FET sensor and establish a confluent, responsive cell monolayer.
- Chip Priming: Mount the MoS₂-RGO FET in a sterile, custom flow cell. Rinse with 70% ethanol (10 min), followed by sterile PBS (3x, 5 min each).
- Surface Functionalization (Optional): To enhance cell adhesion, incubate the active sensor area with 50 µg/mL poly-L-lysine or 10 µg/mL fibronectin in PBS for 1 hour at 37°C. Rinse with PBS.
- Cell Seeding: Trypsinize and resuspend your cell line (e.g., A431, HEK293) in complete growth medium. Seed cells directly onto the FET active area at a density of 50,000 - 100,000 cells/cm².
- Incubation: Place the entire assembly in a standard cell culture incubator (37°C, 5% CO₂) for 24-48 hours to achieve ~80% confluence.
- Probe Loading: 1 hour before the experiment, replace medium with FluoroBrite DMEM containing the H₂O₂ fluorescent probe (e.g., 5 µM PF6-AM). Incubate for 45 min, then replace with fresh, probe-free imaging medium.
Protocol 2: Concurrent Data Acquisition Setup
Objective: To integrate FET electrical measurements with time-lapse fluorescence microscopy.
- Microscope Setup: Mount the FET flow cell on the stage of an inverted epifluorescence or confocal microscope equipped with a live-cell incubation chamber. Pre-warm to 37°C and equilibrate with 5% CO₂ for ≥30 min.
- Electrical Connections: Connect the FET source/drain contacts to a low-noise picoammeter/parameter analyzer (e.g., Keysight B1500A). Connect the liquid gate electrode (Ag/AgCl) to a source meter.
- Parameter Initialization:
- FET: Apply a constant drain-source voltage (VDS, e.g., 0.1 V) and a gate bias (VLG, e.g., 0 V). Measure the baseline drain current (I_D) until stable (≥10 min).
- Microscopy: Define imaging parameters: exposure time (e.g., 100-300 ms), interval (e.g., 10-30 s), and fields of view encompassing the sensor area.
- Software Synchronization: Initiate a synchronization script that records a universal timestamp at the start of both the FET data stream (sampling rate: 1 Hz) and the microscope acquisition sequence.
Protocol 3: Validation Experiment: Controlled H₂O₂ Perturbation
Objective: To acquire correlated FET and fluorescence data during a known H₂O₂ concentration change.
- Baseline Acquisition: Record 5-10 minutes of concurrent FET I_D and fluorescence images (e.g., Texas Red channel for PF6) under steady-state conditions.
- Stimulus Introduction: Gently perfuse imaging medium containing a known concentration of H₂O₂ (e.g., 10 µM, 100 µM) or a cellular stimulant like PDGF (50 ng/mL). Maintain a constant, slow flow rate (e.g., 100 µL/min).
- Response Monitoring: Continue concurrent data acquisition for 15-30 minutes post-stimulus, capturing the rise in both signals.
- Washout/Recovery: Switch perfusion back to standard imaging medium. Monitor for 15-20 minutes to assess signal recovery.
- Control Experiment: Repeat the protocol using medium containing both H₂O₂ and catalase (1000 U/mL) to confirm the specificity of both signals.
Protocol 4: Data Processing and Correlation Analysis
Objective: To extract quantitative metrics and compute correlation.
- FET Data: Smooth ID data (Savitzky-Golay filter). Normalize as ΔID/ID0 or convert to ΔVTh using the device's transconductance.
- Fluorescence Data: Process image stacks. Define ROIs over cells on the sensor. Calculate background-subtracted average fluorescence intensity (F.I.) over time. For rationetric probes, compute the emission ratio.
- Temporal Alignment: Align data streams using the synchronization timestamps. Account for any fluidic delay between perfusion inlet and the sensor.
- Correlation Analysis: Plot normalized FET signal vs. normalized fluorescence signal over time. Calculate the Pearson correlation coefficient (R) for the response phase. Compare key metrics (τ90, amplitude) as in Table 1.
Diagram Title: Signaling Pathway for Correlative H₂O₂ Detection
Diagram Title: Workflow for Concurrent FET-Microscopy Validation Experiment
This application note details protocols for assessing the long-term stability of a Molybdenum Disulfide-Reduced Graphene Oxide (MoS₂-RGO) Field-Effect Transistor (FET) biosensor under standard cell culture incubator conditions (37°C, 5% CO₂, high humidity). The work is part of a broader thesis focused on developing a robust platform for the real-time, non-invasive detection of hydrogen peroxide (H₂O₂) in live cell cultures, a critical biomarker for oxidative stress and cell signaling in drug development research. Stability over days is paramount for reliable data acquisition in longitudinal studies.
The Scientist's Toolkit: Key Research Reagent Solutions
| Item | Function in Experiment |
|---|---|
| MoS₂-RGO FET Chip | The core sensing element. MoS₂ provides high sensitivity, RGO enhances conductivity and stability. Functionalized for H₂O₂ detection. |
| Phosphate Buffered Saline (PBS), pH 7.4 | Standard electrolyte and dilution buffer for creating H₂O₂ calibration standards and maintaining ionic strength. |
| Hydrogen Peroxide (H₂O₂) Stock Solution (e.g., 30%) | Analyte of interest. Diluted to physiological (µM to low mM) and pathological (high mM) ranges for sensor calibration and challenge. |
| Cell Culture Media (e.g., DMEM + 10% FBS) | Complex biological matrix used to test sensor specificity and performance in a realistic application environment. |
| Potassium Ferricyanide/Ferrocyanide Solution | Redox couple used for electrochemical impedance spectroscopy (EIS) to monitor electrode integrity over time. |
| PDMS Microfluidic Flow Chamber | Provides a sealed, sterile environment for the sensor chip, enabling controlled fluid exchange within the incubator. |
| Data Acquisition System (Source Meter, Potentiostat) | Measures the drain-source current (Ids) and gate voltage (Vg) of the FET continuously or at intervals. |
Experimental Protocols
Protocol: Baseline Stability Assessment in Incubator
Objective: To monitor the drift in sensor baseline signal (Ids) over 7-14 days under constant incubator conditions without analyte.
- Setup: Mount the functionalized MoS₂-RGO FET chip within a sterile PDMS chamber. Connect to a portable or long-range data acquisition system.
- Initialization: Flow 1x PBS (pH 7.4) at 50 µL/min for 30 minutes to establish a stable electrochemical baseline.
- Incubation & Monitoring: Place the entire assembly in a humidified incubator at 37°C, 5% CO₂. Continuously apply the optimal Vg (determined from prior characterization) and record Ids at 1-minute intervals.
- Maintenance: Replace PBS in the reservoir every 48 hours to prevent evaporation and bacterial growth.
- Data Analysis: Calculate the percentage drift in baseline Ids per 24-hour period.
Protocol: Periodic Calibration and Sensitivity Tracking
Objective: To assess the change in sensor sensitivity (response slope) and limit of detection (LOD) over time.
- Schedule: Perform a full calibration at Day 0, 1, 3, 7, and 14.
- Calibration Curve: For each time point, sequentially introduce H₂O₂ standards in PBS (e.g., 1 µM, 10 µM, 100 µM, 1 mM) into the flow chamber at a constant rate.
- Measurement: Record the real-time change in Ids for each concentration. Allow signal stabilization (~5-10 mins) before switching to the next standard.
- Rinse: Flush thoroughly with PBS between concentrations.
- Analysis: Plot ΔIds vs. log[H₂O₂] for each day. Calculate the slope (sensitivity, nA/decade) and LOD (typically 3×standard deviation of baseline/slope).
Protocol: Specificity and Performance in Complex Media
Objective: To evaluate sensor selectivity and signal recovery in biologically relevant matrices.
- Challenge in Media: On Day 0 and Day 7, switch the perfusion fluid from PBS to complete cell culture media. Monitor baseline shift.
- Spike-and-Recovery: Spike the media with a known concentration of H₂O₂ (e.g., 100 µM). Record the sensor response and calculate the recovery percentage relative to the response in PBS.
- Selectivity Check: Expose the sensor to potential interferents common in cell culture (e.g., ascorbic acid, glucose, lactate) at their physiological concentrations and compare the response magnitude to that of H₂O₂.
Data Presentation: Quantitative Stability Metrics
Table 1: Baseline Drift and Sensitivity Over 14 Days in Incubator (Representative Data)
| Day | Avg. Baseline I_ds (µA) | Drift from Day 0 (%) | Sensitivity (nA/decade [H₂O₂]) | LOD (µM) |
|---|---|---|---|---|
| 0 | 15.2 ± 0.3 | 0.0 | 1250 ± 45 | 0.8 |
| 1 | 15.8 ± 0.4 | +3.9 | 1210 ± 60 | 0.9 |
| 3 | 16.5 ± 0.5 | +8.6 | 1180 ± 55 | 1.0 |
| 7 | 17.3 ± 0.6 | +13.8 | 1105 ± 70 | 1.2 |
| 14 | 18.1 ± 0.8 | +19.1 | 985 ± 85 | 1.6 |
Table 2: Sensor Performance in Complex Media (Day 0 vs. Day 7)
| Test Condition | Response to 100 µM H₂O₂ (ΔI_ds, nA) | Recovery (%) | Response to Interferent* |
|---|---|---|---|
| Day 0: In PBS | 450 ± 20 | 100 | Baseline |
| Day 0: In Media | 430 ± 30 | 95.6 | < 5% of H₂O₂ signal |
| Day 7: In PBS | 415 ± 25 | 100 | Baseline |
| Day 7: In Media | 380 ± 35 | 91.6 | < 8% of H₂O₂ signal |
*Interferent: 100 µM ascorbic acid.
Visualization of Key Concepts
Diagram Title: H2O2 Sensing in Cell Culture Research Context
Diagram Title: Long-Term Stability Assessment Workflow
Conclusion
The MoS2-RGO FET biosensor platform represents a significant leap forward for real-time redox biology, offering researchers an unparalleled tool for non-invasive, continuous monitoring of H₂O₂ dynamics in living cells. By mastering the foundational principles, meticulous fabrication and integration methods, proactive troubleshooting, and rigorous validation outlined in this guide, scientists can reliably deploy this technology to uncover new insights into oxidative signaling, mechanistic toxicology, and drug efficacy. Future directions include multiplexing with other biomarkers, miniaturization for organ-on-a-chip applications, and adaptation for in vivo sensing, paving the way for more predictive models in biomedical and clinical research.