Non-Invasive Redox Assessment with NIRS: Principles, Protocols, and Cutting-Edge Applications in Research & Drug Development
This article provides a comprehensive guide to Near-Infrared Spectroscopy (NIRS) for assessing tissue redox state, a critical biomarker in physiology, disease pathology, and therapeutic efficacy.
Non-Invasive Redox Assessment with NIRS: Principles, Protocols, and Cutting-Edge Applications in Research & Drug Development
Abstract
This article provides a comprehensive guide to Near-Infrared Spectroscopy (NIRS) for assessing tissue redox state, a critical biomarker in physiology, disease pathology, and therapeutic efficacy. Aimed at researchers and drug development professionals, we detail the foundational principles linking NIRS signals to cytochrome c oxidase and hemoglobin oxygenation. We explore practical methodologies for in vivo monitoring in brain, muscle, and organ systems, address common technical and analytical challenges, and compare NIRS against established techniques like PET and fMRI. The review synthesizes current validation evidence and outlines future directions for transforming redox assessment into a robust, non-invasive clinical and research tool.
Decoding the Signal: The Science of NIRS and Cellular Redox State
Tissue redox state, defined by the dynamic equilibrium between pro-oxidant and antioxidant species, is a fundamental regulator of cellular signaling, metabolism, and homeostasis. Its dysregulation is a central mechanism in the pathogenesis of a wide spectrum of diseases, from metabolic syndrome and neurodegeneration to cancer. This whitepaper establishes tissue redox status as a critical, integrative biomarker and frames its assessment within the innovative context of non-invasive Near-Infrared Spectroscopy (NIRS). NIRS offers a translational bridge from mechanistic understanding to clinical application, enabling real-time, in vivo monitoring of redox biomarkers like cytochrome c oxidase and hemoglobin oxygenation.
The Redox Code: Core Principles and Signaling Pathways
Cellular redox balance is governed by coupled redox pairs, primarily the reduced/oxidized states of nicotinamide adenine dinucleotide (NADH/NAD⁺), glutathione (GSH/GSSG), and thioredoxin (Trx(SH)₂/TrxSS). These systems regulate critical signaling pathways.
Diagram Title: Major Cellular Redox Signaling Nodes & Pathways
Quantitative Data: Redox Imbalance in Disease States
Table 1: Key Redox Biomarker Alterations in Human Diseases and Models
| Disease Category | Specific Model/Condition | Key Redox Alteration (Measured) | Reported Change vs. Control | Primary Measurement Technique |
|---|---|---|---|---|
| Neurodegenerative | Alzheimer's Disease (Post-mortem brain) | GSH/GSSG Ratio (Cortex) | ↓ ~40-60% | HPLC, Spectrophotometry |
| Metabolic | NAFLD/NASH (Human liver biopsy) | Protein Carbonyls (Oxidative damage) | ↑ 2.5 to 3-fold | Immunoblot/DNPH assay |
| Cardiovascular | Heart Failure (Animal model) | Cysteine (Cys/CySS) Redox Potential (Plasma) | More oxidized by +20 to +30 mV | HPLC with electrochemical detection |
| Cancer | Breast Cancer Cell Line (MCF-7) | NADPH/NADP⁺ Ratio | ↑ ~50-80% | Enzymatic cycling assay |
| Aging | Skeletal Muscle (Aged vs. Young Rodent) | Mitochondrial H₂O₂ Emission Rate | ↑ ~2-fold | Fluorescent probes (Amplex Red) |
Experimental Protocols for Key Redox Assessments
Protocol: Spectrophotometric Assessment of Tissue GSH/GSSG Ratio
Principle: Glutathione is quantified by reacting with 5,5'-dithio-bis-(2-nitrobenzoic acid) (DTNB) to yield a yellow-colored 5-thio-2-nitrobenzoic acid (TNB), measurable at 412 nm. GSSG is measured after derivatization of GSH with 2-vinylpyridine.
- Tissue Homogenization: Snap-freeze tissue in liquid N₂. Homogenize 10-50 mg tissue in 500 µL ice-cold 5% (w/v) metaphosphoric acid (MPA) containing 0.1 M HCl.
- Protein Precipitation: Centrifuge at 13,000 x g for 10 min at 4°C. Collect acid-soluble supernatant.
- Total Glutathione (GSH+GSSG) Assay:
- Prepare reaction mix: 0.1 M sodium phosphate buffer (pH 7.4), 1 mM EDTA, 0.3 mM DTNB, 0.4 U/mL glutathione reductase (GR), 0.2 mM NADPH.
- Add 50 µL sample or GSH standard to 150 µL reaction mix in a 96-well plate.
- Monitor absorbance at 412 nm for 3 minutes. The rate of TNB formation is proportional to total glutathione.
- Oxidized Glutathione (GSSG) Assay:
- Treat a separate 100 µL aliquot of supernatant with 2 µL of 2-vinylpyridine and 6 µL triethanolamine for 1 hour at room temperature to derivative GSH.
- Perform assay as in step 3.
- Calculation: Determine concentrations from GSH standard curves. Reduced GSH = Total - (2 x GSSG). Calculate ratio.
Protocol: Non-Invasive NIRS for Cytochrome c Oxidase Redox State (CCO)
Principle: NIRS uses light (650-1000 nm) to measure concentration changes in chromophores based on the modified Beer-Lambert law. CCO has a distinct redox-sensitive absorption band in the near-infrared (~830-850 nm).
- Instrumentation Setup: A continuous-wave or frequency-domain NIRS system with laser diodes or LEDs emitting at a minimum of two wavelengths (e.g., 780 nm, 830 nm, 850 nm) and matched photodetectors.
- Probe Placement: Affix source and detector optodes over the tissue of interest (e.g., skeletal muscle, brain cortex) at a fixed distance (typically 3-4 cm for deep tissue penetration).
- Data Acquisition:
- Record baseline optical density (OD) for several minutes under resting/steady-state conditions.
- Initiate intervention (e.g., arterial occlusion, cognitive task, exercise).
- Continuously record OD changes (ΔOD) at all wavelengths throughout the intervention and recovery.
- Signal Processing & Analysis:
- Apply a differential pathlength factor (DPF) to convert ΔOD to concentration change (ΔμM).
- Use a multi-variate linear regression or principal component analysis to resolve the contribution of oxy/deoxy-hemoglobin and CCO from the spectral data.
- The derived Δ[CCO] signal reflects the redox state change of the enzyme's copper A (CuA) center.
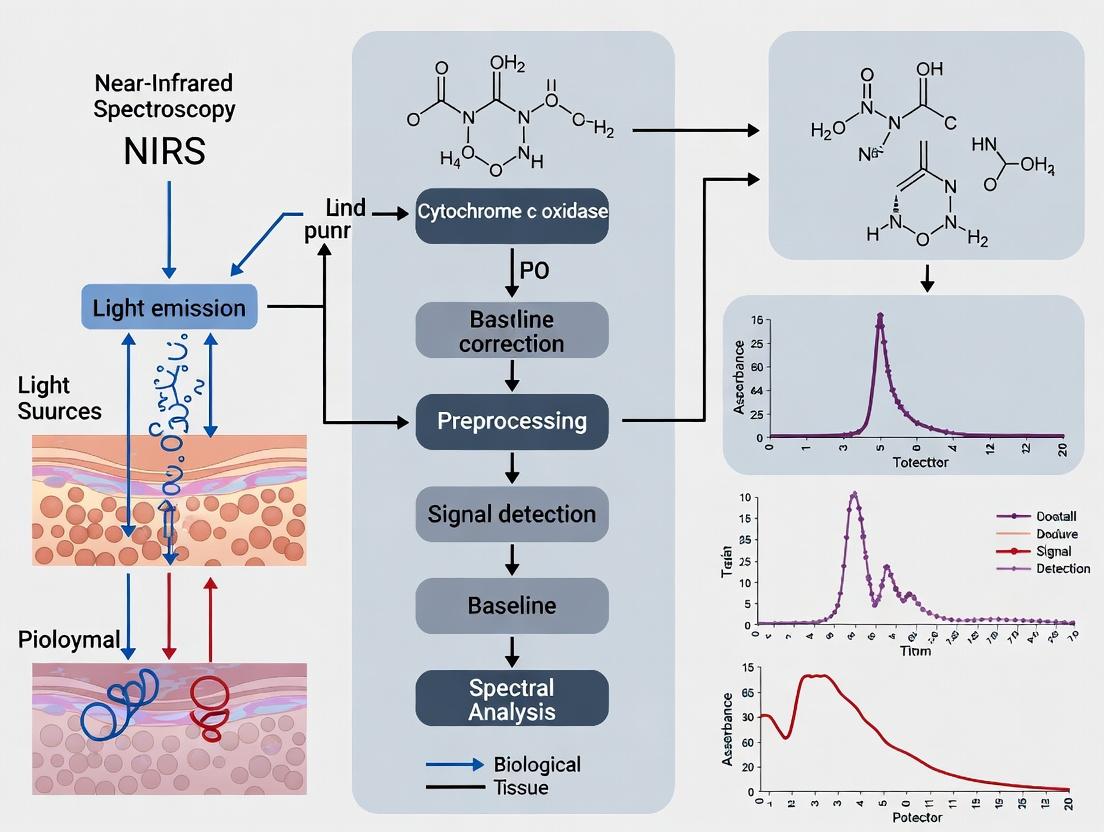
Diagram Title: NIRS Workflow for Redox Assessment
The Scientist's Toolkit: Key Research Reagent Solutions
Table 2: Essential Reagents and Materials for Tissue Redox Research
| Item/Category | Example Product/Kit | Primary Function in Redox Research |
|---|---|---|
| General Oxidative Stress Probes | CM-H₂DCFDA (Fluorescent), Amplex Red (Fluorometric) | Cell-permeable dyes that become fluorescent upon oxidation by ROS (e.g., H₂O₂, peroxynitrite). |
| Glutathione Status Assays | GSH/GSSG-Glo Assay (Luminescent), DTNB-based kits (Colorimetric) | Quantify total, reduced, and oxidized glutathione levels to calculate redox potential (Eₕ). |
| Lipid Peroxidation Assay | Thiobarbituric Acid Reactive Substances (TBARS) Assay, Lipid Hydroperoxide (LPO) Assay | Measures malondialdehyde (MDA) and other aldehydes as end-products of lipid peroxidation. |
| Protein Oxidation Assay | OxyBlot Protein Oxidation Detection Kit | Immunodetection of protein carbonyl groups formed by metal-catalyzed oxidation. |
| NAD(P)H Quantification | NAD/NADH-Glo & NADP/NADPH-Glo Assays | Luminescent determination of the absolute levels and ratios of these critical redox cofactors. |
| NIRS Systems | Continuous Wave (CW) NIRS (e.g., NIRO series), Frequency-Domain (FD) NIRS | Non-invasive devices for measuring tissue oxygenation and CCO redox state in real-time. |
| Antioxidant Enzyme Activity | Superoxide Dismutase (SOD) Activity Kit, Catalase Activity Assay | Measures the activity of key endogenous antioxidant defense enzymes. |
This technical guide examines the photobiological principles underlying Near-Infrared Spectroscopy (NIRS) as a non-invasive tool for assessing tissue redox state. The interaction of NIR light (700-1000 nm) with endogenous chromophores forms the basis for quantifying metabolic parameters, primarily cytochrome c oxidase (CCO) oxidation state and hemodynamic variables. This whitepaper, framed within a thesis on advancing redox assessment, details the core physics, key experimental protocols, and current applications in preclinical and clinical research.
Near-Infrared light penetrates biological tissue due to the relatively low absorption and scattering coefficients of tissue components in this spectral window. The primary chromophores absorbing light in this range are oxygenated hemoglobin (HbO₂), deoxygenated hemoglobin (HHb), water (H₂O), and lipids. Crucially, the oxidized form of cytochrome c oxidase (CCO), the terminal enzyme in the mitochondrial electron transport chain, exhibits a broad copper-centered absorption peak in the NIR, which diminishes upon reduction. This property enables NIRS to function as a non-invasive optical biopsy for cellular energy metabolism and redox state.
Core Chromophores: Spectral Properties and Quantification
Primary NIRS Chromophores
The quantitative absorption characteristics of key tissue chromophores define the NIRS measurement window. The following table summarizes the molar extinction coefficients (ε) at key wavelengths.
Table 1: Molar Extinction Coefficients (ε) of Major Tissue Chromophores in the NIR Window
| Chromophore | ε at 750 nm (mM⁻¹cm⁻¹) | ε at 800 nm (mM⁻¹cm⁻¹) | ε at 850 nm (mM⁻¹cm⁻¹) | ε at 900 nm (mM⁻¹cm⁻¹) | Key Role in NIRS |
|---|---|---|---|---|---|
| HHb | ~0.6 | ~0.4 | ~0.3 | ~0.2 | Deoxygenation marker |
| HbO₂ | ~0.2 | ~0.4 | ~0.6 | ~0.8 | Oxygenation marker |
| H₂O | ~0.03 | ~0.03 | ~0.04 | ~0.05 | Background absorber |
| Lipid | ~0.03 | ~0.02 | ~0.02 | ~0.02 | Background absorber |
| Oxidized CCO | ~0.3 (peak) | ~0.2 | ~0.15 | ~0.1 | Redox/energy state marker |
Note: Values are approximate and representative; specific values vary across literature sources. Water and lipid contributions become significant in tissues with high fat/water content.
Modified Beer-Lambert Law for Tissue
NIRS quantifies chromophore concentration changes using a modified Beer-Lambert Law (MBLL) to account for intense light scattering in tissue: ΔA = log(I₀/I) = ∑ (εᵢ Δcᵢ) B L + G Where ΔA is attenuation change, I₀/I is incident/transmitted light intensity, εᵢ is molar extinction coefficient, Δcᵢ is concentration change, B is the differential pathlength factor (DPF, typically 4-6 for tissue), L is source-detector separation, and G is scattering loss. Multi-wavelength measurements are required to solve for multiple chromophores.
Experimental Protocols for Redox Assessment
Protocol: In Vivo Cerebral Redox Monitoring in Rodent Models
Objective: To measure changes in CCO oxidation state, HbO₂, and HHb in the cerebral cortex during induced hypoxia/hypercapnia.
Materials:
- Frequency-domain or continuous-wave NIRS system with laser diodes at minimum 4 wavelengths (e.g., 730, 750, 810, 850 nm).
- Stereo-taxic frame for optode placement.
- Anesthesia system (e.g., isoflurane vaporizer).
- Gas mixer for delivering hypoxic/hypercapnic gas mixtures.
- Data acquisition software.
Procedure:
- Anesthetize and surgically prepare the rodent (e.g., rat), securing the head in a stereotaxic frame.
- Gently remove scalp and periosteum over the region of interest (e.g., frontal/parietal cortex).
- Affix NIRS source and detector optodes directly to the skull or via a custom-made holder. A typical source-detector separation is 3-5 mm for penetration to cortical layers.
- Acquire a 5-minute baseline measurement with animal breathing normal air (21% O₂).
- Induce a physiological challenge: Switch inspired gas to a hypoxic mixture (e.g., 10% O₂, 90% N₂) for 3 minutes while continuously recording NIRS data.
- Return to normal air for a 10-minute recovery period.
- Terminate experiment and euthanize animal per approved protocol.
- Data Analysis: Use the MBLL with a multi-wavelength algorithm to resolve concentration changes (Δ[HbO₂], Δ[HHb], Δ[oxCCO]) from attenuation changes at each wavelength. The redox state is inferred from the Δ[oxCCO] signal.
Protocol: Multi-Distance Spatially Resolved NIRS for Absolute Quantification
Objective: To obtain absolute concentrations of chromophores, minimizing the influence of superficial tissues (skin, skull).
Materials:
- Continuous-wave NIRS system with multiple detector channels at varying distances (e.g., 1.5, 2.0, 2.5, 3.0 cm from source).
- Probe holder designed for human forearm or head.
- Calibration phantom with known optical properties.
Procedure:
- Calibrate the NIRS system using tissue-simulating phantoms with known absorption (μₐ) and reduced scattering (μₛ') coefficients.
- Position the multi-distance probe on the skin surface of the target tissue (e.g., forearm muscle). Ensure good skin contact.
- Record data simultaneously from all detectors for a minimum of 2 minutes to establish baseline.
- Induce a physiological perturbation relevant to redox (e.g., forearm arterial occlusion via cuff inflation to 50 mmHg above systolic pressure for 3 minutes).
- Release the cuff and record the reperfusion response for 5 minutes.
- Data Analysis: Fit the slope of attenuation vs. source-detector distance (ρ) for each wavelength to a diffusion theory model. This yields absolute μₐ(λ). Perform spectral unmixing using the known ε(λ) of chromophores to solve for absolute concentrations [HbO₂], [HHb], and [oxCCO]. Tissue Oxygenation Index (TOI = [HbO₂]/[total Hb]) can be derived.
Signaling Pathways and Metabolic Coupling
The interaction of NIR light with CCO provides a window into mitochondrial redox and cellular energy metabolism. The following diagram illustrates the core signaling pathway linking NIRS measurement to metabolic interpretation.
Title: NIRS Signal Pathway from Photon to Redox State
The Scientist's Toolkit: Research Reagent Solutions
Table 2: Essential Materials for NIRS Redox Research
| Item | Function in NIRS Research | Example/Notes |
|---|---|---|
| Multi-Wavelength NIRS System | Emits and detects NIR light at specific wavelengths to resolve chromophores. | Frequency-domain (FD-NIRS) for absolute properties; Continuous-wave (CW-NIRS) for relative changes. |
| Tissue-Simulating Phantoms | Calibrates system and validates algorithms using materials with known μₐ and μₛ'. | Liquid phantoms with India ink (absorber) and Intralipid/Liposyn (scatterer). |
| Stereotaxic Apparatus & Optode Holders | Precisely positions light sources and detectors on small animal subjects. | Custom 3D-printed holders ensure reproducible geometry. |
| Gas Mixing System | Modulates inspired O₂/CO₂ to create controlled physiological challenges (hypoxia, hypercapnia). | Validates NIRS sensitivity to redox and hemodynamic changes. |
| Enzyme Inhibitors/Modulators (e.g., Cyanide, Nitric Oxide Donors) | Pharmacologically perturbs mitochondrial electron transport chain to validate CCO signal specificity. | Sodium cyanide (inhibits CCO) in ex vivo models. |
| Concurrent Validation Instrumentation (e.g., fMRI, Electrodes) | Provides complementary measures to confirm NIRS findings. | Simultaneous NIRS/fMRI; inserted PO₂ electrodes or optical fiber spectrometers. |
Workflow for a Typical NIRS Redox Study
The following diagram outlines the logical and procedural workflow for conducting a complete NIRS-based redox assessment experiment.
Title: NIRS Redox Study Experimental Workflow
The photobiology of NIRS provides a powerful, non-invasive means to assess tissue redox state through quantifiable interactions with endogenous chromophores, primarily CCO. Current research focuses on improving the specificity and accuracy of the CCO signal, developing advanced algorithms to separate scattering from absorption effects, and integrating NIRS with other modalities (e.g., EEG, fMRI) for a comprehensive view of metabolic health. Within the thesis context of non-invasive redox assessment, NIRS stands as a critical translational technology for monitoring mitochondrial dysfunction in drug development, neurological disorders, and critical care.
Within the framework of advancing non-invasive redox state assessment research using Near-Infrared Spectroscopy (NIRS), cytochrome c oxidase (CCO) emerges as the paramount molecular target. As the terminal complex (Complex IV) of the mitochondrial electron transport chain (ETC), CCO is the primary site of cellular oxygen utilization and a critical nexus of cellular redox signaling and energy metabolism. Its distinct redox-sensitive copper and heme centers, which undergo characteristic optical changes in the near-infrared spectrum (750-900 nm), provide a unique, quantifiable signature. This whitepaper provides an in-depth technical guide on CCO as the primary redox target, detailing its NIRS signature, associated experimental protocols, and its pivotal role in translational research for drug development.
Cytochrome c Oxidase: Structure, Function, and Redox Centers
CCO catalyzes the four-electron reduction of molecular oxygen to water, coupled with the translocation of protons across the inner mitochondrial membrane. Its mammalian structure comprises 13-14 subunits, with the redox-active metal centers located in the core, mitochondrially-encoded subunits:
- Cuₐ: A binuclear copper center (CuA, CuB) that accepts electrons from cytochrome c. Its redox state is detectable in the 830-850 nm range.
- Heme a: An intermediate electron carrier between Cuₐ and the heme a₃-CuB binuclear center.
- Heme a₃-CuB: The binuclear center where O₂ binds and is reduced. The redox state of heme a₃ contributes significantly to the 780-820 nm absorption band.
The oxidation and reduction of these metal centers alter their electron configuration, leading to changes in their absorption of specific NIR wavelengths. This forms the biochemical basis for non-invasive monitoring.
The NIRS Signature of CCO Redox State
NIRS detects changes in the concentration of chromophores based on the modified Beer-Lambert law. While hemoglobin (Hb) and myoglobin (Mb) are dominant signals, the unique spectral signature of CCO allows for separation using multi-wavelength algorithms.
Table 1: Characteristic NIRS Absorption Peaks of Key Mitochondrial Chromophores
| Chromophore | Redox Center | Primary Absorption Peak (nm) | Redox-State Sensitivity |
|---|---|---|---|
| Cytochrome c Oxidase | Cuₐ | ~830-850 | Oxidation increases absorption |
| Cytochrome c Oxidase | Heme a / a₃ | ~780-820 | Reduction increases absorption |
| Deoxygenated Hemoglobin (HHb) | Heme (Iron) | ~760 | Concentration-dependent |
| Oxygenated Hemoglobin (O₂Hb) | Heme (Iron) | ~850, 920 | Concentration-dependent |
Advanced broadband or frequency-domain NIRS systems utilize the full spectrum (e.g., 650-1000 nm) to apply spectroscopic decomposition algorithms (e.g., singular value decomposition, multivariate curve resolution) to isolate the CCO signal from the overwhelming hemoglobin background.
Experimental Protocols for CCO-NIRS Studies
Protocol 4.1: In Vivo Human Brain CCO Monitoring during Functional Activation
Objective: To measure task-induced changes in CCO redox state in the human prefrontal cortex. Materials: Continuous-wave broadband NIRS system (e.g., 128 wavelengths, 650-1000 nm); probe holder for prefrontal cortex; computer with acquisition software. Procedure:
- Position the NIRS optodes (source-detector separation: 3 cm) on the subject's forehead.
- Record a 5-minute baseline at rest.
- Initiate a cognitive task (e.g., n-back working memory task) for 3 minutes while continuing NIRS recording.
- Follow with a 5-minute recovery/rest period.
- Apply spectral decomposition to the intensity data to resolve concentration changes (Δ) in HHb, O₂Hb, and oxidized CCO (ΔoxCCO). Analysis: Time-lock ΔoxCCO to task onset. A positive ΔoxCCO indicates increased oxidation (increased metabolic rate), typically following the hemodynamic response.
Protocol 4.2: Isolated Mitochondria Titration for CCO Spectral Validation
Objective: To obtain the pure extinction coefficient spectra of reduced and oxidized CCO. Materials: Mitochondria isolated from rat liver/heart; spectrophotometer with NIR capability; substrates (succinate, glutamate), inhibitors (cyanide, azide), uncoupler (FCCP). Procedure:
- Suspend mitochondria in respiration buffer. Place in spectrophotometer cuvette.
- Record a baseline spectrum (500-1000 nm).
- Add substrates to fully reduce the ETC (anaerobic conditions). Record the "fully reduced" spectrum.
- Introduce a small amount of oxygen or an oxidant, then add excess sodium cyanide (NaN₃) to inhibit CCO and trap its intermediate oxidized state. Record the "oxidized" spectrum.
- Calculate the difference spectrum (reduced minus oxidized) to identify the CCO-specific NIR signature.
Diagram Title: Protocol for Isolating CCO NIR Spectra
CCO in Redox Signaling & Pathophysiology: Pathways and Drug Targeting
CCO is regulated by and contributes to cellular redox balance. Key pathways include:
- Nitric Oxide (NO) Inhibition: NO binds reversibly to heme a₃/CuB, competing with O₂, modulating mitochondrial respiration and signaling redox stress.
- Reactive Oxygen Species (ROS) Production: Under high proton motive force or low O₂, CCO can "leak" electrons, producing superoxide, a key redox signal.
- Hypoxia Signaling: The redox state of CCO influences the stabilization of HIF-1α, impacting transcriptional adaptation.
Table 2: Drug Development Targets Involving CCO Redox State
| Target Pathway | Example Compound | Mechanism Related to CCO | NIRS Monitoring Utility |
|---|---|---|---|
| Mitochondrial Dysfunction | R(+) Pramipexole | Putative mitochondrial stabilization | Track restoration of CCO oxidative capacity. |
| Ischemia-Reperfusion Injury | Methylene Blue | Alternative electron carrier, may bypass CCO inhibition. | Monitor recovery of CCO redox state post-reperfusion. |
| Neurodegeneration | N/A (Biomarker focus) | CCO deficit is an early biomarker in Alzheimer's & Parkinson's. | Non-invasive differential diagnosis and progression tracking. |
| Hypoxia-Inducible Factor (HIF) Stabilizers | Roxadustat | Mimics hypoxia; CCO redox state is an upstream sensor. | Assess tissue-level metabolic response to therapy. |
Diagram Title: CCO in Redox Signaling & Therapeutic Intervention
The Scientist's Toolkit: Key Research Reagent Solutions
Table 3: Essential Reagents and Materials for CCO-NIRS Research
| Item | Function/Application | Example/Note |
|---|---|---|
| Broadband NIRS System | Measures intensity across many wavelengths (650-1000 nm) to resolve CCO spectra. | Systems from companies like UCL, TechEn, or NIRx. |
| CCO-Specific Inhibitors | To pharmacologically manipulate CCO redox state in vitro/vivo. | Potassium Cyanide (KCN), Sodium Azide (NaN₃). EXTREME TOXICITY. |
| Mitochondrial Isolation Kit | Prepares functional mitochondria for in vitro spectral validation. | Kits from Abcam, Thermo Fisher, or Sigma. |
| Enzymatic CCO Activity Assay | Colorimetric verification of CCO function in tissue samples. | Assay kits based on cytochrome c oxidation (e.g., from Sigma-Aldrich). |
| Hypoxia Chamber | To modulate O₂ availability and study CCO reduction in cells/tissues. | Precision controlled atmosphere chambers (e.g., BioSpherix). |
| Spectral Unmixing Software | Algorithmic separation of Hb, Mb, and CCO signals from raw NIRS data. | Custom MATLAB/Python code using MCR-ALS, or commercial software (e.g, NIRS-SPM). |
| Cytochrome c (Reduced) | Substrate for validating CCO activity in isolated complex assays. | Purified from bovine heart. |
This technical guide is presented within the context of a broader thesis on advancing near-infrared spectroscopy (NIRS) for the non-invasive assessment of cellular redox state. A primary challenge in this field is the inherent confounding of signals arising from changes in oxyhemoglobin (HbO2) and deoxyhemoglobin (HHb)—hemodynamic changes—with those originating from the redox state of mitochondrial cytochromes c and aa3, particularly cytochrome c oxidase (CCO). Accurate deconvolution is critical for researchers and drug development professionals aiming to use NIRS as a reliable tool for monitoring metabolic health, oxidative stress, and therapeutic efficacy in vivo.
Core Principles of Signal Confounding
NIRS light in the 700-900 nm range is absorbed by several chromophores:
- HbO2 & HHb: The dominant absorbers, indicating blood volume and oxygenation.
- Oxidized CCO (CuA): Has a distinct absorption peak in the near-infrared range (~830 nm) when oxidized. Its reduced state is relatively transparent.
- Other Cytochromes: Cytochrome b and c contribute minimally but add complexity.
Changes in cerebral blood flow and oxygenation during neural or metabolic activation can produce large HbO2/HHb signals that obscure the smaller CCO redox signal. The measured optical density change (ΔOD) is a linear sum of contributions:
ΔOD(λ) = εHbO2(λ) • Δ[HbO2] • DPF + εHHb(λ) • Δ[HHb] • DPF + ε_CCO(λ) • Δ[oxCCO] • DPF + G
Where ε are wavelength-specific extinction coefficients, Δ[] are concentration changes, DPF is the differential pathlength factor, and G is a scattering term.
Methodological Approaches for Deconvolution
Multi-Wavelength Spectroscopic Algorithms
The primary method for separation is using multi-wavelength (≥3) measurements to solve the multivariate problem.
Experimental Protocol: Modified Beer-Lambert Law (mBLL) with UCLn Algorithm
- Instrumentation: Use a continuous-wave or frequency-domain NIRS system with a minimum of 3 laser diodes or LEDs (e.g., 730 nm, 810 nm, 850 nm, 880 nm). Source-detector separation is typically 3-4 cm for adult cerebral measurements.
- Data Acquisition: Collect continuous optical density data at all wavelengths concurrently during a baseline period and a physiological challenge (e.g., functional activation, vascular occlusion, drug infusion).
- Processing:
- Apply the mBLL:
ΔOD_λ = (ε_HbO2_λ • Δ[HbO2] + ε_HHb_λ • Δ[HHb] + ε_CCO_λ • Δ[oxCCO]) • DPF_λ • L + S_λ - Use the UCLn algorithm, which incorporates a priori knowledge of the extinction coefficients and accounts for the wavelength dependence of scattering (S_λ) by fitting it to a smooth function (e.g.,
a • λ^(-b)). - Solve the linear matrix equation via least-squares minimization to yield time-series estimates of Δ[HbO2], Δ[HHb], and Δ[oxCCO].
- Apply the mBLL:
Isobestic Point Utilization
The isobestic point of hemoglobin (~798-805 nm) is where εHbO2 = εHHb. Measurements at this wavelength are insensitive to changes in blood oxygenation, providing a signal dominated by blood volume and CCO changes.
Experimental Protocol: Two-Layer Model with Isobestic Reference
- Setup: Employ a system with a dedicated channel at the isobestic wavelength (e.g., 805 nm) alongside other wavelengths.
- Modeling: Implement a two-layer (scalp/skull and brain) analytical model. The superficial layer signal is estimated using short source-detector separations (~0.8 cm).
- Calculation: Subtract the superficial isobestic signal (scalp hemodynamics) from the deep isobestic signal (brain hemodynamics + CCO). Use this corrected isobestic signal in conjunction with other wavelengths to better isolate Δ[oxCCO].
Pharmacological and Physiological Challenges
Imposing controlled challenges can create differential responses in hemodynamic vs. redox signals.
Experimental Protocol: Respiratory Challenge (Hypercapnia)
- Procedure: Subject inhales a gas mixture containing 5% CO2 for 2-3 minutes, inducing cerebral vasodilation and a strong hemodynamic response with minimal change in cerebral metabolic rate of oxygen (CMRO2).
- Rationale: The large, uncoupled increase in HbO2 and total hemoglobin (tHb) with stable CMRO2 provides a "hemodynamic template." The concurrent CCO signal change during this challenge is presumed to be non-metabolic, allowing estimation of the hemodynamic cross-talk on the CCO measurement.
- Analysis: This template can be used in regression or filtering models to subtract the hemodynamic artifact from the CCO signal during subsequent tasks.
Experimental Protocol: Mitochondrial Inhibition
- Procedure (Animal/In Vitro Models): Apply a stepwise titration of a metabolic inhibitor (e.g., sodium cyanide, NaN3) to progressively inhibit CCO.
- Rationale: This induces a direct, graded redox change in CCO (reduction) independent of neural activity-driven hemodynamics.
- Analysis: The measured optical changes allow for direct calibration of the CCO extinction coefficient in situ and characterization of its spectral signature under controlled hemodynamic conditions.
Table 1: Extinction Coefficients of Key NIRS Chromophores (Typical Values)
| Chromophore | 730 nm (cm⁻¹•M⁻¹) | 805 nm (cm⁻¹•M⁻¹) | 850 nm (cm⁻¹•M⁻¹) | 880 nm (cm⁻¹•M⁻¹) |
|---|---|---|---|---|
| HbO2 | 0.85 | 0.87 | 1.19 | 1.40 |
| HHb | 1.70 | 0.87 | 0.78 | 0.68 |
| oxCCO | ~0.30 | ~0.40 | ~0.30 | ~0.20 |
Note: CCO coefficients are less certain and vary between preparations. Values are illustrative.
Table 2: Typical Signal Magnitudes During a Forehead Functional Activation Task
| Parameter | Baseline | Activation (Peak) | Δ Change |
|---|---|---|---|
| Δ[HbO2] | 0 µM | +2.5 to +3.5 µM | +2.5 to +3.5 µM |
| Δ[HHb] | 0 µM | -0.5 to -0.8 µM | -0.5 to -0.8 µM |
| Δ[tHb] | 0 µM | +2.0 to +2.7 µM | +2.0 to +2.7 µM |
| Δ[oxCCO] | 0 µM | +0.3 to +0.6 µM | +0.3 to +0.6 µM |
Note: Δ[oxCCO] signal is approximately 10-20% the amplitude of the Δ[HbO2] signal, highlighting the confound.
Visualizing Pathways and Workflows
Title: Signal Confounding and Deconvolution Pathway
Title: Core Experimental Workflow for Signal Separation
The Scientist's Toolkit
Table 3: Essential Research Reagent Solutions & Materials
| Item | Function & Rationale |
|---|---|
| Multi-Wavelength NIRS System (e.g., CW, FD-NIRS) | Provides the raw ΔOD data at multiple wavelengths. Frequency-domain systems additionally measure pathlength, improving quantitation. |
| Specialized Probes with multiple source-detector separations (e.g., 0.8 cm & 3.0 cm) | Enables spatial resolution and superficial signal regression (to remove scalp hemodynamic artifact). |
| Gas Mixing System (with CO₂, O₂, N₂ tanks & regulator) | For precise respiratory challenges (hypercapnia, hypoxia) to create controlled hemodynamic or metabolic states. |
| Validated Chromophore Extinction Coefficient Spectra | A priori knowledge of ε(λ) for HbO2, HHb, and oxCCO is the foundation of all spectroscopic unmixing algorithms. |
| Signal Processing Software (MATLAB, Python with SciPy) with custom algorithms (UCLn, ICA) | Required for implementing the complex linear algebra and regression models needed for deconvolution. |
| Co-registration Equipment (3D digitizer, MRI) | To accurately map NIRS channel locations to underlying cerebral anatomy, correlating signals with specific brain regions. |
| Calibration Phantoms with known optical properties | For system validation and performance testing under controlled, tissue-like conditions. |
The non-invasive assessment of cellular redox state is a pivotal goal in modern physiology and therapeutic development. This whitepaper frames the discussion of Oxidation State of Cytochrome c Oxidase (OxCCO) and systemic redox balance within the broader thesis that Near-Infrared Spectroscopy (NIRS) provides a critical, real-time window into in vivo mitochondrial function and metabolic health. For researchers and drug development professionals, quantifying these metrics offers a direct path to evaluating therapeutic efficacy, toxicity, and disease mechanisms related to oxidative stress and bioenergetic failure.
Core Concepts: OxCCO and Redox Balance
Oxidation State of Cytochrome c Oxidase (OxCCO): Cytochrome c oxidase (CCO), Complex IV of the mitochondrial electron transport chain (ETC), contains copper (CuA, CuB) and heme (a, a3) centers. Its oxidation state (OxCCO) reflects the proportion of these centers in an oxidized form. As the terminal electron acceptor, OxCCO is a sensitive, direct indicator of mitochondrial oxygen utilization and cellular metabolic rate.
Systemic Redox Balance: This is a broader metric representing the dynamic equilibrium between pro-oxidant species (e.g., ROS, RNS) and antioxidant defenses (e.g., GSH, SOD). It is often approximated by ratios like NAD+/NADH, GSH/GSSG, or thioredoxin redox state. Unlike the localized, direct metric of OxCCO, redox balance is a systemic parameter influencing and being influenced by numerous cellular pathways.
The NIRS Link: NIRS leverages the differential absorption of near-infrared light by chromophores. The unique absorbance spectra of the oxidized CuA center in CCO allows its concentration change to be monitored alongside hemoglobin oxygenation (HbO2, HHb). Thus, NIRS can simultaneously report on tissue oxygenation (delivery), hemoglobin dynamics (blood volume), and mitochondrial metabolism (OxCCO utilization).
Table 1: Key Redox Metrics and Their Significance
| Metric | Typical Measurement | Physiological Range/Value | Interpretation |
|---|---|---|---|
| OxCCO (Δ[oxCCO]) | NIRS (780-900 nm) | Reported as relative change (μM.cm). Resting baseline ~0. | ↑ OxCCO = ↑ mitochondrial respiration, ↓ electron flux. ↓ OxCCO = ↑ mitochondrial reduction, possible hypoxia/insufficient O2. |
| NAD+/NADH Ratio | Fluorescence, LC-MS | Cytosolic: ~700; Mitochondrial: ~7-8 (Cell type dependent) | Lower ratio indicates more reduced state, potential metabolic shift (e.g., glycolysis). |
| GSH/GSSG Ratio | Biochemical assay, HPLC | Healthy cells: >100:1; Stressed cells: <10:1 | Primary indicator of cellular antioxidant capacity. Lower ratio signifies oxidative stress. |
| Thioredoxin Redox | Redox Western blot | % oxidized typically <10% in healthy tissue. | Sensitive indicator of redox signaling and oxidative stress in specific compartments. |
Table 2: NIRS Characteristics for Redox Assessment
| Parameter | Chromophore | Primary NIRS Wavelength (nm) | What it Reflects |
|---|---|---|---|
| Tissue Oxygenation | HbO2, HHb | 730, 850 | Oxygen delivery and blood volume. |
| Mitochondrial Metabolism | Oxidized CuA in CCO | ~830-850 (isosbestic with Hb) | Oxidation state of CCO, direct metric of ETC activity. |
| Background Scattering/ Absorption | Water, lipids | 700-900+ | Used in algorithms to isolate signal. |
Experimental Protocols for Key Studies
Protocol 1: In Vivo NIRS Measurement of OxCCO and Hemodynamics in Rodent Brain
Objective: To concurrently monitor cerebral oxygenation, blood volume, and mitochondrial oxidation state during an induced hypoxic challenge.
- Animal Preparation: Anesthetize and surgically implant a chronic cranial window or use a stereotaxic holder for acute measurement.
- NIRS Setup: Position fiber-optic probes (source-detector separation 3-5 mm) on the skull. Use a frequency-domain or continuous-wave NIRS system with at least 3 wavelengths (e.g., 735, 810, 850 nm).
- Data Acquisition: Record a 5-minute stable baseline.
- Hypoxic Challenge: Introduce a gas mixture of 10% O2 / 90% N2 for 2 minutes, then return to normoxia (21% O2). Monitor throughout.
- Signal Processing: Apply Modified Beer-Lambert Law (MBLL) with differential pathlength factors to convert optical density changes to concentration changes (Δ[HHb], Δ[HbO2], Δ[oxCCO]).
- Analysis: Plot time-series data. Typically, hypoxia causes ↓Δ[oxCCO] (reduction of CCO) and ↓Δ[HbO2], with a subsequent overshoot in both upon reoxygenation.
Protocol 2: Validating NIRS OxCCO with ex vivo Biochemical Redox Assays
Objective: To correlate non-invasive NIRS OxCCO signals with direct biochemical measures of redox state in tissue.
- Parallel Experiment: Conduct an NIRS experiment as in Protocol 1 on an experimental cohort.
- Rapid Tissue Fixation: At a key time point (e.g., peak hypoxia), immediately freeze tissue in situ using clamps cooled in liquid N2.
- Tissue Homogenization: Pulverize frozen tissue in an inert atmosphere. Homogenize in acid (for NAD+/NADH) or with N-ethylmaleimide (for GSH/GSSG) to prevent artifact oxidation/reduction.
- Biochemical Assay:
- NAD+/NADH: Use enzymatic cycling assays (e.g., lactate dehydrogenase for NADH) or LC-MS.
- GSH/GSSG: Use commercially available colorimetric or fluorometric kits.
- Correlation Analysis: Statistically correlate the magnitude of Δ[oxCCO] change with the measured change in GSH/GSSG ratio or NAD+/NADH ratio.
Pathway and Workflow Visualizations
Title: Mitochondrial Electron Flow & OxCCO
Title: NIRS Redox Assessment Experimental Workflow
The Scientist's Toolkit: Research Reagent Solutions
Table 3: Essential Materials for Redox & NIRS Research
| Item/Category | Function/Description | Example/Note |
|---|---|---|
| Multi-Wavelength NIRS System | Device to measure changes in chromophore concentrations. Must include wavelengths sensitive to CuA oxidation (~830 nm). | Frequency-Domain (FD-NIRS) systems provide absolute quantification; Continuous-Wave (CW-NIRS) are more common. |
| CCO-specific Inhibitors/Uncouplers | Pharmacological tools to perturb ETC and validate OxCCO signal specificity. | Sodium Cyanide (inhibits CCO), Carbon Monoxide, FCCP (uncoupler). |
| Redox Quenching Reagents | To instantly fix in vivo redox states for ex vivo analysis. | Liquid N₂, acidic buffers (for NAD+), N-ethylmaleimide (for GSH). |
| GSH/GSSG Assay Kit | Quantifies the reduced/oxidized glutathione ratio, a key redox balance metric. | Colorimetric (DTNB-based) or fluorometric kits from suppliers like Cayman Chemical or Sigma-Aldrich. |
| NAD+/NADH Assay Kit | Measures the NAD+/NADH ratio, central to metabolic redox state. | Enzymatic cycling assays providing high sensitivity. |
| Tissue Oxygen Manipulation | To create controlled redox challenges for calibration/validation. | Gas mixing system (O₂, N₂, CO₂) for hypoxia/hyperoxia studies. |
| Pathlength Correction Phantom | For calibrating/scaling NIRS signals, especially in CW-NIRS. | Solid phantoms with known optical properties or using time-resolved methods. |
From Bench to Bedside: Practical NIRS Protocols and Research Applications
This whitepaper provides a technical comparison of three primary near-infrared spectroscopy (NIRS) modalities, framed within the context of non-invasive redox state assessment research. The ability to quantify tissue oxygenation (StO₂) and oxidation-reduction states of cytochromes, particularly cytochrome c oxidase (CCO), is critical for understanding metabolic health in drug development and disease research. Each NIRS system type offers distinct trade-offs in depth sensitivity, quantification accuracy, cost, and complexity.
Near-infrared spectroscopy (NIRS) leverages the optical window (650-1000 nm) where biological tissues are relatively transparent. It enables the non-invasive monitoring of chromophores critical to cellular redox state: oxygenated and deoxygenated hemoglobin (HbO₂, HHb) and the redox-sensitive copper moiety (CuA) within cytochrome c oxidase (CCO). The choice of instrumentation fundamentally dictates the fidelity of derived metabolic parameters.
Core Principles & Instrumentation Comparison
Continuous-Wave NIRS (CW-NIRS)
Principle: Measures the attenuation of light at constant intensity. Assumes changes in attenuation are linearly related to changes in chromophore concentration, requiring the modified Beer-Lambert law. Provides relative, not absolute, concentration changes.
Key Components: Light-emitting diodes (LEDs) or laser diodes, photodiodes or avalanche photodiodes (APDs), time-multiplexing circuitry.
Frequency-Domain NIRS (FD-NIRS)
Principle: Modulates light intensity at radio frequencies (typically 100-1000 MHz). Measures the phase shift (φ) and amplitude demodulation (AC) of the detected light relative to the source. This allows separation of absorption (µa) and reduced scattering (µs') coefficients, enabling absolute quantification.
Key Components: Radio-frequency modulated laser diodes, photomultiplier tubes (PMTs) or gain-modulated APDs, IQ demodulators for phase/amplitude extraction.
Time-Resolved NIRS (TR-NIRS)
Principle: Emits ultrashort picosecond light pulses and measures the temporal distribution of time-of-flight (DTOF). The temporal point spread function (TPSF) encodes comprehensive information about tissue absorption and scattering. Provides the highest depth sensitivity and absolute quantification.
Key Components: Pulsed laser sources (e.g., Ti:Sapphire, supercontinuum), time-correlated single-photon counting (TCSPC) modules, fast-timing PMTs or single-photon avalanche diodes (SPADs).
Table 1: Quantitative Comparison of NIRS System Specifications
| Parameter | CW-NIRS | FD-NIRS | TR-NIRS |
|---|---|---|---|
| Measured Quantities | Light Attenuation (ΔOD) | AC Amplitude, Phase Shift (φ) | Temporal Point Spread Function (TPSF) |
| Absolute µa & µs' | No | Yes | Yes |
| Typical Depth Sensitivity | ~1-2 cm (limited) | ~2-3 cm | >3 cm (superior) |
| Temporal Resolution | Very High (ms) | High (ms-100ms) | Moderate (0.1-1 s) |
| Immunity to Scalp/Skull | Low | Moderate | High |
| Typical Cost | Low ($10k-$50k) | Moderate ($50k-$150k) | High ($150k-$500k+) |
| Primary Advantage | Simplicity, Speed, Low Cost | Absolute Quantification, Good Balance | Gold-Standard Quantification & Depth Resolution |
| Primary Limitation | Relative Measures, Superficial Sensitivity | Complexity/Cost vs. TR-NIRS | Cost, Complexity, Data Processing Burden |
Table 2: Performance in Redox-State Assessment
| Assessment Metric | CW-NIRS | FD-NIRS | TR-NIRS |
|---|---|---|---|
| HbO₂/HHb Accuracy | Δ[Hb] only, prone to cross-talk | Good absolute [Hb] | Excellent absolute [Hb] |
| CCO Redox Sensitivity | Low (high cross-talk from Hb) | Moderate (improved separation) | High (best spectral/separation) |
| Depth Localization | Poor (assumes homogeneous model) | Fair (based on photon mean path) | Good (time-gating allows layer separation) |
| Signal-to-Noise Ratio (Typical) | High | Moderate | Lower (photon-starved) |
Detailed Experimental Protocols for Redox Assessment
Protocol 1: Baseline Resting-State CCO Monitoring
Objective: To establish a stable baseline for the redox state of CCO in target tissue.
- Subject Preparation: Position subject comfortably. Shave hair if necessary. Clean skin surface. Affix NIRS optodes (source-detector pairs) to scalp/muscle per 10-20 system or anatomical landmarks.
- System Calibration: For FD/TR systems, perform calibration using phantom with known µa and µs'. For CW systems, record baseline optical density for 5 minutes.
- Data Acquisition: Record in a dark, quiet room for 10 minutes. Instruct subject to relax, breathe normally, and avoid movement.
- Data Processing: Filter for motion artifacts (e.g., moving standard deviation rejection). For TR-NIRS, fit TPSF to diffusion model to extract µa(λ). For all systems, use multi-wavelength (e.g., 730, 810, 850 nm) measurements to solve for [HbO₂], [HHb], and [oxCCO] via UCLn algorithm or similar spectral fitting.
- Output: Time series of Δ[oxCCO] relative to initial time point (CW) or absolute [oxCCO] (FD/TR).
Protocol 2: Dynamic Challenge Test (e.g., Vascular Occlusion)
Objective: To probe metabolic flexibility and redox capacity via a hypoxia/reperfusion challenge.
- Setup: As in Protocol 1, with addition of a pneumatic cuff proximal to the measurement site (e.g., upper arm for forearm muscle).
- Baseline: Acquire 2 minutes of resting data.
- Occlusion: Rapidly inflate cuff to 50 mmHg above systolic pressure. Maintain for 3-5 minutes (arterial occlusion) while continuously recording NIRS data.
- Reperfusion: Rapidly deflate cuff and record for 5 minutes of recovery.
- Analysis: Plot kinetics of [HHb] (oxygen delivery block), [HbO₂] (oxygen consumption), and [oxCCO] (redox state). Key metrics: rate of oxCCO decline during occlusion (redox vulnerability) and rate of recovery post-occlusion (reductive capacity).
Protocol 3: Pharmacological Intervention Monitoring
Objective: To assess the impact of a drug candidate on tissue oxygenation and mitochondrial redox state.
- Design: Randomized, placebo-controlled, double-blind crossover.
- Procedure: Perform Protocol 1 (baseline). Administer drug/placebo intravenously or orally.
- Acquisition: Conduct continuous NIRS monitoring for 60-120 minutes post-administration. Incorporate periodic challenge tests (Protocol 2) at predetermined timepoints to assess dynamic response.
- Endpoint Analysis: Compare absolute/relative changes in [oxCCO], StO₂, and total hemoglobin concentration ([tHb]) between drug and placebo arms. Statistical analysis via repeated-measures ANOVA.
Visualization of Key Concepts
CW-NIRS Workflow & Limitation
FD-NIRS Principle of Absolute Measurement
NIRS Signals in Metabolic Redox Coupling
NIRS System Selection Logic for Redox Research
The Scientist's Toolkit: Research Reagent & Material Solutions
Table 3: Essential Materials for NIRS Redox Research
| Item | Function & Specification | Example/Supplier |
|---|---|---|
| Multi-Wavelength NIRS System | Core instrument. Minimum 3 wavelengths (730, 810, 850 nm) for CCO separation. 4+ wavelengths preferred. | CW: Artinis Oxymon. FD: ISS Imagent. TR: Hamamatsu NIRO or Time-Domain Tech. |
| Calibration Phantom | For FD/TR system calibration. Solid or liquid with precisely known absorption (µa) and reduced scattering (µs') coefficients across 650-900 nm. | Biomimic phantoms (INO, Gammex) or Intralipid-based liquid phantoms. |
| High-Density Optode Grid | Enables spatial mapping and improves depth sensitivity via multiple source-detector distances. | Customizable flexible caps with fixed optode spacing (e.g., 1.5-3.0 cm). |
| Co-registration System | Anatomically locates NIRS optodes for comparison with fMRI, fNIRS-MRI, or subject-specific modeling. | 3D digitizer (Polhemus) or photogrammetry system. |
| Motion Artifact Mitigation | Accelerometer-based optodes or specialized tape/adhesive to minimize movement-induced signal drift. | Double-sided adhesive rings, elastic caps with embedded accelerometers. |
| Spectral Fitting Algorithm Software | Converts optical measurements to chromophore concentrations. Must include a CCO model. | UCLn algorithm (NIRS Brain AnalyzIR toolbox), SfS (ISS), or proprietary vendor software. |
| Vascular Occlusion Cuff | Standardized perturbation for dynamic redox challenge tests. Rapid inflation/deflation capability. | Pneumatic tourniquet system (Hokanson, DE Hokanson Inc) with automatic controller. |
| Subject-Specific Anatomical Model | Improves quantification accuracy, especially for FD/TR-NIRS. | Atlas-based or individual MRI-derived head/brain models for light propagation modeling (e.g., NIRFAST, AtlasViewer). |
The selection between CW, FD, and TR-NIRS is pivotal for redox state assessment research. CW-NIRS offers a cost-effective entry for relative, high-temporal resolution monitoring but is confounded by cross-talk and depth limitations. FD-NIRS provides a practical balance, delivering absolute chromophore concentrations crucial for cross-subject comparison in drug trials. TR-NIRS, while resource-intensive, offers the highest fidelity for disentangling the CCO signal from hemodynamic noise and probing deeper tissues. For definitive research on mitochondrial redox state, FD or TR systems are strongly recommended. The future lies in hybrid systems and advanced computational models to fully unlock NIRS's potential as a non-invasive window into cellular metabolism.
This technical guide is framed within a broader thesis on the application of Near-Infrared Spectroscopy (NIRS) for non-invasive assessment of cellular redox states. The accurate determination of redox biomarkers, such as the oxidation state of cytochrome c oxidase (CCO) and the balance of oxy/deoxy-hemoglobin/myoglobin, is critically dependent on the optical interrogation of the correct tissue volume with sufficient signal-to-noise ratio. Probe design and placement are therefore foundational to generating valid, reproducible physiological and pharmacological data in brain, skeletal muscle, and peripheral organ studies in both clinical and preclinical research.
Fundamental Principles of NIRS for Redox Assessment
NIRS leverages the relative tissue transparency to light in the 650-1000 nm range to assess chromophore concentration changes based on the modified Beer-Lambert law. Key redox-relevant chromophores include:
- Hemoglobin (HbO₂, HHb): Indirect redox indicators via oxygen delivery/utilization.
- Myoglobin (MbO₂, Mb): Dominant in muscle, complicating separation from hemoglobin.
- Cytochrome c Oxidase (CCO): Direct marker of mitochondrial redox state and cellular metabolic function.
Multiwavelength, frequency-domain, and time-resolved NIRS systems are employed to disentangle these signals. The penetration depth is a function of source-detector separation (SDS), with a general rule of depth being ~1/3 to 1/2 of the SDS.
Quantitative Design Parameters by Tissue Type
The following table summarizes critical design and placement parameters optimized for different organ systems, based on current literature and technical specifications from leading manufacturers (e.g., Artinis, NIRx, ISS).
Table 1: Probe Design & Placement Optimization Parameters
| Parameter | Brain (Cortical) | Skeletal Muscle | Peripheral Organs (e.g., Liver, Kidney) |
|---|---|---|---|
| Typical SDS | 30-40 mm (adult human); 3-8 mm (rodent) | 25-35 mm (human); 10-20 mm | Highly variable; 15-30 mm (transcutaneous); <5 mm (laparoscopic) |
| Target Depth | 15-20 mm (adult cortex) | 10-15 mm (into muscle belly) | Organ-specific, often 20-40 mm below surface |
| Probe Geometry | Dense arrays (e.g., 10x10 grids) for tomography; linear/rectangular for topography. | Linear or paired optodes along muscle fiber direction. | Flexible grids or single-pair probes adaptable to organ contour. |
| Key Challenges | Scalp/skull signal contamination, hair, motion. | Adipose tissue layer thickness, myoglobin cross-talk. | Signal attenuation by overlying tissue (skin, fat, fascia), organ movement. |
| Placement Landmarks | International 10-20/10-10 system for reproducible registration. | Muscle belly, distal to motor point, aligned with fibers. | Organ-specific anatomical landmarks (e.g., right hypochondrium for liver). |
| Optimal Wavelengths | 730, 810, 850 nm (for Hb and CCO) | 690, 730, 780, 810, 850 nm (for Hb/Mb deconvolution & CCO) | 730, 760, 810, 850 nm (water absorption considered) |
| Common Protocols | Functional activation (cognitive/motor), hemodynamic response. | Occlusion/reactive hyperemia, exercise (isometric/dynamic). | Ischemia-reperfusion, pharmacological challenge. |
Detailed Experimental Protocols
Protocol: Forearm Muscle Redox Assessment During Ischemic Challenge
Objective: To measure oxidative metabolism and hemodynamic redox shifts in skeletal muscle. Materials: Continuous-wave multiwavelength NIRS system (≥4 wavelengths), pneumatic cuff occluder.
- Subject Preparation: Position subject semi-recumbent. Mark the flexor digitorum profundus belly. Shave/shave hair if necessary.
- Probe Placement: Secure a linear probe array with SDS=30 mm longitudinally along the muscle fibers. Secure with medical adhesive and a black light-proof cloth.
- Baseline: Record 5 minutes of resting data.
- Arterial Occlusion: Inflate proximal cuff to ≥50 mmHg above systolic pressure. Maintain for 30-60 seconds (short) or 5-10 minutes (metabolic).
- Reperfusion: Rapidly deflate cuff. Record 10 minutes of recovery.
- Data Analysis: Fit optical density changes to spectroscopic models to resolve HHb/Mb, HbO₂/MbO₂, and oxidized CCO trajectories.
Protocol: Prefrontal Cortex (PFC) Functional Activation
Objective: To assess cortical hemodynamic and redox responses to cognitive load. Materials: Frequency-domain or time-resolved NIRS system, dense array probe cap.
- Probe Registration: Alumber probe holder or cap with 10-10 system coordinates (e.g., Fpz, Fp1, Fp2). SDS = 35 mm.
- Task Design: Block design (e.g., 30s baseline, 60s N-back task, 30s rest, repeated).
- Data Acquisition: Record throughout task performance. Monitor for motion artifacts.
- Signal Processing: Apply band-pass filtering (0.01-0.3 Hz), motion correction (e.g., wavelet-based). Generate topographic maps of HbO₂ and CCO responses.
Visualization of Workflows and Pathways
Title: NIRS Redox Study Experimental Workflow
Title: Physiological Pathway Linking Stimulus to NIRS Signal
The Scientist's Toolkit: Research Reagent Solutions
Table 2: Essential Materials for NIRS Redox Studies
| Item | Function & Rationale |
|---|---|
| Multi-Wavelength NIRS System (e.g., FD or TD system) | Enables spectral unfolding to separate contributions of Hb, Mb, water, and CCO, which is critical for direct redox assessment. |
| Probe Holder/Cap with 10-10 System Registration | Ensures reproducible placement over brain regions across subjects and sessions. |
| Black Opaque Cloth/Probe Cover | Eliminates ambient light contamination, a major source of noise. |
| Medical Adhesive & Skin Prep (e.g., double-sided tape, alcohol wipe) | Secures probe and minimizes motion artifacts; improves skin contact. |
| Anatomical Localizer (e.g., MRI-visible fiducials, 3D digitizer) | Co-registers NIRS probe locations with anatomical (MRI) or functional (fMRI) data. |
| Calibration Phantom with known optical properties | Validates system performance and calibrates tissue oxygen saturation (StO₂) measurements. |
| Hemodynamic Perturbation Tool (e.g., pneumatic cuff, tilt table) | Provides controlled physiological challenges to test redox system responsiveness. |
| Motion Tracking System (e.g., accelerometer, camera) | Tags motion artifacts for subsequent rejection or correction in data processing. |
| Spectroscopic Modeling Software (e.g., NIRS-SPM, Homer2, custom LABView) | Fits acquired optical data to biophysical models to extract chromophore concentrations. |
Standardized Experimental Protocols for Dynamic Redox Monitoring
This technical guide provides standardized experimental protocols for dynamic redox monitoring, framed within a broader thesis on the advancement of Near-Infrared Spectroscopy (NIRS) for non-invasive redox state assessment. The accurate, reproducible measurement of dynamic redox processes is critical for research in oxidative stress, mitochondrial function, metabolic diseases, and the mode-of-action studies for redox-modulating therapeutics. This document establishes a core methodological framework to ensure consistency and comparability across studies, directly supporting the validation of NIRS as a primary non-invasive tool.
Core Principles and Quantifiable Redox Pairs
Effective redox monitoring relies on measuring specific, reversible redox couples. The following table summarizes key quantifiable pairs and their respective NIRS-detectable components.
Table 1: Primary Redox Couples for Dynamic Monitoring
| Redox Couple | Reduced Form (NIRS Signal Source) | Oxidized Form | Midpoint Potential (E°') at pH 7.0 | Primary Compartment | Key NIRS Absorption Band(s) |
|---|---|---|---|---|---|
| Cyt c | Ferrocytochrome c (Cyt c²⁺) | Ferricytochrome c (Cyt c³⁺) | +260 mV | Mitochondrial IMS | ~550 nm (Soret), ~820 nm (NIR) |
| NADH/NAD⁺ | NADH (Nicotinamide adenine dinucleotide) | NAD⁺ | -320 mV | Mitochondrial Matrix, Cytosol | ~340 nm (UV), ~700-900 nm (flavoprotein-correlated) |
| FADH₂/FAD | FADH₂ (Flavin adenine dinucleotide) | FAD, FAD⁺ | ~ -220 mV (FAD/FADH₂) | Mitochondrial Matrix | ~450 nm, ~850-900 nm (oxidized flavin) |
| Hb/Mb | Deoxyhemoglobin (HHb), Deoxymyoglobin | Oxyhemoglobin (O₂Hb), Oxymyoglobin | N/A | Vasculature, Muscle | ~760 nm (HHb), ~850-920 nm (O₂Hb) |
| Cyt aa3 | Reduced Cuₐ/Cytochrome a | Oxidized Cuₐ/Cytochrome a | +210 mV (Cuₐ) | Mitochondrial Complex IV | ~830-850 nm (Cuₐ) |
Standardized Experimental Protocols
Protocol A: In Vitro Calibration of Redox Sensors
Objective: To establish a standard curve for the optical response (absorbance/fluorescence) of a redox-sensitive probe or endogenous chromophore across a defined redox potential (Eh) range.
Materials & Reagents:
- Redox buffer system (e.g., 50 mM HEPES, 100 mM KCl, pH 7.0).
- Mediator cocktails: Low-potential (e.g., 50 µM quinones, 50 µM riboflavin) and high-potential (e.g., 50 µM ferricyanide, 50 µM DCPIP).
- Target chromophore (e.g., purified cytochrome c, mitochondrial suspension).
- Reducing agent (e.g., Sodium dithionite, NADH).
- Oxidizing agent (e.g., Potassium ferricyanide).
- Anaerobic chamber or sealed, nitrogen-flushed cuvettes.
- Spectrophotometer with NIRS capability (650-900 nm).
Procedure:
- Prepare 10 ml of redox buffer in an anaerobic cuvette.
- Add mediator cocktail (final concentration 10 µM each) and target chromophore.
- Seal the cuvette and maintain at 30°C.
- Using microliter syringes, titrate with small aliquots of sodium dithionite (reduction) or potassium ferricyanide (oxidation).
- After each addition, allow 5 min for equilibrium, then measure:
- Eh using a platinum electrode and reference electrode.
- Full spectrum (350-900 nm).
- Plot absorbance at specific wavelengths (e.g., 550 nm for Cyt c, 830 nm for Cuₐ) against measured Eh. Fit data to the Nernst equation.
Protocol B: Ex Vivo Tissue Redox Monitoring During Metabolic Transitions
Objective: To dynamically monitor redox state shifts in perfused or suspended tissue (e.g., muscle, liver) in response to defined metabolic challenges.
Materials & Reagents:
- Tissue perfusion system (e.g., Langendorff for heart, chamber for muscle bundle).
- Oxygenated, temperature-controlled physiological buffer (e.g., Krebs-Henseleit).
- Metabolic modulators: Substrates (Glucose, Pyruvate, Fatty acids), Inhibitors (Rotenone, Antimycin A, Cyanide), Uncouplers (FCCP).
- Dual-wavelength or multi-wavelength NIRS system.
Procedure:
- Secure tissue in perfusion chamber, maintaining physiological temperature and oxygenation.
- Establish baseline NIRS recording (minimum 5 min). Recommended wavelengths: 760 nm (deoxy-Hb/Mb reference), 830 nm (oxidized Cuₐ), 850 nm (oxidized flavoproteins), 900 nm (oxy-Hb reference).
- Initiate experimental sequence:
- Transition 1 (State 4→3): Perfuse with buffer containing 10 mM succinate. After stabilization, add 1 mM ADP.
- Transition 2 (Anoxia): Switch to nitrogen-bubbled, substrate-free buffer.
- Transition 3 (Re-oxygenation/Recovery): Return to oxygenated, substrate-rich buffer.
- Continuously record NIRS signals. Apply algorithms (e.g., modified Beer-Lambert law, multivariate analysis) to convert optical density changes into concentration changes for redox pairs in Table 1.
Protocol C: In Vivo Human Forearm Muscle Redox Assessment via NIRS
Objective: To non-invasively monitor skeletal muscle redox responses to exercise and ischemia using a standardized human model.
Materials & Reagents:
- Continuous-wave or frequency-domain NIRS device with spatially resolved spectroscopy capability.
- Pneumatic occlusion cuff and inflator.
- Ergometer (handgrip or cycle).
- Skin surface markers and optical probe holder.
Procedure:
- Position the NIRS probe optodes over the belly of the musculus brachioradialis. Inter-optode distance: 3-4 cm.
- Record a 2-minute resting baseline.
- Arterial Occlusion: Rapidly inflate the proximal cuff to 50 mmHg above systolic pressure. Maintain occlusion for 3-5 minutes, recording continuously. Note the rapid increase in deoxy-Hb/Mb (760 nm) and the slower reduction of Cyt c/Cuₐ (820-850 nm).
- Reperfusion: Rapidly release the cuff. Record the hyperemic response for 5 minutes.
- Exercise Protocol: After full recovery, initiate rhythmic handgrip exercise at 50% of maximum voluntary contraction. Record during 2 min of exercise and 5 min of recovery.
- Data Analysis: Calculate recovery kinetics (half-times) for oxy/deoxy-Hb and redox indices (e.g., NIRS-derived oxidation state of cytochrome c oxidase).
The Scientist's Toolkit: Research Reagent Solutions
Table 2: Essential Materials for Dynamic Redox Monitoring
| Item | Function & Rationale |
|---|---|
| Redox Mediator Cocktail (e.g., Xanthine/Xanthine Oxidase, Quinones) | Creates a low-potential poising environment for calibrating redox-sensitive probes in vitro, ensuring equilibrium between the electrode and the target molecule. |
| Sodium Dithionite (Na₂S₂O₄) | A strong chemical reductant used for complete reduction of target chromophores during calibration protocols (Protocol A). |
| Potassium Ferricyanide (K₃[Fe(CN)₆]) | A strong chemical oxidant used for complete oxidation of target chromophores during calibration protocols (Protocol A). |
| Rotenone & Antimycin A | Specific inhibitors of mitochondrial Electron Transport Chain (ETC) Complex I and III, used to induce defined redox states (e.g., maximal reduction of upstream components) in ex vivo protocols (Protocol B). |
| Carbonyl Cyanide-p-trifluoromethoxyphenylhydrazone (FCCP) | A protonophore uncoupler that dissipates the mitochondrial proton gradient, forcing the ETC to operate at maximum rate (State 3u), inducing a more oxidized state. |
| Near-Infrared Spectroscopy System (e.g., Continuous Wave, Frequency Domain, Time-Resolved) | The core instrument for non-invasive monitoring. Different systems offer varying degrees of quantification (absolute vs. relative) and depth penetration. |
| Platinum Redox Electrode with Reference Electrode | The gold-standard for measuring solution redox potential (Eh) during in vitro calibration experiments (Protocol A). Essential for relating optical signals to thermodynamic potential. |
Signaling and Metabolic Pathways for Redox Monitoring
Standardized Experimental Workflow
This whitepaper, situated within a broader thesis on Near-Infrared Spectroscopy (NIRS) for non-invasive redox state assessment, details advanced methodologies for probing cerebral metabolism and neurovascular coupling (NVC). NVC, the tight temporal and spatial relationship between neuronal activity, metabolic demand, and cerebral blood flow (CBF), is fundamental to brain health and is disrupted in numerous pathologies. We present a technical guide on state-of-the-art tools, emphasizing multimodal integration with NIRS, to quantify these processes for research and therapeutic development.
Neuronal signaling is energetically expensive, relying almost exclusively on aerobic glucose metabolism. Activation triggers a coordinated response: a rapid increase in local CBF (the hemodynamic response) delivers oxygen and glucose, followed by an increase in the cerebral metabolic rate of oxygen (CMRO₂). This NVC process ensures homeostasis. Precise tracking of these interrelated phenomena—oxygenation, blood volume, redox state, and metabolite flux—is critical for understanding brain function and assessing interventions for neurodegenerative diseases, stroke, and psychiatric disorders.
Core Quantitative Metrics and Modalities
Quantitative assessment requires measuring key physiological variables. The table below summarizes primary metrics and the leading non-invasive and minimally invasive techniques used to track them.
Table 1: Core Metrics and Modalities for Tracking Metabolism & NVC
| Physiological Metric | Primary Technique(s) | Key Quantitative Outputs | Temporal Resolution | Spatial Resolution |
|---|---|---|---|---|
| Hemoglobin Dynamics | Functional NIRS (fNIRS), fMRI | Δ[O₂Hb], Δ[HHb], Δ[THb], Tissue Oxygenation Index (TOI) | ~0.1-1 s | ~1-5 cm (fNIRS) |
| Cerebral Blood Flow (CBF) | Arterial Spin Labeling MRI (ASL), Transcranial Doppler (TCD) | Cerebral Blood Flow (mL/100g/min) | ~3-5 s (ASL) | High (ASL) |
| Cerebral Metabolic Rate of O₂ (CMRO₂) | Combined fMRI (BOLD, ASL) & NIRS, Calibrated fMRI | ΔCMRO₂ (%) | ~1-10 s | ~2-3 mm |
| Redox State (Cyt c oxidase) | Broadband NIRS, Time-Resolved NIRS | Δ[CCO] oxidation state (μM) | ~0.1-1 s | ~1-3 cm |
| Glucose Metabolism | Positron Emission Tomography (FDG-PET), Magnetic Resonance Spectroscopy (MRS) | Cerebral Metabolic Rate of Glucose (CMRglu), Lactate levels | ~1 min (PET) | High (PET) |
| Neurotransmitter Flux | Functional MRS (fMRS), PET | ΔGlutamate, ΔGABA (mM) | ~1-5 min | Voxel (1-8 cm³) |
Experimental Protocols for Integrated Assessment
Protocol 3.1: Multimodal fNIRS-fMRI for Calibrated CMRO₂ Measurement
This protocol quantifies the absolute change in CMRO₂ during neural activation by combining the sensitivity of fMRI's Blood Oxygenation Level Dependent (BOLD) signal with NIRS-derived hemoglobin concentrations.
Materials: Hybrid fNIRS-fMRI system, MR-compatible NIRS probe, visual or motor stimulus paradigm, gas delivery system for hypercapnia/ hyperoxia calibration.
- Co-registration: Precisely map the fNIRS probe geometry to the subject's scalp within the MR coordinate system using fiduciary markers.
- Baseline Acquisition: Collect simultaneous resting-state BOLD fMRI and fNIRS (O₂Hb, HHb) data for 5-10 minutes.
- Hypercapnic Calibration: Subject breathes air mixed with 5% CO₂ for 2-3 minutes. Measure the BOLD and fNIRS response to this purely vascular stimulus (the "M" parameter).
- Task Paradigm: Perform block-design (e.g., 30s rest, 30s finger tapping) or event-related tasks. Acquire simultaneous data throughout.
- Analysis: Use the modified Davis model: ΔCMRO₂/CMRO₂₀ ≈ (ΔCBF/CBF₀) – (ΔBOLD/BOLD₀)/M. fNIRS Δ[HHb] serves as a cross-validation for the deoxyhemoglobin component of the BOLD signal.
Protocol 3.2: Broadband NIRS for Redox State (CCO) and Hemodynamics
This protocol leverages the differential absorption spectra of hemoglobins and cytochrome c oxidase (CCO) to assess the cellular metabolic state concurrently with hemodynamics.
Materials: Broadband NIRS system (650-900 nm), high-density probe array, spectral fitting software.
- System Calibration: Perform intensity and wavelength calibration using phantoms with known optical properties.
- Data Acquisition: Place probe over region of interest (e.g., prefrontal cortex). Record continuous spectral data during resting state and task execution.
- Spectral Analysis: Fit measured attenuation spectra using the Beer-Lambert law extended to multiple chromophores:
- Primary Chromophores: Oxyhemoglobin (O₂Hb), Deoxyhemoglobin (HHb).
- Key Metabolic Chromophore: Oxidized CCO (within the NIR window).
- Quantification: Use a priori spectral libraries to resolve concentration changes (ΔμM) for each chromophore. Δ[CCO] provides a direct, though challenging to isolate, measure of mitochondrial redox shifts.
Signaling Pathways in Neurovascular Coupling
The cellular signaling cascade that links synaptic activity to vascular dilation is central to NVC. The following diagram illustrates the primary pathways involving neurons, astrocytes, and the vascular endothelium.
Diagram Title: Cellular Pathways of Neurovascular Coupling
Multimodal Experimental Workflow
Integrating multiple techniques provides a comprehensive picture. The following workflow outlines a sequential study design combining TCD, fNIRS, and venous outflow sampling.
Diagram Title: Multimodal NVC/Metabolism Study Workflow
The Scientist's Toolkit: Essential Research Reagents & Materials
Table 2: Key Research Reagent Solutions for NVC/Metabolism Studies
| Item / Reagent | Function / Role in Research |
|---|---|
| Broadband NIRS Source & Spectrometer | Enables spectral resolution of multiple chromophores (HbO₂, HHb, CCO) for combined hemodynamic and redox assessment. |
| High-Density fNIRS Probe Arrays | Provides improved spatial resolution and enables topographic mapping of cortical hemodynamic responses. |
| MR-Compatible fNIRS Systems | Allows for simultaneous acquisition with fMRI, facilitating calibrated CMRO₂ measurements and anatomical co-registration. |
| Gas Mixing System (O₂, CO₂, N₂) | For administering precise gas challenges (hypercapnia, hyperoxia) to calibrate vascular reactivity and BOLD signal. |
| L-NMMA or L-NAME (NOS Inhibitor) | Pharmacological tool to block nitric oxide synthase, probing the specific contribution of the NO pathway to NVC. |
| Fluorescent Ca²⁺ Indicators (e.g., GCaMP) | For in vivo or in situ imaging of neuronal and astrocytic calcium dynamics, a key trigger in NVC signaling. |
| ²H/¹³C-labeled Glucose (for NMR/MS) | Tracer for quantifying cerebral metabolic rates and pathway fluxes (glycolysis, TCA cycle) via Magnetic Resonance Spectroscopy or Mass Spectrometry. |
| Functional MRS Pulse Sequences | Specialized MRI protocols to dynamically measure concentration changes of metabolites (Glu, GABA, Lac) during brain activation. |
| Transcranial Doppler (TCD) Ultrasound | Non-invasive, high-temporal-resolution measurement of blood flow velocity in major cerebral arteries (MCA, ACA). |
| Arterial & Jugular Venous Catheter Kits | For direct blood sampling to measure global cerebral oxygen extraction fraction (OEF) and metabolic substrate uptake/release. |
This technical guide examines the development of metabolic modulators—compounds targeting pathways like AMPK, PPARs, PGC-1α, and mitochondrial function—within the framework of advancing non-invasive assessment technologies. A core thesis driving contemporary research is the application of Near-Infrared Spectroscopy (NIRS) for real-time, non-invasive monitoring of tissue redox states (e.g., cytochrome c oxidase oxidation, NADH fluorescence). This capability provides a transformative tool for quantifying the in vivo pharmacodynamic effects of metabolic modulators, bridging preclinical findings and clinical outcomes with continuous, longitudinal data.
Preclinical Assessment of Metabolic Modulators
Preclinical studies require a multi-faceted approach to establish proof-of-concept, mechanism of action, and safety.
1In VitroScreening and Mechanistic Studies
Core Protocol: High-Throughput Seahorse XF Analyzer Assay
- Objective: Quantitatively assess cellular metabolic function (glycolysis and mitochondrial respiration) in real-time.
- Cell Preparation: Seed target cells (e.g., hepatocytes, cardiomyocytes, cancer cells) in a specialized XF microplate. Culture to ~80% confluence.
- Compound Treatment: Incubate cells with the metabolic modulator at a range of concentrations (e.g., 1 nM – 100 µM) for a defined period (4-24h).
- Assay Run: Replace media with XF assay medium. Sequentially inject modulators from the XFp/XFe Analyzer: 1) Oligomycin (ATP synthase inhibitor), 2) FCCP (mitochondrial uncoupler), 3) Rotenone & Antimycin A (complex I & III inhibitors).
- Key Outputs: Oxygen Consumption Rate (OCR, pmol/min) and Extracellular Acidification Rate (ECAR, mpH/min) are measured. Parameters calculated include basal respiration, ATP-linked respiration, proton leak, maximal respiratory capacity, and spare respiratory capacity.
Research Reagent Solutions Table
| Item | Function |
|---|---|
| Seahorse XFp/XFe Analyzer | Instrument for real-time, simultaneous measurement of OCR and ECAR in living cells. |
| XF Assay Medium | Bicarbonate-free, pH-stable medium optimized for gas exchange measurements. |
| Oligomycin | Inhibits ATP synthase; used to calculate ATP-linked respiration. |
| FCCP | Uncouples mitochondrial respiration to measure maximal respiratory capacity. |
| Rotenone & Antimycin A | Inhibit mitochondrial electron transport chain to measure non-mitochondrial respiration. |
| Target-Specific Reporter Cell Lines | Cells with luciferase or fluorescent reporters under control of metabolic pathway elements (e.g., AMPK response element). |
2In VivoAnimal Models
Quantitative data from common preclinical models are summarized below.
Table 1: Common Preclinical Models for Metabolic Modulators
| Model Type | Specific Model/Indication | Key Readouts | Relevance to NIRS Redox Assessment |
|---|---|---|---|
| Metabolic Syndrome | High-Fat Diet (HFD) fed C57BL/6J mice | Body weight, glucose tolerance (AUC), insulin levels, liver triglycerides. | NIRS can monitor skeletal muscle or liver redox state changes during oral glucose tolerance tests. |
| Heart Failure | Transverse Aortic Constriction (TAC) in mice | Ejection fraction (%), left ventricular mass, exercise capacity, biomarkers (BNP). | NIRS assesses cardiac or peripheral muscle oxidative capacity and oxygen utilization deficits. |
| Genetic Models | db/db or ob/ob mice (Type 2 Diabetes) | Fasting glucose, HbA1c, insulin resistance (HOMA-IR). | Enables non-invasive tracking of redox improvements in target tissues over time. |
| Toxicology | 28-day repeat-dose study in rats | Organ weights, clinical chemistry (ALT, AST, creatinine), histopathology. | Potential to reduce invasive terminal blood draws via continuous tissue oxygenation/redox monitoring. |
Core Protocol: Integrated NIRS Measurement in a Preclinical Efficacy Study
- Animal Model: HFD-induced obese mouse.
- Treatment: Metabolic modulator (e.g., AMPK activator) vs. vehicle control, administered daily for 4 weeks.
- NIRS Integration: Prior to terminal studies, anesthetized mice are subjected to NIRS probe placement over the quadriceps femoris.
- Procedure: A short period of limb ischemia is induced via arterial occlusion. NIRS records the decrease in tissue oxygen saturation (StO2) during occlusion and the rate of reoxygenation (reperfusion slope) upon release.
- Outcome: The reperfusion slope is a functional measure of mitochondrial oxidative capacity and microvascular function, providing a direct, non-invasive pharmacodynamic biomarker of drug effect.
Clinical Assessment of Metabolic Modulators
Clinical translation focuses on establishing safety, target engagement, and early efficacy.
Phase I: First-in-Human & Pharmacokinetics/Pharmacodynamics (PK/PD)
Core Protocol: Stable Isotope Tracer Infusion for Whole-Body Metabolism
- Objective: Quantify the effect of a modulator on systemic substrate utilization (e.g., glucose, fatty acids).
- Design: Randomized, placebo-controlled, double-blind study in healthy volunteers or patients.
- Procedure: After an overnight fast, a primed, continuous infusion of [6,6-²H₂]glucose is started to measure glucose rate of appearance (Ra) and disappearance (Rd). A metabolic modulator or placebo is administered. Frequent blood sampling occurs over 24h. Isotopic enrichment is measured via Gas Chromatography-Mass Spectrometry (GC-MS).
- PK/PD Integration: Plasma drug concentrations (PK) are correlated with changes in glucose Ra/Rd, insulin levels, or free fatty acids (PD).
Phase II: Proof-of-Concept & Biomarker Validation
This phase integrates more complex metabolic assessments and begins formal validation of NIRS-based endpoints.
Table 2: Key Clinical Assessments for Metabolic Modulators
| Assessment Type | Specific Method | Primary Endpoint(s) | Role of NIRS Redox Assessment |
|---|---|---|---|
| Glucose Metabolism | Hyperinsulinemic-Euglycemic Clamp | M-value (glucose disposal rate, mg/kg/min) | NIRS on skeletal muscle can provide complementary data on local tissue oxidative response to insulin. |
| Exercise Capacity | Cardiopulmonary Exercise Testing (CPET) | Peak VO₂ (mL/kg/min), VO₂ at anaerobic threshold. | NIRS on vastus lateralis monitors muscle deoxygenation kinetics, correlating with whole-body VO₂. |
| Body Composition | DEXA/MRI | Fat mass, lean mass, visceral adipose tissue volume. | -- |
| Imaging | ³¹P-Magnetic Resonance Spectroscopy (MRS) | Phosphocreatine (PCr) recovery rate post-exercise (indirect mitochondrial function). | NIRS offers a more accessible, continuous alternative/supplement to MRS for monitoring tissue oxygenation dynamics. |
| Non-Invasive Redox | NIRS with Vascular Occlusion Test | Tissue Oxygen Saturation (StO2%), Reperfusion Slope (%/s). | Direct endpoint: Validates NIRS-derived redox parameters as biomarkers of mitochondrial modulation. |
Signaling Pathways of Key Metabolic Targets
AMPK and PPAR-α Agonist Pathways Converge on Metabolism
Experimental Workflow from Preclinical to Clinical
Integrated Drug Dev Workflow with NIRS Biomarkers
The development of metabolic modulators is increasingly supported by quantitative, mechanistic biomarkers. Integrating non-invasive technologies like NIRS for redox state assessment throughout the preclinical and clinical pipeline offers a powerful strategy to directly visualize target engagement, understand tissue-specific pharmacodynamics, and potentially de-risk clinical development by providing early, objective evidence of biological activity.
The non-invasive assessment of cellular redox state represents a pivotal frontier in biomedical research. Near-Infrared Spectroscopy (NIRS), particularly in the form of Cytochrome c Oxidase (CCO) redox monitoring, provides a critical window into mitochondrial function in vivo and in vitro. This whitepaper frames emerging applications within the broader thesis that NIRS-based redox state assessment is a transformative tool for understanding disease pathogenesis and therapeutic efficacy across disparate fields. By directly probing the terminal electron acceptor of the electron transport chain, CCO redox state serves as a master integrator of cellular metabolic and oxygen utilization status, offering a non-invasive biomarker of mitochondrial dysfunction in real time.
Mitochondrial Dysfunction: A Convergent Pathophysiological Mechanism
Mitochondrial dysfunction, characterized by impaired oxidative phosphorylation, increased reactive oxygen species (ROS) production, and altered bioenergetics, is a central node in the pathophysiology of sepsis, cancer, and neurodegenerative diseases. The table below summarizes key quantitative markers of this dysfunction across the three model systems.
Table 1: Quantitative Markers of Mitochondrial Dysfunction Across Disease Models
| Parameter | Sepsis Model (e.g., CLP in rodents) | Cancer Model (e.g., Xenografts) | Neurodegenerative Model (e.g., APP/PS1 mice) |
|---|---|---|---|
| ATP Production Rate | ↓ 40-60% in vital organs | Variable (Warburg effect: ↓ oxidative, ↑ glycolytic) | ↓ 20-35% in hippocampal tissue |
| ROS Production | ↑ 2-3 fold (cytokine storm induced) | ↑ (Drives genomic instability, promotes metastasis) | ↑ 1.5-2.5 fold (Associated with Aβ & tau) |
| Mitochondrial Membrane Potential (ΔΨm) | ↓ 25-40% (Uncoupling, pore opening) | Often ↑ (Resistant to apoptosis) | ↓ 15-30% (Synaptic mitochondria) |
| CCO Redox State (vs. Baseline) | More reduced (Tissue hypoxia, inhibition) | More oxidized (Hypoxic tumor core) or variable | More reduced (Chronic bioenergetic failure) |
| Oxygen Consumption Rate (OCR) | ↓ 50-70% (Septic shock phase) | ↓ in oxidative phosphorylation, but total metabolism ↑ | ↓ 20-40% in affected neuronal populations |
NIRS Principles for Redox State Monitoring
NIRS (700-1000 nm) allows tissue penetration and quantification of chromophore concentration changes based on the modified Beer-Lambert law. Critically, the redox state of CCO, which has distinct absorption spectra in its oxidized (CuA^2+) and reduced (CuA^+) forms, can be monitored alongside hemoglobin oxygenation. Advanced spatially resolved or frequency-domain NIRS systems isolate the CCO signal, providing a direct readout of mitochondrial respiratory chain activity.
Experimental Protocols for Key Applications
Protocol: Monitoring Sepsis-Induced Mitochondrial Dysfunction in a Rodent CLP Model
Objective: To non-invasively track temporal changes in cerebral and muscular mitochondrial redox state during septic progression.
Materials: Adult Sprague-Dawley rats, frequency-domain NIRS system with multi-distance detectors, cecal ligation and puncture (CLP) surgical tools, isoflurane anesthesia setup, physiological monitoring (temperature, blood pressure).
Procedure:
- Baseline Measurement: Anesthetize rat. Position NIRS optodes over skull (brain) and hindlimb (muscle). Acquire 10-minute baseline CCO redox data (reported as oxidation index relative to a reference).
- CLP Induction: Perform standard CLP surgery to induce polymicrobial sepsis. Return animal to cage for recovery.
- Longitudinal Monitoring: At 6, 12, 24, and 48 hours post-CLP, re-anesthetize and record NIRS signals from identical positions.
- Terminal Assays: Euthanize. Harvest tissues for validation (high-resolution respirometry, complex IV activity assay, ATP levels).
- Data Analysis: Correlate the trajectory of the CCO oxidation index with survival, hemodynamic parameters, and ex vivo mitochondrial assays.
Title: Experimental Workflow for Sepsis Mitochondrial Monitoring
Protocol: Assessing Tumor Metabolic Heterogeneity in a Xenograft Model
Objective: To map spatial and temporal heterogeneity of mitochondrial redox state in a solid tumor and its response to chemotherapy.
Materials: Immunodeficient mice, human cancer cell line (e.g., MDA-MB-231), bioluminescence imaging system, continuous-wave portable NIRS system with raster scanning stage, chemotherapeutic agent (e.g., Doxorubicin).
Procedure:
- Tumor Implantation: Subcutaneously inject cancer cells into flank. Monitor growth via calipers and bioluminescence.
- Pre-Treatment Scan: At tumor volume ~500 mm³, anesthetize mouse. Perform raster scan with NIRS optode over tumor and contralateral control site. Generate 2D map of CCO redox state and tissue oxygenation.
- Treatment: Administer chemotherapy or vehicle control.
- Post-Treatment Scans: Repeat NIRS mapping at 24, 48, and 72 hours post-treatment.
- Analysis: Coregister NIRS maps with histological sections stained for hypoxia (pimonidazole), apoptosis (TUNEL), and proliferation (Ki67). Quantify correlation between pre-treatment CCO state and regional cell death post-treatment.
Title: Tumor Metabolic Heterogeneity Assessment Workflow
Protocol: Evaluating Mitochondrial Response in a Neurodegenerative Disease Model
Objective: To measure cerebral mitochondrial redox state during cognitive task performance in a transgenic mouse model of Alzheimer's disease.
Materials: APP/PS1 transgenic mice and wild-type littermates, custom NIRS headpiece for awake, behaving mice, Morris water maze or Y-maze, stereotaxic frame for optode placement verification.
Procedure:
- Headpiece Implantation: Under anesthesia, affix a lightweight, chronic NIRS headpiece with fixed emitter-detector pairs over the prefrontal cortex and hippocampus.
- Habituration: Allow recovery, then habituate mice to handling and the behavioral apparatus with headpiece connected via a flexible fiber bundle.
- Baseline Resting Scan: Record 15-minute CCO and hemodynamic signals in home cage.
- Task-Performance Scanning: While mouse performs the cognitive task (e.g., Y-maze alternation), simultaneously record behavioral video and NIRS data.
- Analysis: Compare the magnitude and kinetics of the CCO oxidation response to cognitive challenge between transgenic and wild-type mice. Correlate with amyloid plaque burden post-mortem.
Title: Awake-Behaving Brain Mitochondrial Monitoring Protocol
Signaling Pathways of Mitochondrial Dysfunction
The convergence of dysfunction across diseases involves key pathways affecting mitochondrial integrity.
Title: Convergent Pathways to Mitochondrial Dysfunction
The Scientist's Toolkit: Key Research Reagent Solutions
Table 2: Essential Materials for NIRS-based Mitochondrial Dysfunction Research
| Item | Function/Application | Example/Note |
|---|---|---|
| Frequency-Domain or Broadband NIRS System | Provides quantifiable measurements of CCO redox state by resolving scattering and absorption. | Systems from companies like ISS, NIRx, or Gowerlabs. Critical for isolating the CCO signal. |
| Chronic Implantable Optodes or Headpieces | Enables longitudinal monitoring in awake, behaving animal models, reducing anesthesia confounders. | Custom-built or commercial (e.g., Doric Lenses) lightweight headpieces for rodents. |
| Validated Disease Model | Provides a pathophysiologically relevant context (e.g., CLP for sepsis, xenograft for cancer, transgenic mice for AD). | Ensure model replicates key mitochondrial pathology features of the human condition. |
| High-Resolution Respirometry (Oroboros O2k) | Gold-standard ex vivo validation of mitochondrial function in tissue homogenates or isolated mitochondria. | Correlates NIRS-derived CCO state with direct measurements of OCR and respiratory control ratios. |
| CCO Activity Assay Kit | Biochemical validation of complex IV function from tissue samples post-NIRS monitoring. | Colorimetric kits (e.g., from Abcam, Sigma) measuring oxidation of cytochrome c. |
| Hypoxia & Histology Markers | Spatial validation of NIRS maps (e.g., in tumors). Pimonidazole adducts detected by immunohistochemistry. | Links regional CCO redox state with histological markers of hypoxia, proliferation, and apoptosis. |
| Data Analysis Suite | For processing raw NIRS spectra, calculating chromophore concentrations, and generating maps/time-series. | Open-source (Homer2, NIRS Brain AnalyzIR) or commercial software requiring custom algorithms for CCO. |
Navigating Challenges: Best Practices for Robust and Reproducible NIRS Redox Data
Within the context of advancing Near-Infrared Spectroscopy (NIRS) for non-invasive redox state assessment, a critical barrier to reliable data interpretation is the presence of artifacts and noise. These spurious signals, arising from subject motion, physiological processes, and instrumentation limitations, can obscure the subtle optical signatures of chromophores like cytochrome-c-oxidase (CCO) and hemoglobin redox shifts. This technical guide provides an in-depth analysis of these noise sources, offering methodologies for their identification, quantification, and mitigation to enhance the fidelity of NIRS-based redox research.
Physiological processes generate systemic signals that are often orders of magnitude larger than the targeted redox-sensitive optical changes.
Cardiopulmonary Artifacts
Cardiac and respiratory cycles induce rhythmic changes in blood volume, pressure, and flow, modulating optical absorption and scattering properties.
Key Mechanisms:
- Cardiac: Arterial pulsatility (≈1 Hz) causes periodic changes in cerebral blood volume (CBV) and arterial oxygenation.
- Respiratory: Breathing rhythms (0.2-0.3 Hz) influence intrathoracic pressure, affecting venous return and central venous pressure, leading to oscillations in deoxygenated hemoglobin (HHb).
Experimental Protocol for Characterization:
- Setup: Simultaneously acquire NIRS data (e.g., at 730, 810, 850 nm) and physiological monitors (ECG for cardiac, chest belt or capnography for respiration).
- Procedure: Subject rests quietly in a supine position for 10 minutes.
- Analysis: Perform time-frequency analysis (e.g., wavelet transform) or band-pass filtering centered on the cardiac (0.8-1.2 Hz) and respiratory (0.1-0.4 Hz) bands. Cross-correlate filtered NIRS signals with physiological traces to quantify coupling strength.
Low-Frequency Oscillations (LFOs) & Mayer Waves
Very low-frequency oscillations (<0.1 Hz) are linked to vasomotion and autonomic regulation.
Table 1: Characteristics of Physiological Oscillations in NIRS Signals
| Oscillation Type | Frequency Band | Probable Origin | Primary Impact on NIRS Signal |
|---|---|---|---|
| Cardiac | 0.8 - 1.2 Hz | Arterial pulsatility | Periodic changes in Δ[HbO2], Δ[HHb], Δ[CCO] |
| Respiratory | 0.1 - 0.4 Hz | Thoracic pressure cycles | Strong oscillations in Δ[HHb], weaker in Δ[HbO2] |
| Mayer Waves | ~0.1 Hz | Sympathetic nervous system | Coupled oscillations in blood pressure & Hb species |
| Vasomotion (LFOs) | 0.04 - 0.1 Hz | Intrinsic smooth muscle activity | Spontaneous fluctuations in all chromophores |
Diagram Title: Physiological Origins of NIRS Artifacts
Motion Artifacts
Motion is the most significant source of high-amplitude, non-physiological noise in NIRS, particularly in vulnerable populations.
Types and Characteristics
- Type I (Step-like): Sudden, high-amplitude shifts from probe-tissue coupling loss.
- Type II (Spike-like): Brief, large amplitude artifacts from sharp impacts.
- Type III (Low-frequency drift): Slow baseline drift from gradual probe displacement.
Experimental Protocol for Motion Artifact Induction & Recording
- Setup: Use a multi-distance NIRS array. Attach a 3-axis accelerometer/gyroscope directly to the optode holder.
- Procedure:
- Baseline: 2 minutes of rest.
- Instruct subject to perform structured movements: head nod (pitch), shake (yaw), and deliberate head lift.
- Repeat each movement 5 times with 30s rest.
- Analysis: Synchronize motion sensor data with NIRS. Identify artifact epochs. Calculate metrics like signal amplitude change (ΔOD) per unit of acceleration (g) or angular velocity (deg/s).
Instrumentation & Environmental Noise
Instrument-level noise sets the fundamental limit of detection (LoD) for redox changes.
Table 2: Instrumentation-Related Noise Sources and Typical Parameters
| Noise Source | Typical Magnitude (ΔOD) | Frequency Characteristic | Mitigation Strategy |
|---|---|---|---|
| Detector Dark Noise | 10⁻⁵ - 10⁻⁴ OD | White noise | Cooled detectors, lock-in amplification |
| Source Intensity Drift | 10⁻³ - 10⁻² OD | Very low frequency (<0.01 Hz) | Reference detector, intensity modulation |
| Ambient Light Leak | Can saturate detector | Variable | Light-tight shielding, optical filtering |
| Thermal Drift (Electronic) | 10⁻⁴ - 10⁻³ OD / °C | Low frequency | System warm-up, environmental control |
| Fiber Bending Loss | >10⁻² OD | Event-related | Secure, semi-rigid fiber routing |
Experimental Protocol for System Noise Floor Assessment:
- Setup: Place NIRS probes on a static, non-biological phantom with optical properties (μa, μs') matching tissue.
- Procedure: Acquire continuous data for 30-60 minutes in a controlled environment.
- Analysis: Compute the power spectral density (PSD) of the raw optical density signal. The noise equivalent power (NEP) is derived from the standard deviation in a high-frequency band (e.g., >10 Hz) where no physiological signal is present.
Mitigation Strategies & Advanced Processing
Effective noise handling requires a multi-stage pipeline.
Diagram Title: NIRS Noise Mitigation Processing Pipeline
Detailed Protocol for Motion Artifact Correction (e.g., PCA/ICA Approach):
- Input: Multi-channel, multi-wavelength ΔOD(t) data.
- Decomposition: Perform Principal Component Analysis (PCA) on the data matrix to reduce dimensionality.
- Independent Component Analysis (ICA): Apply an ICA algorithm (e.g., FastICA) to the leading PCs to separate statistically independent sources.
- Component Identification: Correlate each independent component with:
- Motion sensor traces.
- Known physiological templates (sine waves at heart rate).
- Identify artifact-dominated components by high kurtosis (spikiness) or correlation with motion.
- Reconstruction: Reconstruct the signal excluding the artifact-identified components.
- Validation: Compare the power in the movement epochs before and after correction.
The Scientist's Toolkit: Key Research Reagent Solutions
| Item Name | Function/Application in NIRS Redox Research |
|---|---|
| Tissue-Simulating Phantoms (e.g., with Intralipid, India Ink, TiO₂) | Calibrate NIRS instruments, measure system performance, and validate algorithms using materials with known, stable optical properties (μa, μs'). |
| Solid Opaque Probe Covers/Shields | Block ambient light from reaching detectors, eliminating a major source of external noise and signal saturation. |
| Medical-Grade Adhesives & Probe Holders | Secure optodes to skin, minimizing motion artifacts from probe-tissue decoupling and pressure variations. |
| Co-registration Kits (with MRI/3D digitizers) | Accurately map NIRS channel locations to anatomical landmarks or MRI scans, ensuring physiological and motion artifacts are correctly localized. |
| Broadband NIRS Light Sources (e.g., white light lasers, supercontinuum) | Enable spectral unfolding for more accurate separation of chromophores (HbO₂, HHb, CCO, lipids, water), reducing cross-talk artifacts. |
| Synchronization Hardware (e.g., LabJack, Biopac sync modules) | Precisely synchronize NIRS data with auxiliary recordings (ECG, respiration, motion tracking, task stimuli) for accurate artifact identification. |
| Certified Gas Mixtures (e.g., precision O₂, CO₂, N₂) | Administer controlled gas challenges (hypercapnia, hypoxia) to induce predictable physiological changes for system validation and artifact study protocols. |
In the context of Near-Infrared Spectroscopy (NIRS) for non-invasive redox state assessment, advanced signal processing is paramount. The accurate quantification of chromophores like cytochrome-c-oxidase (CCO) and oxy/deoxy-hemoglobin, which serve as proxies for cellular metabolic and redox states, is critically dependent on isolating the biological signal from pervasive noise and artifacts. This technical guide details the core methodologies for filtering, motion correction, and artifact removal essential for robust NIRS-based research in drug development and physiological monitoring.
Core Signal Processing Pipeline for NIRS
Preprocessing & Band-Pass Filtering
Raw NIRS signals contain components from multiple sources. A staged filtering approach is mandatory.
Experimental Protocol for Digital Filtering:
- Acquire Raw Data: Collect continuous-wave NIRS intensity data at a sampling frequency (fs) typically between 10-100 Hz.
- Convert to Optical Density (OD): Compute ΔOD for each wavelength (λ):
ΔODλ = -log10( Iλ / Iλ_baseline ). - Apply High-Pass Filter: Use a zero-phase Butterworth filter (e.g., 3rd order) with a very low cutoff frequency (e.g., 0.01 Hz) to remove baseline drift and slow physiological oscillations (e.g., vasomotion).
- Apply Low-Pass Filter: Use a zero-phase Butterworth filter with a cutoff frequency (e.g., 0.5-2 Hz) to attenuate high-frequency noise (e.g., instrument noise, cardiac pulse).
- Spectral Filtering: For frequency-domain or time-resolved NIRS, apply appropriate filters in the frequency or time domain to isolate the modulated signal component.
Table 1: Typical Filtering Parameters for NIRS Redox Studies
| Filter Type | Cutoff Frequency (Hz) | Primary Function | Common Order |
|---|---|---|---|
| DC Removal / Detrending | 0.001 - 0.01 | Removes very slow baseline drift | 1st (Linear/Polynomial) |
| High-Pass (Butterworth) | 0.01 - 0.05 | Removes Mayer waves & slow drift | 3rd - 5th |
| Low-Pass (Butterworth) | 0.5 - 2.0 | Attenuates cardiac pulse & HFs noise | 3rd - 5th |
| Band-Stop (Notch) | 48 - 52 (or powerline freq.) | Removes powerline interference | 2nd |
Motion Artifact Correction (MAC)
Motion is the dominant source of artifact in NIRS. Comparative studies (Brigadoi et al., 2014; Cooper et al., 2012) have evaluated multiple algorithms.
Detailed Experimental Protocol for Algorithm Validation:
- Data Acquisition with Ground Truth: Collect NIRS data during a protocol inducing controlled motion (e.g., tapping, head rotation). Simultaneously acquire a co-registered motion reference (e.g., accelerometer) or a "clean" signal segment as ground truth.
- Artifact Injection: For systematic testing, synthetically inject characterized motion artifacts (e.g., spike, step, slow shift) into a resting-state NIRS recording.
- Apply Correction Algorithms:
- tPCA (targeted PCA): Perform PCA on a short window around the artifact-flagged segment. Reconstruct signal without the first few principal components assumed to represent the artifact.
- CBSI (Correlation-Based Signal Improvement): Apply the linear transform:
HbO_corrected = (HbO - α*HbR)/2; HbR_corrected = (-HbO + α*HbR)/2, where α is the correlation coefficient between HbO and HbR time series. - WMN (Wavelet-MDL denoising): Decompose signal using wavelet transform. Apply Minimum Description Length (MDL) criterion to identify and threshold artifact-related coefficients. Reconstruct signal.
- Performance Quantification: Calculate metrics like
Percentage Reduction in Artifact Power,Signal-to-Noise Ratio (SNR) Improvement, andPearson Correlation (r) with Ground Truthfor the corrected signal.
Table 2: Performance Comparison of Motion Correction Algorithms (Synthetic Artifacts)
| Algorithm | Principle | Advantages | Limitations | Typical SNR Improvement |
|---|---|---|---|---|
| tPCA | Statistical decomposition | Effective for large, sporadic artifacts. | May remove physiological signal. Requires artifact marking. | 5 - 15 dB |
| CBSI | Physiological coupling (HbO-HbR anti-correlation) | Simple, parameter-light. Preserves physiological coupling. | Less effective for concurrent HbO/HbR changes. | 3 - 10 dB |
| Wavelet-MDL | Time-frequency thresholding | Blind (no marking), handles diverse artifact shapes. | Choice of mother wavelet and threshold criteria critical. | 8 - 20 dB |
| Accelerometer-Based | Adaptive filtering using motion reference | Direct use of motion reference. Physically intuitive. | Requires hardware, co-registration challenges. | 10 - 25 dB |
Artifact Removal for Redox State (CCO) Signals
CCO signals are lower in amplitude and more susceptible to confounding from hemoglobin. Multivariate techniques are key.
Experimental Protocol for Hemodynamic Unmixing (e.g., PDA):
- Multi-Wavelength Acquisition: Acquire NIRS data at ≥4 wavelengths (e.g., 730, 750, 810, 850 nm) to improve separation of chromophores (HbO, HbR, CCO).
- Formulate the Linear Model: Construct the extinction coefficient matrix
Efor all chromophores at all wavelengths. Use the modified Beer-Lambert law:ΔA = E * C * DPF * L + ε, where ΔA is absorbance change, C is concentration change, and ε is residual. - Apply Principal Dynamic Modes (PDM) or Regression: Use a Projection-based Spatial Algorithm (e.g., based on Sassaroli et al., 2012):
- Calculate the hemoglobin-weighted sum:
HbT = ΔHbO + ΔHbR. - Perform a linear regression of the raw 810nm signal (CCO sensitive) onto
HbT. - The residual of this regression is taken as the "clean" CCO signal, orthogonalized to hemodynamic changes.
- Calculate the hemoglobin-weighted sum:
- Validation: During a functional activation or systemic challenge (e.g., hypoxia), verify that the corrected CCO signal shows expected dynamics independent of the large HbO/HbR changes.
Table 3: Key Artifact Types & Recommended Removal Techniques for Redox NIRS
| Artifact Type | Primary Source | Impact on Redox Assessment | Recommended Removal Technique |
|---|---|---|---|
| Scalp Hemodynamics | Systemic blood flow changes | Masks mitochondrial CCO signal. | Multivariate regression (PDA), ICA, short source-detector separation regression. |
| Cardiac Pulsation | Arterial pulse | High-frequency noise, complicates averaging. | Low-pass filter (<0.8 Hz), average over cardiac cycle, wavelet denoising. |
| Respiratory Oscillation | Blood pressure/volume changes | Low-frequency (~0.3 Hz) oscillation in hemodynamics. | High-pass filter (>0.1 Hz), band-stop filter. |
| Instrumentation Noise | Detector/light source noise | Adds white noise, reduces SNR. | Averaging, low-pass filtering, lock-in amplification (for FD-NIRS). |
The Scientist's Toolkit: Research Reagent Solutions
Table 4: Essential Materials & Tools for NIRS Redox Signal Processing Research
| Item / Solution | Function in Research | Example / Note |
|---|---|---|
| Digital Signal Processing Software | Implementation and testing of filtering/correction algorithms. | MATLAB with Signal Processing Toolbox, Python (SciPy, MNE-NIRS, Nilearn). |
| Synthetic NIRS Data Generator | Controlled validation of algorithms without experimental confounds. | nirs_simulator (custom scripts), SIMNOISE functions to add physiological and motion noise. |
| Accelerometer/Gyroscope Module | Hardware-based motion reference for adaptive filtering. | ADXL335 accelerometer, synchronized with NIRS data acquisition via common trigger. |
| Phantom with Dynamic Properties | Physical validation of algorithms using tissue-simulating materials. | Liquid phantom with intralipid and ink, with motorized actuators to induce controlled "motion". |
| Multiwavelength NIRS System | Enables spectral unmixing for CCO and improved artifact rejection. | Systems with laser diodes or LEDs at 4+ wavelengths (730, 810, 850, 880 nm). |
| Standardized Experimental Protocol | Generates reproducible artifacts for method comparison. | Protocol with repeated periods of rest, task (e.g., Valsalva), and induced motion. |
| Benchmark Dataset | Provides a common ground for comparing algorithm performance. | The "BEAN" dataset (Benchmark on fNIRS Artefact removal), or shared data from published papers. |
This technical guide details critical parameters for optimizing the signal-to-noise ratio (SNR) in Near-Infrared Spectroscopy (NIRS) for non-invasive redox state assessment. The accurate determination of cytochrome c oxidase (CCO) redox state, a key metabolic marker, hinges on extracting a weak spectroscopic signal from a noisy physiological background. This work is framed within a broader thesis aiming to establish robust, standardized NIRS protocols for longitudinal monitoring of mitochondrial function in therapeutic development.
Core Principles of SNR in NIRS
The detected NIRS signal is a composite of absorption from chromophores (oxy-/deoxy-hemoglobin, CCO) and scattering from tissue. Noise sources include physiological (cardiac, respiratory), instrumental (detector dark noise, source intensity fluctuations), and environmental interference. SNR optimization targets the maximization of the pathlength- and scattering-weighted absorption signal relative to this noise floor.
Parameter Optimization: Theory and Practice
Wavelength Selection
Optimal wavelength selection is paramount for isolating the CCO redox signal from the dominant hemoglobin signals.
Theory: The modified Beer-Lambert law is applied using multiple wavelengths to solve for multiple chromophore concentrations. CCO has a distinct redox-sensitive absorption band in the near-infrared (~830 nm), but its extinction coefficient is an order of magnitude smaller than hemoglobin. Wavelengths must be chosen to condition the extinction coefficient matrix for minimal cross-talk and optimal sensitivity to CCO.
Experimental Protocol for Calibration:
- System: Utilize a broadband, high-stability NIRS system (e.g., a spectrophotometer with a halogen-tungsten source and cooled CCD detector).
- Phantom Preparation: Create liquid phantoms with Intralipid (scattering) and India ink (absorption) to mimic tissue optical properties (μs' ~1.0 mm⁻¹, μa ~0.01-0.02 mm⁻¹).
- Spectral Acquisition: Introduce precise concentrations of hemoglobin (via lysed erythrocytes) and purified CCO in its oxidized/reduced states. Acquire transmission/reflectance spectra across 700-900 nm.
- Analysis: Perform multivariate linear regression or principal component analysis to derive the specific extinction spectra (ε) for each chromophore under scattering conditions.
Data Summary: Table 1: Key Wavelengths for Redox State Assessment
| Chromophore | Optimal Wavelength (nm) | Function / Rationale |
|---|---|---|
| HbO₂ | 690, 750, 830 | Isobestic points and sensitive regions for oxyhemoglobin concentration. |
| HHb | 730, 760, 850 | Regions of high sensitivity for deoxyhemoglobin concentration. |
| CCO (Oxidized) | 820-835 | Broad peak with maximum sensitivity to the copper A (CuA) redox site. |
| CCO (Reduced) | ~780, ~850 | Characteristic troughs/differences relative to oxidized state. |
| Reference | 810 (isobestic) | Minimally sensitive to HbO₂/HHb changes, useful for normalization. |
Diagram 1: Wavelength selection logic for CCO.
Source-Detector Distance (SDD)
SDD controls the penetration depth and the effective sensitivity to the cerebral cortex versus the superficial layers.
Theory: Photon migration follows a "banana-shaped" path. Increasing SDD increases mean penetration depth but exponentially attenuates light intensity, reducing signal strength. The optimal SDD balances sufficient cortical sensitivity with acceptable photon count.
Experimental Protocol for SDD Optimization:
- Setup: Use a continuous-wave (CW) NIRS system with multiple, adjustable source-detector pairs on a probe.
- Model: Place probe on a layered phantom: top layer (scalp/skull simulant, 8-10 mm thick, μa=0.02 mm⁻¹, μs'=1.5 mm⁻¹) over a deeper layer (brain simulant, μa=0.015 mm⁻¹, μs'=1.0 mm⁻¹).
- Perturbation: Introduce a small, localized absorption change (e.g., an ink-filled capillary) sequentially in the top and bottom layers.
- Measurement: For each SDD (20, 25, 30, 35, 40 mm), measure the differential optical density (ΔOD) change when the perturbation is present vs. absent.
- Calculation: Compute the sensitivity factor (ΔODsignal / μaperturbation) for each layer at each SDD. The target is to maximize the deep-layer to shallow-layer sensitivity ratio.
Data Summary: Table 2: Impact of Source-Detector Distance on Signal Characteristics
| SDD (mm) | Penetration Depth (approx.) | Light Intensity at Detector | Cortical Sensitivity | Superficial Sensitivity | Recommended Use |
|---|---|---|---|---|---|
| 15-20 | Shallow (<10 mm) | High | Very Low | Very High | Superficial muscle/ tissue studies. |
| 25-30 | Moderate (15-20 mm) | Moderate | Optimal Balance | Moderate | Standard adult cerebral cortex. |
| 35-40 | Deep (25-30 mm) | Low | High (if SNR allows) | Low | High-spec systems with powerful sources/low-noise detectors. |
| >40 | Very Deep | Very Low | Limited by Poor SNR | Very Low | Time-resolved/diffuse correlation spectroscopy systems. |
Diagram 2: Source-detector distance optimization workflow.
Signal Averaging
Averaging reduces random (uncorrelated) noise at the cost of temporal resolution.
Theory: For random (white) noise, SNR improves with the square root of the number of averaged samples (N): SNR ∝ √N. The optimal averaging window is determined by the time constant of the physiological process of interest (e.g., CCO response ~1-10 seconds post-stimulus).
Experimental Protocol for Determining Averaging Window:
- Data Acquisition: Conduct a controlled functional activation experiment (e.g., motor task, breath-hold) while acquiring raw NIRS intensity data at high frequency (e.g., 10 Hz).
- Noise Characterization: During a resting baseline period, calculate the power spectral density (PSD) of the intensity signal to identify noise components.
- Simulated Averaging: Apply moving average filters of varying window lengths (0.5s to 30s) to the raw data from the task period.
- Analysis: For each averaged time-series, calculate the contrast-to-noise ratio (CNR) of the hemodynamic/CCO response: CNR = (meantask - meanbaseline) / std_baseline. Plot CNR vs. window length. The point of diminishing returns indicates the optimal practical window.
Data Summary: Table 3: Impact of Averaging Window on Signal Quality
| Averaging Window (s) | Effective SNR Gain (vs. 1s) | Effective Temporal Resolution (s) | Suitability for CCO Monitoring |
|---|---|---|---|
| 0.1 - 1 | 1x (Baseline) | High (0.1-1) | Suitable for tracking very fast oscillations (e.g., cardiac). |
| 2 - 5 | √2 to √5 (~1.4-2.2x) | Moderate (2-5) | Optimal for event-related\nCCO responses. |
| 10 - 20 | √10 to √20 (~3.2-4.5x) | Low (10-20) | Suitable for steady-state or very slow metabolic changes. |
| >30 | High, but diminishing returns | Very Low (>30) | May smooth out physiologically relevant CCO kinetics. |
Integrated Experimental Protocol
A protocol for acquiring a high-SNR CCO signal during a functional challenge.
- Probe Design: Configure a multi-channel NIRS probe with at least two wavelengths for HbO₂/HHb (e.g., 760, 850 nm) and two for CCO (e.g., 780, 830 nm).
- SDD Placement: Set source-detector distances to 30 mm for primary channels. Include short-distance (8 mm) channels for superficial signal regression.
- Calibration: Perform a system calibration using a phantom with known optical properties.
- Subject Preparation: Position probe securely on the scalp (e.g., over prefrontal cortex). Ensure no hair under optodes. Use black cloth to block ambient light.
- Data Acquisition: Acquire data at 10 Hz. Implement a 5-second moving average filter in real-time.
- Functional Paradigm: Execute a block design (e.g., 30s rest, 30s task, repeated 5x). Task example: controlled breathing or cognitive test.
- Post-Processing: Apply a physiological noise cancellation algorithm (e.g., using short-channel regression or principle component analysis). Convert intensity changes to concentration changes using the modified Beer-Lambert law with differential pathlength factors.
The Scientist's Toolkit
Table 4: Key Research Reagent Solutions for NIRS Redox Studies
| Item | Function & Rationale |
|---|---|
| Intralipid 20% | Industry-standard lipid emulsion used to create tissue-simulating phantoms, providing controlled, reproducible scattering properties (μs'). |
| India Ink / Nigrosin | Strong, broadband absorber used in phantom preparation to titrate the absorption coefficient (μa) to physiological levels (~0.01-0.02 mm⁻¹). |
| Purified Cytochrome c Oxidase | Essential for in-vitro calibration to derive the precise extinction coefficients (ε) of the oxidized and reduced enzyme under scattering conditions. |
| Lyophilized Human Hemoglobin | Provides stable, standardized samples of HbO₂ and HHb for system calibration and validation of hemoglobin concentration algorithms. |
| Silicone Elastomers (e.g., PDMS) | Used to fabricate solid, durable optical phantoms with embedded scattering (TiO₂) and absorbing (ink) particles for long-term system validation. |
| Optical Phantoms with Dynamic Features | Advanced phantoms containing microfluidic channels or switchable absorbers to simulate dynamic physiological processes like blood flow or oxygenation changes. |
| Blocking Cap/Black Cloth | Critical for eliminating ambient light, a major source of noise and signal artifact in NIRS measurements. |
Diagram 3: Integrated NIRS redox assessment workflow.
Near-infrared spectroscopy (NIRS) is a pivotal tool for non-invasive assessment of cerebral redox states, offering insights into metabolic health, oxidative stress, and drug efficacy. The core challenge, termed the "Layer Problem," is the contamination of the cerebral NIRS signal by absorption and scattering from superficial layers—the scalp, skull, and subcutaneous tissues. These extracerebral layers contain hemodynamically active tissues (skin, periosteum, muscle) that respond to systemic physiological changes, confounding the measurement of cerebral-specific redox-sensitive chromophores, primarily cytochrome-c-oxidase (CCO). Accurate isolation of the cerebral signal is thus fundamental to any thesis on reliable NIRS for redox state assessment in research and drug development.
The Nature of Contamination: Quantitative Analysis
The magnitude of signal contamination from extracerebral tissues is substantial. The table below summarizes key quantitative findings from recent studies on photon penetration and layer-specific contribution.
Table 1: Quantitative Overview of Scalp/Skin Contamination in NIRS Measurements
| Parameter | Typical Value / Finding | Measurement Technique | Implications for Redox Assessment |
|---|---|---|---|
| Photon Mean Pathlength in Scalp/Skull | 15-30% of total detected pathlength (at 30-40mm source-detector separation) | Time-Resolved NIRS, Monte Carlo Simulation | A significant portion of detected light never interrogates cerebral tissue. |
| Superficial Layer Contribution to Total Hb Signal | 50-70% under resting conditions | Spatially Resolved NIRS, Layer-Specific Algorithms | Systemic blood pressure, skin blood flow changes can dominate the total optical signal. |
| Cortical Penetration Depth (from scalp surface) | ~20-25 mm for reliable cortical measurement | MRI-NIRS Co-registration Studies | Requires optode distances >25-30mm, increasing signal ambiguity. |
| Superficial Layer Thickness (scalp + skull) | 10-18 mm (adults, variable by location) | Anatomical MRI Studies | A fixed, but highly variable, contaminating layer. |
| Temporal Correlation of Superficial vs. Deep Signals | High correlation (r > 0.7) during systemic challenges | Signal Processing (ICA, PCA) | Simple filtering based on assumed independence is insufficient. |
| CCO Oxidation State Sensitivity to Superficial Contamination | Highly sensitive; small Hb changes can obscure CCO redox shifts | Multi-wavelength, Broadband NIRS | Critical for redox studies; requires robust layer discrimination. |
Methodological Solutions: Experimental Protocols
Multi-Distance Spatially Resolved NIRS (SR-NIRS)
Purpose: To separate shallow and deep photon pathlengths based on the differential sensitivity of source-detector (S-D) separation distances. Protocol:
- Setup: Arrange multiple detectors at varying distances (e.g., 15mm, 25mm, 30mm, 35mm, 40mm) from a single source optode.
- Data Acquisition: Record continuous or frequency-domain NIRS data across all channels simultaneously. Use wavelengths targeting HbO₂, HHb, and CCO (e.g., 730nm, 810nm, 850nm, 940nm).
- Processing Model: Apply a two-layer diffusion model (superficial and deep). The short-distance channels (<20mm) are predominantly sensitive to the superficial layer. Their time-series data are used as regressors in a general linear model (GLM) to subtract the superficial contribution from the long-distance channels (>30mm).
- Output: Isolated time-series for cerebral Hb and CCO signals.
Time-Resolved NIRS (TR-NIRS) & Time-Domain Separation
Purpose: To discriminate layers based on the time-of-flight of photons. Protocol:
- Setup: Use a picosecond pulsed laser source and time-correlated single photon counting (TCSPC) detectors.
- Data Acquisition: Measure the temporal distribution of transmitted photons (the temporal point spread function, TPSF) at a single S-D pair (typically 30-40mm apart).
- Analysis: Fit the late-arriving photons (the "tail" of the TPSF). These photons have traveled deeper into the tissue. Alternatively, calculate the statistical moments of the TPSF (mean time of flight, variance), which are sensitive to absorption changes in deep versus shallow layers.
- Output: Depth-resolved absorption changes, providing a direct measurement of cerebral redox dynamics with minimized superficial contamination.
Signal Processing Techniques: Principal/Independent Component Analysis (PCA/ICA)
Purpose: To statistically separate signal components originating from different physiological sources (superficial vs. cerebral, cardiac, respiratory). Protocol:
- Setup: Acquire data from a high-density NIRS array with multiple overlapping S-D pairs.
- Data Matrix Construction: Create a data matrix X (channels × timepoints).
- Decomposition: Apply ICA (e.g., Infomax algorithm) to decompose X into independent components (ICs) and their spatial maps.
- Component Identification: Identify superficial components based on their spatial map topography (strong weighting on short-distance channels) and their temporal correlation with systemic physiological recordings (e.g., finger plethysmography for blood pressure).
- Signal Reconstruction: Reconstruct the cerebral signal by projecting the data onto only those ICs identified as cerebral in origin.
Visualizing the Workflow & Problem
Diagram Title: NIRS Layer Problem Solving Workflow
Diagram Title: Photon Paths: Superficial vs. Cerebral Penetration
The Scientist's Toolkit: Essential Research Reagent Solutions
Table 2: Key Reagents and Materials for Layer-Resolved Cerebral NIRS Studies
| Item / Solution | Function & Relevance | Example/Notes |
|---|---|---|
| High-Density NIRS Arrays | Enables spatial sampling for superficial signal regression and topographic mapping. | Commercially available systems (e.g., NIRx Aurora, Artinis Octamon, Gowerlabs HD-DOT). Flexible grids with >16 sources & detectors. |
| Time-Resolved NIRS System | Provides direct photon time-of-flight data for depth resolution. | Systems with pulsed lasers & TCSPC (e.g., Hamamatsu TRS-20, Timescope from PIONIRS). |
| Frequency-Domain NIRS System | Offers phase and amplitude data for calculating photon pathlength. | Systems like ISS Imagent. An alternative to TD-NIRS for pathlength measurement. |
| Co-registration Kit (MRI-compatible digitizer) | Anatomically maps optode positions to individual subject MRI for precise layer thickness estimation. | Polhemus or similar 3D digitizers with MRI-fiducial caps. Critical for accurate modeling. |
| Physiological Monitors | Records systemic signals (heart rate, blood pressure, respiration) to correlate and identify superficial components. | Finger plethysmograph (BP), ECG, capnograph. Essential for ICA/PCA component validation. |
| Optical Phantoms (Layered) | Calibrates and validates layer-separation algorithms. | Solid or liquid phantoms with known optical properties in 2-3 layers. |
| Hemodynamic Task Protocols | Generates dissociable cerebral vs. systemic responses for algorithm testing. | Breath-hold (couples cerebral/superficial), cognitive task (more cerebral), thigh cuff (systemic). |
| Open-Source Analysis Software (e.g., Homer3, NIRS Toolbox) | Provides standardized pipelines for processing, including PCA/ICA and GLM for superficial regression. | Allows reproducible implementation of methods like hmrR_ssr (short-channel regression). |
| Broadband NIRS Light Sources | Enhances specificity for CCO redox measurement alongside Hb. | White light sources coupled to spectrometers. Critical for the primary redox target. |
Within the broader thesis on advancing near-infrared spectroscopy (NIRS) for non-invasive redox state assessment, a critical methodological challenge persists: the translation of robust relative optical measurements into physiologically absolute concentration values. This whitepaper provides an in-depth technical guide to the core hurdles—including photon pathlength determination, tissue heterogeneity, and reference standards—and outlines experimental protocols for overcoming them to enable quantitative, absolute monitoring of redox biomarkers like cytochrome c oxidase and hemoglobin.
NIRS provides non-invasive, continuous monitoring of tissue oxygenation and mitochondrial redox state by measuring chromophore absorption in the 700-900 nm range. While relative changes (Δ[oxCCO], Δ[Hb]) are valuable for tracking trends, drug development and clinical translation require absolute values (μM or μmol/L). The core hurdles stem from the modified Beer-Lambert Law's dependency on the Differential Pathlength Factor (DPF), scattering effects, and the need for a stable baseline reference.
Core Quantification Hurdles and Technical Solutions
Hurdle 1: Photon Pathlength Determination
The modified Beer-Lambert Law for NIRS: ΔA = log(I₀/I) = ε * c * d * DPF + G Where ΔA is absorbance change, ε is extinction coefficient, c is concentration change, d is source-detector distance, DPF is differential pathlength factor, and G is scattering loss.
Table 1: Methods for Pathlength Determination & Their Parameters
| Method | Principle | Typical Accuracy/Precision | Key Limitations |
|---|---|---|---|
| Time-Resolved NIRS (TR-NIRS) | Measures temporal point spread function of picosecond light pulses. | DPF accuracy: ±5-10% in phantom studies. | Expensive, complex instrumentation. |
| Frequency-Domain NIRS (FD-NIRS) | Modulates light intensity at MHz frequencies to measure phase shift. | Phase shift precision: ±0.2°, yielding ~±7% DPF. | Calibration sensitive to source-detector coupling. |
| Spatially Resolved Spectroscopy (SRS) | Uses multiple detector distances to estimate reduced scattering coefficient (μs'). | Absolute [Hb] error: ~±15-20% in tissue. | Assumes homogeneous tissue geometry. |
Hurdle 2: Tissue Heterogeneity and Baseline Reference
Multi-layered tissue (skin, skull, CSF, brain) introduces wavelength-dependent, non-linear photon migration. Establishing a true "zero" concentration baseline for absolute calculation is non-trivial.
Table 2: Impact of Tissue Layers on NIRS Signal
| Tissue Layer | Typical Thickness | Optical Properties (at 800 nm) | Contribution to Total Attenuation |
|---|---|---|---|
| Scalp/Skin | 3-7 mm | High μa, anisotropic scattering. | 30-50% |
| Skull | 5-7 mm | Low μa, high scattering. | 20-35% |
| CSF | 1-2 mm | Very low μa, low scattering. | Can create light guiding effects. |
| Cerebral Cortex | Variable | μa ~0.02 mm⁻¹, μs' ~1.5 mm⁻¹. | Target region of interest. |
Hurdle 3: Chromophore Crosstalk
The absorption spectra of HbO₂, HHb, and oxidized CCO (CuA peak at 830 nm) overlap significantly. Absolute quantification requires robust spectral unmixing.
Table 3: Extinction Coefficients of Key Redox Chromophores (ε, mM⁻¹cm⁻¹)
| Chromophore | 750 nm | 800 nm | 830 nm | 870 nm |
|---|---|---|---|---|
| Oxyhemoglobin (HbO₂) | 0.83 | 0.87 | 0.85 | 0.78 |
| Deoxyhemoglobin (HHb) | 1.17 | 0.69 | 0.60 | 0.66 |
| Oxidized Cytochrome c Oxidase (oxCCO) | 0.03 | 0.04 | 0.05 | 0.03 |
| Reduced Cytochrome c Oxidase (redCCO) | ~0.02 | ~0.02 | ~0.01 | ~0.02 |
Detailed Experimental Protocols
Protocol A: Absolute Calibration Using Time-Resolved NIRS with Vascular Occlusion
Objective: To derive absolute concentrations of HbO₂, HHb, and total hemoglobin (tHb) in forearm muscle. Materials: TR-NIRS system (e.g., TRS-40, Hamamatsu), pneumatic occlusion cuff, pressure monitor, calibration phantom. Procedure:
- System Calibration: Measure a tissue-simulating phantom with known μa and μs' to verify DPF calculation from measured temporal dispersion.
- Subject Positioning: Secure NIRS optodes on the flexor digitorum profundus muscle with a 3 cm source-detector separation. Place occlusion cuff proximal.
- Baseline Acquisition: Acquire TR-NIRS data for 2 minutes at rest.
- Venous Occlusion: Inflate cuff to 50 mmHg (venous occlusion pressure) for 3 minutes, continuously acquiring data. This traps venous blood, increasing tHb, providing a known Δc for calibration.
- Arterial Occlusion: Release and re-inflate cuff to > systolic pressure (e.g., 220 mmHg) for 3 minutes. This creates a known anoxic state (HbO₂ → HHb).
- Data Processing: Fit measured temporal dispersion curves to derive μa(λ) at each time point. Use the known ΔtHb from venous occlusion to scale the absorption change to absolute concentration (c = ΔA / (ε * d * DPF)). Use the arterial occlusion trajectory to validate HbO₂/HHb unmixing.
Protocol B: Multi-Distance Frequency-Domain NIRS for Layer-Specific Redox Assessment
Objective: To separate superficial (scalp) and deep (cortical) contributions to the redox signal. Materials: FD-NIRS system with laser diodes at 690, 750, 790, 830 nm, and multiple detectors at distances of 1.0, 1.5, 2.0, 2.5, and 3.0 cm. Procedure:
- Optode Array Mounting: Arrange source and detectors in a linear array on the scalp over the prefrontal cortex.
- Dual-Layer Model Fitting: For each wavelength, simultaneously fit the measured AC amplitude and phase shift across all distances to a two-layer diffusion model. The top layer represents scalp/skull, and the bottom layer represents brain.
- Absolute Calculation: Extract μabrain(λ) for the bottom layer. Using the extinction coefficient matrix (Table 3), solve the linear equation: μabrain(λ) = εHbO₂(λ)*[HbO₂] + εHHb(λ)[HHb] + ε_oxCCO(λ)[oxCCO] + B (baseline). A multi-wavelength least-squares fit yields absolute concentrations.
Visualizing Pathways and Workflows
Title: Overcoming NIRS Hurdles from Relative to Absolute Quantification
Title: FD-NIRS Multi-Distance Workflow for Absolute Values
The Scientist's Toolkit: Research Reagent & Material Solutions
Table 4: Essential Materials for Advanced NIRS Quantification Experiments
| Item / Solution | Function & Rationale |
|---|---|
| Time-Resolved NIRS System (e.g., Hamamatsu TRS-40, NIRx NIRO) | Provides picosecond pulsed lasers and time-correlated single photon counting to directly measure photon time-of-flight and compute DPF. |
| Frequency-Domain NIRS System (e.g., ISS Imagent, TechEn CW7) | Uses intensity-modulated lasers and phase-sensitive detection to separate absorption and scattering coefficients optically. |
| Tissue-Simulating Phantoms (e.g., Intralipid suspensions, silicone with TiO₂ & ink) | Calibration standards with precisely known, stable optical properties (μa, μs') to validate system performance and pathlength algorithms. |
| Broadband White Light NIRS System (e.g., NIRx NIRSport2, OCT system) | Acquires continuous spectra (e.g., 650-950 nm) for enhanced spectral unmixing and reduced crosstalk error in absolute concentration calculation. |
| Co-registration Kit (3D digitizer, MRI-compatible optodes) | For aligning NIRS optode positions with anatomical (MRI) or functional (fMRI) images to inform tissue layer thickness and correct for heterogeneity. |
| Vascular Occlusion Cuff System | Provides a physiological calibration maneuver (as in Protocol A) to induce known changes in chromophore concentration for absolute scaling. |
| Specialized Analysis Software (e.g, NIRS-SPM, Homer2, in-house Monte Carlo code) | Implements light transport models, multi-layer fitting algorithms, and spectral unmixing routines to convert raw data to absolute values. |
Benchmarking NIRS: Validation Against Gold Standards and Comparative Analysis
Near-infrared spectroscopy (NIRS) is emerging as a transformative tool for non-invasive, real-time assessment of tissue redox state, primarily by measuring the oxidation-reduction status of cytochrome c oxidase (CCO) and deoxy-hemoglobin. The broader thesis of this research posits that NIRS can reliably replace or augment invasive biochemical assays for longitudinal redox monitoring in living tissues. Direct validation against the gold standard—biochemical analysis of tissue biopsies—is the critical step required to establish NIRS as a credible quantitative modality in fields from exercise physiology to drug development. This guide details the technical protocols and analytical frameworks for this essential correlation.
Core Quantitative Metrics: NIRS vs. Biochemical Assays
Table 1: Key Redox Metrics and Their Corresponding Measurement Modalities
| Redox Metric | NIRS Measurement Parameter | Corresponding Biochemical Assay (from Biopsy) | Typical Correlation Target (R²) |
|---|---|---|---|
| Mitochondrial Redox State | [oxCCO] / ([oxCCO]+[redCCO]) | Tissue [ATP]/[ADP] ratio or NAD⁺/NADH ratio via HPLC/Enzymatic Assay | >0.75 |
| Tissue Oxygenation | Tissue Oxygenation Index (TOI = [O₂Hb]/([O₂Hb]+[HHb])) | Tissue pO₂ via Clark electrode or hypoxyprobe staining quantification | >0.85 |
| Oxidative Stress Burden | Broadband NIRS slope (750-900 nm) | Tissue levels of lipid peroxides (MDA via TBARS) or protein carbonyls | >0.65 |
| Hemodynamic Coupling | HbT ([O₂Hb]+[HHb]) & HbDiff ([O₂Hb]-[HHb]) | Tissue blood volume & flow via microspheres or Doppler | >0.80 |
Experimental Protocol for Direct Correlation
Simultaneous NIRS Monitoring and Terminal Biopsy Harvest
Objective: To acquire spatially and temporally co-localized NIRS data and tissue for biochemical analysis.
Materials & Setup:
- NIRS System: A frequency-domain or broadband system with source-detector separations for desired penetration depth (e.g., 3 cm).
- Animal/Human Model: Prepped for study (e.g., limb ischemia model, muscle exercise).
- Biopsy Tools: Rapid-freeze clamps (pre-cooled in liquid N₂) or punch biopsy tools.
Procedure:
- Securely attach the NIRS probe to the target tissue region (e.g., vastus lateralis muscle).
- Initiate continuous NIRS recording. Monitor parameters: [oxCCO], [HHb], [O₂Hb].
- At the precise experimental time point of interest (e.g., peak exercise, post-drug infusion), immediately perform a percutaneous needle biopsy or surgical biopsy adjacent to the NIRS probe's optical path.
- Within <2 seconds, snap-freeze the biopsy sample in liquid nitrogen.
- Store at -80°C until biochemical assay.
Biochemical Assay Protocols for Redox Biomarkers
A. Mitochondrial Metabolite Extraction & HPLC Analysis (for ATP/ADP/AMP)
- Homogenize: Under liquid N₂, pulverize tissue. Homogenize in 0.4M HClO₄.
- Neutralize: Centrifuge. Neutralize supernatant with 2M KOH/0.5M triethanolamine.
- Analyze: Inject into reverse-phase HPLC system. Detect nucleotides at 254 nm.
- Calculate: [ATP]/[ADP] and Energy Charge = ([ATP]+0.5[ADP])/([ATP]+[ADP]+[AMP]).
B. NAD⁺/NADH Quantification (Enzymatic Cycling Assay)
- Dual Extraction: Split pulverized tissue. Extract NAD⁺ in acidic buffer, NADH in basic buffer (60°C).
- Reaction: In a 96-well plate, mix extract with cycling reagent (ethanol, ADH, MTT, PES).
- Read: Monitor formazan formation at 570 nm over 10 minutes.
- Calculate: Ratio from standard curves.
C. Lipid Peroxidation (TBARS Assay for Malondialdehyde - MDA)
- Homogenize: In butylated hydroxytoluene (BHT) and EDTA-containing buffer.
- React: Mix homogenate with thiobarbituric acid (TBA) reagent. Heat at 95°C for 60 min.
- Read: Measure fluorescence (Ex: 532 nm / Em: 553 nm) or absorbance at 532 nm.
- Calculate: MDA equivalents from standard curve.
Data Analysis & Correlation Strategy
Table 2: Statistical Correlation Framework
| Data Pair | NIRS Variable | Biochemical Variable | Statistical Model | Validation Success Criterion |
|---|---|---|---|---|
| Primary Correlation | Normalized [oxCCO] signal | Tissue [ATP]/[ADP] Ratio | Linear Mixed-Effects Model | p < 0.01, R² > 0.70 |
| Secondary Correlation | NIRS-derived TOI (%) | Tissue pO₂ (mmHg) | Bland-Altman & Pearson Correlation | Bias < 5%, Limits of Agreement ±10% |
| Tertiary Correlation | NIRS slope (760-850 nm) | [MDA] (nmol/g tissue) | Spearman's Rank Correlation | ρ > 0.65, p < 0.05 |
Visualizing the Validation Workflow and Redox Pathways
Title: NIRS-Biopsy Correlation Workflow for Redox Validation
Title: Core Redox Pathway Measured by NIRS and Biopsy
The Scientist's Toolkit: Research Reagent Solutions
Table 3: Essential Reagents and Materials for Correlation Studies
| Item / Kit Name | Supplier Examples | Primary Function in Validation |
|---|---|---|
| Rapid Freeze Clamps (e.g., Wollenberger Clamp) | TA Instruments, Custom Lab Suppliers | Instantaneous tissue fixation to preserve in vivo metabolic state at biopsy moment. |
| NAD/NADH-Glo Assay | Promega | Luminescent quantification of total, NAD⁺, and NADH from tissue lysates. |
| ATP Colorimetric/Fluorometric Assay Kit | BioVision, Abcam | Quantifies ATP, ADP, AMP levels for energy charge calculation. |
| Lipid Peroxidation (MDA) Assay Kit | Sigma-Aldrich, Cayman Chemical | Colorimetric/Fluorometric detection of TBARS, primarily malondialdehyde (MDA). |
| Hypoxyprobe-1 (Pimonidazole HCl) | Hypoxyprobe, Inc. | Immunohistochemical marker for tissue hypoxia; correlates with NIRS [HHb]. |
| Stable Isotope Standards for LC-MS (¹³C-ATP, D₈-NADH) | Cambridge Isotope Labs | Enables absolute, precise quantification via mass spectrometry. |
| Broadband NIRS Calibration Phantom (e.g., TiO₂ & Ink in Epoxy) | Custom Fabrication, INO | Provides known absorption/scattering for system validation pre-experiment. |
| Ultrasound Gel (MRI-Compatible) | Parker Laboratories | Optical coupling medium for NIRS probe; ensures signal fidelity. |
Within the broader thesis on Near-Infrared Spectroscopy (NIRS) for non-invasive redox state assessment, validating NIRS-derived metrics against established neuroimaging modalities is paramount. This whitepaper provides an in-depth technical analysis of the correlations between NIRS signals and those from Positron Emission Tomography (PET using FDG and O-15 tracers), functional Magnetic Resonance Imaging (fMRI/BOLD), and Magnetic Resonance Spectroscopy (MRS). Understanding these cross-modal relationships is critical for establishing NIRS as a reliable, bedside tool for monitoring cerebral metabolism and redox states in drug development and clinical research.
Core Principles and Signal Origins
- NIRS: Measures concentration changes of oxygenated (Δ[HbO]), deoxygenated (Δ[Hb]), and total hemoglobin (Δ[HbT]) in the superficial cortex via light absorption (650-950 nm). The redox-sensitive cytochrome-c-oxidase (CCO) signal can also be measured, providing a direct metric of mitochondrial metabolism.
- PET (FDG): Quantifies the cerebral metabolic rate of glucose (CMRglc) using the radiotracer [¹⁸F]Fluorodeoxyglucose (FDG), a glucose analog.
- PET (O-15): Uses [¹⁵O]water to measure cerebral blood flow (CBF) and [¹⁵O]oxygen to measure the cerebral metabolic rate of oxygen (CMRO₂).
- fMRI (BOLD): Detects changes in blood oxygenation level-dependent (BOLD) signal, a complex interplay of CBF, cerebral blood volume (CBV), and CMRO₂.
- MRS: Quantifies the concentration of specific neurochemicals (e.g., lactate, N-acetylaspartate) non-invasively. Lactate levels are of particular interest for redox and metabolic state assessment.
| NIRS Parameter | Correlated Modality (Parameter) | Typical Correlation Coefficient (r) / Finding | Context & Notes |
|---|---|---|---|
| Δ[HbO] | fMRI (BOLD) | 0.70 - 0.95 | Strong spatial and temporal correlation during functional activation; HbO is a primary contributor to BOLD. |
| Δ[Hb] | fMRI (BOLD) | -0.50 - -0.80 | Inverse correlation with BOLD signal. |
| Δ[HbT] / CBFNIRS | PET O-15 (CBF) | 0.65 - 0.85 | Good agreement in relative flow changes. Absolute quantification remains challenging for NIRS. |
| CCO ΔOxidation | PET O-15 (CMRO₂) | 0.60 - 0.80 | CCO signal correlates with oxidative metabolism. Key for redox thesis. |
| Δ[HbO] / Δ[Hb] (TOI) | PET FDG (CMRglc) | 0.50 - 0.70 (moderate) | Tissue Oxygenation Index (TOI) shows moderate correlation with glucose metabolism. |
| NIRS Lactate Index* | MRS (Lactate) | Requires more data | Emerging research; combined NIRS-MRS probes show promise for concurrent redox & metabolic monitoring. |
*Derived from specific spectral analysis or combined with broadband NIRS.
Table 2: Strengths, Limitations, and Spatial/Temporal Resolution
| Modality | Key Measured Parameter(s) | Spatial Resolution | Temporal Resolution | Primary Strengths | Primary Limitations |
|---|---|---|---|---|---|
| NIRS | Δ[HbO], Δ[Hb], Δ[CCO] | ~1-3 cm (depth-limited) | 0.1 - 10 Hz | Portable, low-cost, direct CCO/redox, bedside monitoring. | Superficial cortex only, partial volume effect, lacks anatomical detail. |
| PET (FDG) | CMRglc | 4-5 mm | 30-60 min (static) | Gold standard for glucose metabolism, whole-brain quantitative. | Ionizing radiation, low temporal resolution, costly cyclotron needed. |
| PET (O-15) | CBF, CMRO₂, CBV | 5-7 mm | ~1 min (dynamic) | Gold standard for CBF and CMRO₂, quantitative. | Very short half-life (2 min), requires on-site cyclotron, radiation. |
| fMRI (BOLD) | Blood oxygenation/deoxy | 1-3 mm | 0.5 - 2 sec | Excellent spatial resolution, whole-brain coverage, no radiation. | Indirect, complex physiology, sensitive to artifacts, expensive. |
| MRS | Lactate, NAA, etc. | ~1-10 cm³ (voxel) | 5-20 min | Direct measurement of specific neurochemicals, unique metabolic info. | Very low spatial/temporal resolution, low signal-to-noise for some metabolites. |
Experimental Protocols for Cross-Validation
Protocol 1: Simultaneous NIRS-fMRI Acquisition for BOLD Correlation
- Setup: Place MRI-compatible NIRS optodes on the subject's scalp over the region of interest (e.g., motor cortex, visual cortex). Secure with a flexible cap and ensure no metal components.
- Co-registration: Use fiduciary markers visible in both MRI and via 3D digitization (or photogrammetry) to later align NIRS channels to anatomical MRI.
- Task Paradigm: Implement a block-design (e.g., 30s rest, 30s finger tapping) or event-related paradigm.
- Simultaneous Acquisition: Acquire fMRI BOLD data (e.g., EPI sequence, TR=2s) concurrently with dual-wavelength or broadband NIRS data (sampling rate ≥10 Hz).
- Analysis: Preprocess NIRS (filtering, motion correction). Convert optical density to concentration changes. Extract mean time courses from NIRS channels and corresponding fMRI voxel time courses. Perform cross-correlation or general linear model (GLM) analysis to compute correlation coefficients.
Protocol 2: NIRS-PET (O-15) for CBF/CMRO₂ Validation
- Setup: Place NIRS optodes on the subject prior to entering the PET scanner.
- Baseline Scan: Acquire a 2-minute resting-state NIRS recording.
- PET Acquisition: Administer [¹⁵O]water bolus intravenously. Initiate dynamic PET scan (e.g., 90s) to measure CBF. After radioactivity decay, administer [¹⁵O]oxygen gas or injection for CMRO₂ scan.
- Post-PET NIRS: Continue or repeat resting-state NIRS post-scan.
- Analysis: Reconstruct PET images to generate quantitative CBF and CMRO₂ maps. Co-register NIRS probe geometry to the individual's PET/MRI anatomy. Compute average CBF/CMRO₂ within the underlying cortical volume sampled by each NIRS channel. Correlate with NIRS-derived hemodynamic (Δ[HbT], Δ[HbO]) and CCO oxidation signals during the resting periods.
Protocol 3: Combined NIRS-MRS for Metabolic Redox Assessment
- Setup: In an MRI scanner, position a specialized NIRS probe inside the head coil, targeting the same volume as the planned MRS voxel (e.g., prefrontal cortex).
- Anatomical Localization: Acquire a high-resolution T1-weighted image. Position the MRS voxel (e.g., 2x2x2 cm³).
- Concurrent Acquisition: First, acquire PRESS or SPECIAL MRS sequence for lactate detection (TE~144 ms). Simultaneously or interleaved, acquire continuous-wave or frequency-domain NIRS data.
- Metabolic Challenge: Optionally, administer a physiological challenge (e.g., hypercapnia, cognitive task, drug infusion) to perturb metabolism and acquire repeated MRS/NIRS measurements.
- Analysis: Quantify MRS lactate peaks relative to a reference (e.g., Cr or water). Correlate lactate concentration with NIRS-derived measures: tissue saturation (StO₂), HbO/Hb ratio, and especially the oxidation state of CCO from broadband NIRS.
Visualizations
Diagram 1: Neurovascular & Metabolic Coupling Pathways
Diagram 2: Multi-Modal Experimental Validation Workflow
The Scientist's Toolkit: Key Research Reagent Solutions
| Item / Solution | Function in Cross-Modal Research | Example / Notes |
|---|---|---|
| MRI-Compatible NIRS Probes | Allows safe, simultaneous data acquisition inside MRI/PET-MR scanners without causing artifacts or safety hazards. | Fiber-optic bundles with non-magnetic connectors and blackened, non-conductive housing. |
| 3D Digitizer System (e.g., Polhemus) | Precisely records the 3D locations of NIRS optodes relative to cranial landmarks for accurate co-registration with MRI/PET anatomy. | Essential for mapping NIRS channels to Brodmann areas or anatomical regions. |
| Broadband NIRS Systems | Measures the oxidation state of cytochrome-c-oxidase (CCO) in addition to HbO/Hb, providing a direct link to mitochondrial redox and CMRO₂. | Systems covering 650-900+ nm; critical for the redox assessment thesis. |
| Physiological Monitoring Kit | Synchronizes NIRS/PET/fMRI data with systemic physiological states (e.g., blood pressure, end-tidal CO₂, heart rate). | Integrated systems (e.g., BIOPAC) for timestamped, multi-parameter recording. |
| [¹⁵O]Water & [¹⁵O]O₂ | PET radiotracers for the gold-standard measurement of CBF and CMRO₂, respectively, against which NIRS is validated. | Requires an on-site cyclotron due to very short half-life (2 min). |
| [¹⁸F]FDG | PET radiotracer for measuring the cerebral metabolic rate of glucose (CMRglc). | Correlated with NIRS hemodynamic and tissue oxygenation indices. |
| Spectral Analysis Software (e.g., NIRS-SPM, Homer2, in-house) | Processes raw NIRS data (filtering, motion correction, MBLL) and performs advanced statistical correlation with other modalities. | Must support import of external timing/trigger signals from PET/MRI. |
| Hypercapnic Gas Mixture (e.g., 5% CO₂, 21% O₂, balance N₂) | A well-controlled physiological challenge to perturb CBF and metabolism, testing the coupling relationships across modalities. | Administered via a gas blender and non-rebreathing mask. |
Within the context of advancing non-invasive redox state assessment, selecting the appropriate neuroimaging or high-resolution technique is critical. This guide provides a comparative analysis of Near-Infrared Spectroscopy (NIRS), Positron Emission Tomography (PET), Functional Magnetic Resonance Imaging (fMRI), and Optical Microscopy, focusing on their technical specifications, applications in metabolic and redox research, and suitability for longitudinal studies in drug development.
Comparative Technical Specifications
Table 1: Core Performance Metrics
| Metric | NIRS (fNIRS) | PET (FDG) | fMRI (BOLD) | Optical Microscopy (2-Photon) |
|---|---|---|---|---|
| Spatial Resolution | 1-3 cm (cortex) | 4-5 mm | 1-3 mm | 1-10 µm |
| Temporal Resolution | 0.1-1.0 s | 30 s - minutes | 1-3 s | milliseconds - seconds |
| Penetration Depth | 2-3 cm (cortex) | Whole body | Whole brain | ~1 mm (in vivo) |
| Primary Measurand | HbO2, HbR, Cytochrome oxidase | Radiotracer uptake (e.g., FDG, [¹⁸F]FESP) | Blood oxygenation (BOLD) | Fluorescence, absorbance |
| Invasiveness | Non-invasive | Minimally invasive (radio-ligand injection) | Non-invasive | Varies (often invasive for in vivo) |
| Cost per Session | $ | $$$$ | $$ | $$-$$$ |
| Portability | High (wearable systems) | Low | Low | Moderate |
| Key Redox Application | Cytochrome-c-oxidase redox state | Metabolic consumption (indirect) | Oxygenation (indirect proxy) | Genetically encoded redox biosensors |
Table 2: Suitability for Research Applications
| Application | NIRS | PET | fMRI | Optical Microscopy |
|---|---|---|---|---|
| Longitudinal Redox Monitoring | Excellent | Poor (radiation limit) | Good | Excellent (in animal models) |
| Pharmacodynamic Studies | Good | Excellent (receptor occupancy) | Good | Excellent (cellular level) |
| Whole-Brain Mapping | Limited (cortical) | Excellent | Excellent | Not applicable |
| Cellular Redox Resolution | No | No | No | Excellent |
| Bedside/Point-of-Care | Excellent | No | No | No |
| Quantitative Metabolic Rate | Indirect (relative) | Direct (absolute) | Indirect | Possible (with biosensors) |
Experimental Protocols for Key Methodologies
Protocol 1: NIRS for Cytochrome-c-Oxidase (CCO) Redox State Assessment
Objective: To non-invasively measure the redox state of CCO, a key mitochondrial enzyme, in the human prefrontal cortex during cognitive task.
- Subject Preparation: Position subject in a comfortable chair. Clean scalp area. Affix a high-density NIRS cap (e.g., 32 sources, 32 detectors) over the region of interest (e.g., dorsolateral PFC).
- System Calibration: Perform dark current measurement. Calibrate intensity using a phantom with known optical properties.
- Baseline Recording: Record 5 minutes of resting-state data in a dim, quiet room. Instruct subject to relax with eyes open.
- Task Paradigm: Implement a block-design working memory task (e.g., n-back). Task blocks (30s) alternate with rest blocks (30s) for 10 minutes.
- Data Acquisition: Use a continuous-wave or frequency-domain NIRS system operating at multiple wavelengths (e.g., 730 nm, 810 nm, 850 nm) to discriminate hemoglobin and CCO signals. Sampling rate: 10 Hz.
- Signal Processing: Apply band-pass filter (0.01-0.5 Hz) to remove drift and heart rate artifact. Convert light attenuation changes to concentration changes using the modified Beer-Lambert law with a multi-wavelength algorithm for CCO separation.
- Analysis: Average CCO concentration changes across trials and subjects. Statistically compare task vs. baseline periods.
Protocol 2: PET for Cerebral Metabolic Rate of Glucose (CMRglu)
Objective: To quantify regional glucose metabolism as an indirect measure of redox-driven cellular activity.
- Radiotracer Synthesis: Synthesize [¹⁸F]Fluorodeoxyglucose (FDG) via nucleophilic substitution. Ensure radiochemical purity >95%.
- Subject Preparation: Insert intravenous catheter. Position subject in a darkened, quiet room for 30 minutes pre-injection to minimize brain activation.
- Tracer Injection & Uptake: Inject 185-370 MBq of FDG intravenously as a bolus. Allow a 30-minute uptake period with the subject remaining at rest.
- Scan Acquisition: Position subject in PET/CT scanner. Acquire a low-dose CT scan for attenuation correction. Perform a 10-minute static emission scan of the brain.
- Image Reconstruction: Reconstruct images using an iterative algorithm (e.g., OSEM). Correct for attenuation, scatter, and radioactive decay.
- Quantification: Calculate Standardized Uptake Value (SUV) or use kinetic modeling (e.g., Patlak plot) with an arterial input function to derive absolute CMRglu in µmol/100g/min.
Visualized Workflows
Title: NIRS-CCO Redox Assessment Protocol
Title: Spatial Scale of Imaging Modalities
The Scientist's Toolkit: Key Reagent Solutions for Redox Imaging
Table 3: Essential Research Materials
| Item | Function | Example Application |
|---|---|---|
| Genetically Encoded Redox Biosensors (e.g., roGFP, Grx1-roGFP2) | Real-time, rationetric measurement of specific cellular redox potentials (e.g., GSH/GSSG). | Optical microscopy for intracellular redox state dynamics in vitro or in vivo (animal models). |
| ¹⁸F-labeled Radiotracers (e.g., [¹⁸F]FESP, [¹⁸F]FDG) | PET ligands targeting specific receptors or metabolic processes. Indirectly inform on redox-related pathways. | PET imaging of dopamine D2/D3 receptor occupancy (relevant to oxidative stress in neuropsychiatry). |
| NIRS Multi-Wavelength Calibration Phantom | Tissue-simulating solid or liquid phantom with known absorption (µa) and scattering (µs') coefficients. | Calibrating NIRS devices for accurate quantification of chromophore concentration changes. |
| Paramagnetic Contrast Agents (e.g., Gd-DTPA) | Shorten T1 relaxation time in MRI/fMRI. Can be used in perfusion studies. | Dynamic contrast-enhanced (DCE) MRI to assess blood-brain barrier integrity under oxidative stress. |
| Tethered Enzyme Assays (for ex vivo validation) | Biochemical assays to validate imaging findings (e.g., complex IV activity, lipid peroxidation). | Correlating NIRS-derived CCO signals with post-mortem tissue enzymatic activity in animal studies. |
Case Studies of Successful Validation in Animal Models and Human Subjects
Within the thesis on Near-Infrared Spectroscopy (NIRS) for non-invasive redox state assessment, this guide examines critical validation case studies. Successful translation from animal models to human application is the cornerstone of therapeutic and diagnostic development. NIRS, as a modality for quantifying chromophores like cytochrome c oxidase (CCO) and hemoglobin, provides a unique window into tissue oxygenation and mitochondrial redox state, bridging preclinical and clinical research.
Case Study 1: Validation of NIRS-Based Cerebral Oxygenation Monitoring in Neonatal Encephalopathy
Objective: To validate the correlation between NIRS-derived cerebral oxygenation metrics and direct biochemical measures of cerebral energy failure and redox imbalance in a preclinical model, leading to successful human clinical application.
Preclinical Animal Model (Hypoxic-Ischemic Piglet Model):
- Experimental Protocol:
- Subject & Induction: 2-4 day old piglets underwent transient bilateral carotid artery occlusion and exposure to hypoxia (12% O2) to induce global cerebral hypoxic-ischemic (HI) injury.
- NIRS Monitoring: A frequency-domain NIRS system was positioned over the parietal skull. Continuous measurements of tissue oxygenation index (TOI), oxidized CCO concentration ([oxCCO]), and total hemoglobin were recorded before, during, and for 24-48 hours post-HI.
- Terminal Validation: At designated time points, brains were rapidly frozen in situ. High-performance liquid chromatography (HPLC) was performed on brain tissue extracts to quantify concentrations of phosphocreatine (PCr), ATP, inorganic phosphate (Pi), and lactate—direct measures of the phosphorylation potential and redox state (via lactate/pyruvate ratio).
- Correlative Analysis: Multivariate linear regression was used to correlate NIRS-derived [oxCCO] and TOI with the biochemical markers of energy charge ([ATP]/[ADP]) and cellular redox.
- Key Quantitative Data:
Table 1: Correlation of NIRS Parameters with Biochemical Markers in HI Piglet Brain
| NIRS Parameter | Biochemical Marker (HPLC) | Correlation Coefficient (r) | p-value | Key Finding |
|---|---|---|---|---|
| Δ[oxCCO] | Δ[PCr]/[Pi] (Energy Charge) | 0.87 | <0.001 | Strong positive correlation. A drop in [oxCCO] precedes the fall in PCr/Pi. |
| Tissue Oxygenation Index (TOI) | Tissue Lactate/Pyruvate Ratio | -0.79 | <0.001 | Strong negative correlation. Low TOI predicts high lactate (anaerobic metabolism). |
| Hb Difference (HbD = HbO2 - HHb) | ATP Concentration | 0.71 | <0.005 | Moderate positive correlation. Cerebral oxygen delivery linked to ATP levels. |
Translation to Human Subjects (NEonatal Brain injury cohort - NEBO):
- Clinical Protocol:
- Cohort: Term neonates with moderate-to-severe hypoxic-ischemic encephalopathy (HIE) undergoing therapeutic hypothermia.
- Monitoring: A broadband NIRS system, validated against the piglet model, was used to measure cerebral [oxCCO] and TOI continuously for up to 72 hours.
- Outcome Measures: Primary outcome was severe neurodevelopmental impairment (NDI) or death at 18-24 months, assessed using the Bayley Scales of Infant Development.
- Validation: The NIRS-derived "CCO recovery slope" in the first 6 hours of cooling was identified as a predictive biomarker. Its prognostic accuracy (AUC-ROC) was calculated against the clinical outcome.
- Key Quantitative Data:
Table 2: Prognostic Value of NIRS [oxCCO] in Neonatal HIE
| Biomarker | Time Window | AUC-ROC for Severe NDI/Death | Sensitivity | Specificity | Clinical Impact |
|---|---|---|---|---|---|
| [oxCCO] Recovery Slope | 0-6 hours post-cooling | 0.92 (0.85-0.98) | 88% | 91% | Outperformed amplitude-integrated EEG (aEEG) for early prognostication. |
| Minimum TOI | During Cooling | 0.78 (0.67-0.89) | 75% | 80% | Supported utility for monitoring oxygenation adequacy. |
Title: Validation Pathway: NIRS for Neonatal Brain Injury
Case Study 2: Validation of Muscle Redox Assessment in Duchenne Muscular Dystrophy (DMD)
Objective: To validate NIRS-measured muscle reoxygenation kinetics as a non-invasive biomarker of mitochondrial dysfunction and redox dysregulation in the mdx mouse model, and its subsequent application in human DMD trials.
Preclinical Animal Model (mdx Mouse):
- Experimental Protocol:
- Subjects: mdx mice (DMD model) and wild-type (WT) controls, aged 8-12 weeks.
- NIRS Exercise Challenge: Mice were anesthetized. The hindlimb was immobilized. A continuous-wave NIRS probe was placed over the gastrocnemius muscle.
- Ischemia-Reperfusion Protocol: A pneumatic cuff proximal to the limb was inflated to suprasystolic pressure to induce total ischemia (typically 3-5 minutes). NIRS measured deoxygenated hemoglobin (HHb) accumulation. Upon cuff release, the recovery kinetics of tissue saturation index (TSI) were recorded for 3 minutes.
- Ex Vivo Validation: Immediately post-NIRS, muscles were harvested. Mitochondrial respiration (O2 consumption rate, OCR) was measured via high-resolution respirometry (Oroboros O2k) using substrates for Complex I and II. Reactive oxygen species (ROS) emission was quantified fluorometrically.
- Analysis: The half-time of reoxygenation (T1/2) from the NIRS trace was correlated with mitochondrial OCR and ROS emission.
- Key Quantitative Data:
Table 3: Muscle Redox Metrics in mdx vs. Wild-Type Mice
| Parameter | Wild-Type Mice | mdx Mice | p-value | Biological Implication |
|---|---|---|---|---|
| NIRS Reoxygenation T1/2 (s) | 22.5 ± 4.1 | 45.8 ± 9.7 | <0.0001 | Slower reoxygenation indicates impaired microvascular/ mitochondrial function. |
| Mitochondrial OCR (pmol O2/s/mg) | 120 ± 15 | 68 ± 22 | <0.001 | Confirms underlying mitochondrial deficit. |
| ROS Emission (Fluor. Units) | 100 ± 20 | 250 ± 45 | <0.0001 | Validates NIRS metric associates with redox stress. |
| Correlation (T1/2 vs. OCR) | r = -0.82 | <0.005 | Slower recovery correlates with worse mitochondrial function. |
Translation to Human Subjects (DMD Clinical Trial):
- Clinical Protocol:
- Cohort: Ambulatory boys with DMD and age-matched healthy controls.
- NIRS Protocol: A portable NIRS device was placed on the tibialis anterior muscle. Participants performed a standardized mild plantar flexion exercise to induce metabolic demand, followed by a seated rest period.
- Primary Metric: The recovery rate of muscle oxygen saturation (SmO2) after exercise cessation, expressed as the time constant (τ) from a mono-exponential fit.
- Validation & Outcome: The recovery τ was compared between DMD and controls. In the DMD cohort, it was correlated with the 6-minute walk test (6MWT) distance and serum creatine kinase (CK) levels as part of a multi-center trial for a mitochondrial-targeted therapy.
- Key Quantitative Data:
Table 4: NIRS Muscle Recovery in DMD Patients vs. Controls
| Cohort | NIRS Recovery τ (s) | 6MWT Distance (m) | Correlation (τ vs 6MWT) |
|---|---|---|---|
| Healthy Controls (n=20) | 28.3 ± 6.5 | 530 ± 45 | Not Applicable |
| DMD Patients (n=35) | 52.7 ± 18.4 | 320 ± 112 | r = -0.65, p<0.001 |
| Treatment Effect (Placebo vs. Drug): | Δτ = -8.4 s (p=0.03) | Δ6MWT = +22 m (p=0.09) | Supports NIRS as a sensitive pharmacodynamic biomarker. |
Title: DMD Redox Assessment: Mouse to Human Translation
The Scientist's Toolkit: Key Research Reagent Solutions
Table 5: Essential Materials for NIRS Redox Validation Studies
| Item / Solution | Function / Application | Example & Notes |
|---|---|---|
| Broadband NIRS Systems | Measures multiple chromophores simultaneously, enabling specific [oxCCO] quantification. Essential for redox assessment. | ISS OxiplexTS, UCL Broadband System. Requires careful spectral fitting algorithms. |
| Continuous-Wave (CW) NIRS Devices | Robust, portable devices for measuring relative changes in HbO2/HHb and tissue saturation. Ideal for exercise/clinical studies. | Artinis Portalite, NIRO-200NX. Used for muscle recovery kinetics and neonatal TOI monitoring. |
| High-Resolution Respirometry System | Gold-standard ex vivo validation of mitochondrial function. Measures OCR and ROS. | Oroboros O2k. Provides direct correlation for NIRS-derived redox metrics. |
| HPLC Assay Kits | For validating energy/redox state via metabolite quantification (ATP, PCr, lactate, etc.) in tissue biopsies. | BioVision ATP Assay Kit, Abcam Lactate Assay Kit. Requires rapid tissue freezing (LN2). |
| Animal Disease Models | Genetically or surgically modified subjects that replicate human disease pathophysiology. | mdx mice (DMD), HI piglet model. Critical for establishing biomarker relevance. |
| Standardized Exercise/Ischemia Protocols | Provocative challenges to stress the redox system and reveal deficits in recovery kinetics. | Cuff occlusion systems, metronome-paced exercise. Must be consistent across subjects. |
| Spectral Analysis & Fitting Software | Converts raw NIRS light attenuation into chromophore concentrations using modified Beer-Lambert law. | HomER2 (MATLAB), Native manufacturer software. Custom modeling often required for [oxCCO]. |
Within the context of non-invasive redox state assessment, Near-Infrared Spectroscopy (NIRS) has evolved into a critical tool for monitoring tissue oxygenation and hemodynamics. This technical guide outlines the current consensus on reliable NIRS measurements, identifies persistent gaps, and provides detailed experimental frameworks. The focus is on translating spectroscopic data into physiologically relevant redox indicators for research and therapeutic development.
NIRS utilizes the optical window (700-900 nm) where hemoglobin, myoglobin, and cytochrome c oxidase (CCO) have distinct absorption spectra. The non-invasive nature of NIRS makes it ideal for longitudinal studies in redox biology, offering insights into tissue oxygen utilization and mitochondrial function. This whitepaper frames its discussion within the thesis that NIRS is a necessary but incomplete tool for comprehensive redox assessment, requiring multi-modal validation.
Consensus on Reliable NIRS Measurements
The scientific community agrees on the reliability of NIRS for specific, relative physiological trends under controlled conditions. The following table summarizes quantitatively reliable measures.
Table 1: Reliable NIRS Measurements and Their Parameters
| Measurement | Physiological Target | Typical Wavelengths (nm) | Reliability Consensus | Key Limitation |
|---|---|---|---|---|
| Tissue Oxygenation Index (TOI) or rSO₂ | Oxygenated vs. Deoxygenated Hemoglobin | 730, 810, 850 | High for relative trend monitoring in muscle/brain. | Absolute values vary with device & geometry. |
| Hemoglobin Concentration Changes (Δ[HbO₂], Δ[HHb]) | Cerebral/Muscular Hemodynamics | 760, 850 | High for task-evoked relative changes (e.g., neuroimaging). | Pathlength scaling is uncertain; absolute concentration difficult. |
| Tissue Hemoglobin Index (THI) | Blood Volume Changes | Multi-wavelength (e.g., 760-850) | Moderate for relative blood volume trends. | Confounded by venous/arterial compartmentalization. |
| Cytochrome c oxidase Redox State (Δ[CCO]) | Mitochondrial Respiration | 780-900 (3rd derivative) | Moderate for controlled hypoxia/ischemia models. | Low signal-to-noise; heavily model-dependent. |
Detailed Experimental Protocol for Key Measurement
This protocol outlines the measurement of task-evoked hemodynamic responses in cerebral cortex, a gold-standard NIRS application.
Protocol: Functional NIRS (fNIRS) for Prefrontal Cortex Activation
Objective: To reliably measure Δ[HbO₂] and Δ[HHb] during a cognitive task.
- Subject Preparation: Position subject comfortably. Measure head circumference. Clean scalp at electrode positions (FP1, FP2, F3, F4 per 10-20 system).
- Probe Placement & Configuration: Use a continuous-wave NIRS system. Arrange sources and detectors to create channels over the dorsolateral prefrontal cortex. Source-detector distance must be 3.0 cm.
- Baseline Recording: Record a 5-minute resting-state baseline with eyes open, fixed on a cross.
- Stimulus Paradigm: Implement a block-design (e.g., 30s Stroop task alternating with 30s rest, repeated 5 times).
- Data Acquisition: Sample at ≥10 Hz. Record triggers synchronizing task onset with NIRS data.
- Preprocessing (Essential Steps):
- Apply a band-pass filter (0.01-0.2 Hz) to remove drift and cardiac pulsation.
- Detect and correct motion artifacts using wavelet or moving standard deviation methods.
- Convert optical density changes to concentration changes using the Modified Beer-Lambert Law with a constant Differential Pathlength Factor (DPF ~6).
- Analysis: Average task blocks per channel. The consensus reliable outcome is the statistically significant increase in Δ[HbO₂] (and often decrease in Δ[HHb]) during task vs. rest.
Signaling Pathways and Physiological Interpretation
NIRS signals integrate complex physiological processes. The pathway below contextualizes the measured optical changes.
dot NIRS Signal Physiological Pathway
Diagram Title: Neurovascular Coupling Underlying fNIRS Signal
The Scientist's Toolkit: Essential Research Reagents & Materials
Table 2: Key Reagent Solutions and Materials for NIRS Redox Research
| Item | Function in NIRS Research | Example/Note |
|---|---|---|
| Continuous-Wave NIRS System (e.g., NIRO, OxiplexTS) | Primary data acquisition device for relative concentration changes. | NIRO-200NX provides multi-distance measurements. |
| Frequency-Domain or Time-Resolved NIRS System | Provides absolute quantification and pathlength measurement. | Critical for closing the "absolute quantification" gap. |
| Spectroscopic Calibration Phantom | Validates system performance and algorithm accuracy. | Solid phantoms with known scattering/absorption. |
| Anatomical Co-registration Kit (e.g., 3D digitizer) | Co-registers NIRS channels to brain/muscle anatomy (e.g., MRI). | Essential for meaningful spatial interpretation. |
| Indocyanine Green (ICG) | Blood flow tracer for measuring absolute cerebral blood flow. | Requires clinical-grade safety protocols. |
| Standardized Hypoxia/Ischemia Challenge System | Provides controlled physiological perturbations for validation. | Normobaric hypoxia chamber or cuff occlusion system. |
| Multi-Modal Validation Suite (e.g., MRI, TCD, BGA) | Gold-standard validation for NIRS-derived parameters. | Arterial Blood Gas Analysis (BGA) validates systemic O₂. |
Persistent Gaps and Future Directions
Despite consensus, significant gaps remain:
- Absolute Quantification: NIRS cannot reliably measure absolute tissue oxygen saturation or cytochrome concentration without invasive calibration.
- Specificity: The CCO signal is overlapped by hemoglobin, making isolated redox measurement in vivo highly challenging.
- Depth Resolution: Standard continuous-wave NIRS lacks depth specificity, confounding cortical and superficial signals.
- Interpretive Models: The Modified Beer-Lambert Law relies on assumed, not measured, pathlengths.
The experimental workflow for addressing the specificity gap is shown below.
dot Workflow for Isolating CCO Redox Signal
Diagram Title: Isolating Cytochrome c Oxidase Signal from NIRS
NIRS today reliably measures relative trends in tissue hemoglobin oxygenation and volume, forming a cornerstone for non-invasive hemodynamic monitoring. Its role in redox assessment, particularly for mitochondrial CCO, remains promising but not fully reliable, confined to well-controlled experimental paradigms. Closing these gaps requires technological advances in spectroscopy and rigorous multi-modal validation, paving the way for NIRS to become a definitive tool for in vivo redox biochemistry in drug development and disease management.
Conclusion
NIRS has matured into a powerful, non-invasive window into tissue redox metabolism, offering unique real-time monitoring capabilities for research and therapeutic development. The foundational principles are well-established, linking specific spectral features to cytochrome c oxidase redox state. Methodologically, standardized protocols are enabling robust applications from neuroscience to oncology. While challenges in quantification and signal contamination persist, advanced processing and probe design are providing solutions. Crucially, growing validation against gold-standard techniques is building confidence in NIRS-derived metrics. Looking forward, the integration of multi-modal NIRS systems, wearable technology, and AI-driven analytics promises to transform this tool from a laboratory technique into a mainstream platform for assessing metabolic health, disease progression, and drug efficacy, ultimately enabling personalized medicine approaches based on dynamic redox physiology.