NADPH: The Essential Reducing Powerhouse in Glutathione and Thioredoxin Antioxidant Systems
This article provides a comprehensive analysis of NADPH's critical role as the central electron donor in the glutathione (GSH) and thioredoxin (Trx) systems, the body's primary antioxidant and redox regulatory...
NADPH: The Essential Reducing Powerhouse in Glutathione and Thioredoxin Antioxidant Systems
Abstract
This article provides a comprehensive analysis of NADPH's critical role as the central electron donor in the glutathione (GSH) and thioredoxin (Trx) systems, the body's primary antioxidant and redox regulatory networks. We first establish the fundamental biochemistry and compartmentalization of these pathways. We then explore methodologies for measuring NADPH flux and system activity, alongside applications in disease research and drug targeting. The article addresses common experimental challenges in quantifying NADPH-dependent reactions and optimizing assay conditions. Finally, we present comparative analysis of the two systems, validation strategies for pharmacological interventions, and discuss emerging therapeutic paradigms. This resource is tailored for researchers and drug development professionals seeking to understand and manipulate cellular redox homeostasis.
NADPH 101: Core Biochemistry and Compartmentalization in Redox Defense
Nicotinamide adenine dinucleotide phosphate (NADPH) is an essential reducing agent in all living cells, serving as a primary electron donor in anabolic biosynthesis and antioxidant defense. Within the context of redox homeostasis, NADPH is fundamental to the function of both the glutathione (GSH) and thioredoxin (Trx) systems, which are critical for maintaining cellular redox balance, detoxifying reactive oxygen species (ROS), and regulating signaling pathways. This technical guide details the chemical structure, biosynthetic pathways, and key enzymes governing NADPH production, with a focus on implications for research in redox biology and therapeutic development.
Chemical Structure and Properties
NADPH is a phosphorylated derivative of NADH. Its core structure consists of two nucleotides: one with an adenine base and one with a nicotinamide base, joined through their phosphate groups. The key differentiating feature from NADH is an additional phosphate group esterified to the 2'-hydroxyl group of the ribose moiety in the adenosine nucleotide. The redox-active component is the nicotinamide ring, which accepts a hydride ion (H-, equivalent to a proton and two electrons) during reduction to form NADPH. The reduced form (NADPH) absorbs light at 340 nm, a property utilized in many enzymatic assays.
Table 1: Key Physicochemical Properties of NADPH
| Property | Value / Description |
|---|---|
| Molecular Formula | C₂₁H₂₉N₇O₁₇P₃ |
| Molecular Weight | 744.42 g/mol |
| Redox Potential (E°') | -0.32 V |
| Absorption Max (Oxidized, NADP⁺) | 259 nm |
| Absorption Max (Reduced, NADPH) | 340 nm |
| Extinction Coefficient (ε₃₄₀) | 6,220 M⁻¹ cm⁻¹ |
| Primary Biological Role | Reducing agent for anabolism & antioxidant systems |
Biosynthesis of NADPH
NADPH is synthesized primarily via the oxidative branches of metabolic pathways. The major contributors are the pentose phosphate pathway (PPP), malic enzyme (ME) reactions, and the cytosolic isocitrate dehydrogenase (IDH1) reaction. Folate metabolism and nicotinamide nucleotide transhydrogenase (NNT) also contribute under specific conditions.
Title: Major NADPH Biosynthesis Pathways Feeding into GSH/Trx Systems
Key NADPH-Producing Enzymes: Structure, Function, and Regulation
Glucose-6-Phosphate Dehydrogenase (G6PD)
G6PD catalyzes the first and rate-limiting step of the oxidative PPP, oxidizing glucose-6-phosphate to 6-phosphogluconolactone while reducing NADP⁺ to NADPH.
Table 2: Quantitative Characteristics of Key NADPH-Producing Enzymes
| Enzyme (Gene) | EC Number | Cellular Localization | Key Cofactors/Activators | Key Inhibitors | Reported Vmax/Km (NADP⁺) | Pathological Relevance |
|---|---|---|---|---|---|---|
| G6PD (G6PD) | 1.1.1.49 | Cytosol | Mg²⁺, NADP⁺ | NADPH, Palmitoyl-CoA, ROS | ~2.8 s⁻¹ / ~17 µM | G6PD deficiency (hemolytic anemia), cancer cell survival |
| IDH1 (IDH1) | 1.1.1.42 | Cytosol, Peroxisomes | Mg²⁺/Mn²⁺, Isocitrate | — | Varies by mutant | IDH1 mutations in glioma, AML (produce 2-HG) |
| ME1 (ME1) | 1.1.1.40 | Cytosol | Mg²⁺/Mn²⁺, Malate | ATP, NADH, Polyunsaturated Fatty Acids | ~40 U/mg / ~20 µM | Cancer metabolism, lipogenesis, antioxidant defense |
Isocitrate Dehydrogenase 1 (IDH1)
Cytosolic NADP⁺-dependent IDH1 catalyzes the oxidative decarboxylation of isocitrate to α-ketoglutarate (αKG), generating NADPH. Mutations in IDH1 (e.g., R132H) confer a neomorphic activity, reducing αKG to the oncometabolite D-2-hydroxyglutarate (2-HG) while consuming NADPH.
Malic Enzyme 1 (ME1)
ME1 decarboxylates malate to pyruvate, generating NADPH. It connects the TCA cycle with cytosolic NADPH production and lipogenesis.
Detailed Experimental Protocols
Protocol: Spectrophotometric Assay for G6PD Activity
Principle: G6PD activity is measured by monitoring the increase in absorbance at 340 nm due to NADPH formation.
Reagents:
- Tris-HCl buffer (100 mM, pH 8.0, containing 10 mM MgCl₂).
- NADP⁺ solution (10 mM in buffer).
- Glucose-6-phosphate (G6P) solution (50 mM in H₂O).
- Cell lysate or purified enzyme sample.
- Positive control (commercial G6PD).
Procedure:
- Prepare the reaction mix in a quartz cuvette: 890 µL Tris-HCl/MgCl₂ buffer, 50 µL NADP⁺ solution, 50 µL G6P solution.
- Blank the spectrophotometer at 340 nm using the reaction mix.
- Initiate the reaction by adding 10 µL of sample. Mix quickly by inversion.
- Immediately record the increase in absorbance at 340 nm (A₃₄₀) every 15 seconds for 5 minutes at 25°C.
- Calculate enzyme activity using the formula: Activity (U/mL) = (ΔA₃₄₀/min × Total Reaction Volume (µL)) / (6.22 × Sample Volume (µL) × Path Length (cm)) where 6.22 is the millimolar extinction coefficient of NADPH (mM⁻¹ cm⁻¹). One unit (U) is defined as the amount of enzyme that produces 1 µmol of NADPH per minute.
Protocol: Measurement of Intracellular NADPH/NADP⁺ Ratio using Cycling Assay
Principle: NADPH is acid-stable, while NADP⁺ is base-stable. Separate extracts are used to quantify each, and a enzymatic cycling reaction amplifies signal for detection.
Reagents:
- Extraction buffer A (for NADPH): 0.1 N NaOH with 1% DTBA.
- Extraction buffer B (for NADP⁺): 0.1 N HCl.
- Assay buffer: 100 mM Tris-HCl (pH 8.0), 0.5 mM EDTA, 4 mM G6P.
- Developing enzyme mix: 5 U/mL G6PD, 0.1 mg/mL MTT, 0.2 mg/mL PMS.
- Standards: NADPH and NADP⁺ (0-10 µM).
Procedure:
- Extraction: For NADPH, lyse 1x10⁶ cells in 200 µL of cold Buffer A, heat at 60°C for 5 min, neutralize. For NADP⁺, use Buffer B, neutralize. Clarify by centrifugation.
- Cycling Assay: In a 96-well plate, add 50 µL sample or standard to 100 µL Assay Buffer. Initiate reaction with 50 µL Developing Enzyme Mix.
- Detection: Incubate at 37°C for 10-30 min protected from light. Measure absorbance at 570 nm.
- Calculation: Calculate concentrations from standard curves. Ratio = [NADPH] / [NADP⁺].
The Scientist's Toolkit: Research Reagent Solutions
Table 3: Essential Reagents for NADPH and Redox System Research
| Reagent / Material | Supplier Examples | Function / Application |
|---|---|---|
| Recombinant Human G6PD Protein | Sigma-Aldrich, Abcam | Positive control for enzyme assays, kinetic studies. |
| NADP⁺ / NADPH Sodium Salts | Roche, Cayman Chemical | Enzyme substrate/cofactor, standard for quantification. |
| Glucose-6-Phosphate (G6P) | Thermo Fisher, Sigma | Substrate for G6PD activity assays. |
| IDH1 R132H Mutant Protein | R&D Systems, BPS Bioscience | Critical for studying oncometabolite 2-HG production in cancer models. |
| GSH/GSSG Ratio Assay Kit | Promega, Cayman Chemical | Fluorometric or colorimetric measurement of glutathione redox state, dependent on NADPH. |
| Thioredoxin Reductase (TrxR) Inhibitor (Auranofin) | Tocris, Selleckchem | Pharmacological tool to dissect Trx system function and NADPH flux. |
| siRNA Pools (G6PD, IDH1, ME1) | Dharmacon, Santa Cruz | Gene knockdown to study source-specific NADPH contributions to GSH/Trx systems. |
| NADPH/NADP⁺-Glo Assay | Promega | Luminescent, high-throughput assay for ratio determination in cells. |
| LC-MS/MS Standards (d-2-HG, NADPH) | Cambridge Isotopes, Sigma | Quantitative metabolomics to link NADPH metabolism to pathway alterations. |
NADPH in Glutathione and Thioredoxin Systems: A Functional Context
NADPH is the obligate electron donor for maintaining the reduced states of glutathione and thioredoxin systems.
- Glutathione System: NADPH reduces glutathione disulfide (GSSG) back to reduced glutathione (GSH) via glutathione reductase (GR). GSH is a direct antioxidant and cofactor for glutathione peroxidases (GPx).
- Thioredoxin System: NADPH reduces thioredoxin reductase (TrxR), which in turn reduces oxidized thioredoxin (Trx). Reduced Trx reduces peroxiredoxins (Prx) and other substrates.
Title: NADPH as the Electron Donor for GSH and Thioredoxin Antioxidant Systems
NADPH, with its distinct chemical identity defined by the 2'-phosphate group, is centrally produced by G6PD, IDH1, and ME1. Its precise measurement and the modulation of its production enzymes are critical for investigating redox biology. The functional interdependence between NADPH pools and the glutathione/thioredoxin systems presents a rich landscape for therapeutic intervention in diseases characterized by oxidative stress, such as cancer, neurodegenerative disorders, and metabolic syndromes. Targeting NADPH metabolism offers a strategic approach to alter cellular redox resilience.
Glutathione (GSH), the most abundant cellular non-protein thiol, is the cornerstone of the antioxidant defense network. Its function is inextricably linked to nicotinamide adenine dinucleotide phosphate (NADPH), which provides the reducing power necessary for system regeneration. This whitepaper provides a technical deep dive into the three core NADPH-dependent enzymatic reactions of the glutathione system: Glutathione Reductase (GSR), Glutathione Peroxidase (GPX), and Glutathione S-Transferase (GST). The analysis is framed within the central thesis that NADPH is the master redox regulator, whose availability and flux critically determine the capacity, kinetics, and therapeutic targetability of both the glutathione and thioredoxin systems in health, disease, and drug development.
The NADPH-Dependent Core: GSR, GPX, and GST
Glutathione Reductase (GSR): The NADPH-Dependent Redox Regenerator
GSR catalyzes the reduction of oxidized glutathione (GSSG) to its reduced, active form (GSH), consuming NADPH.
- Reaction: GSSG + NADPH + H⁺ → 2 GSH + NADP⁺
- Role: Maintains a high (>100:1) GSH:GSSG ratio, essential for cellular redox homeostasis.
Quantitative Data on GSR:
| Parameter | Typical Value / Range | Notes / Context |
|---|---|---|
| EC Number | EC 1.8.1.7 | |
| Human Gene | GSR | Chromosome 8p12 |
| Km (NADPH) | ~5 - 15 µM | High affinity for NADPH ensures efficient recycling even under low NADPH stress. |
| Km (GSSG) | ~50 - 100 µM | |
| Specific Activity (Human Erythrocyte) | ~150 - 200 U/mg protein | Activity is a key biomarker of antioxidant capacity. |
| Primary Cellular Localization | Cytoplasm, Mitochondria | Mitochondrial isoform is crucial for organelle-specific redox control. |
Detailed Experimental Protocol: Spectrophotometric GSR Activity Assay
- Principle: The oxidation of NADPH to NADP⁺ at 340 nm (A₃₄₀) is monitored spectrophotometrically.
- Reagents:
- Potassium Phosphate Buffer (100 mM, pH 7.5, containing 1 mM EDTA).
- NADPH Solution (2 mM in assay buffer).
- GSSG Solution (20 mM in assay buffer).
- Enzyme Source: Cell lysate or purified protein (diluted in cold buffer).
- Procedure:
- Mix in a cuvette: 700 µL buffer, 100 µL NADPH solution, 150 µL GSSG solution.
- Pre-incubate at 25°C or 37°C for 2-3 minutes.
- Initiate the reaction by adding 50 µL of enzyme source. Mix rapidly.
- Immediately record the decrease in A₃₄₀ for 2-3 minutes.
- Run a control without enzyme to correct for non-specific NADPH oxidation.
- Calculation: Activity (U/mL) = (ΔA₃₄₀/min * Total Volume * Dilution Factor) / (6.22 * 0.1 * Sample Volume). Where 6.22 is the millimolar extinction coefficient of NADPH (cm⁻¹ mM⁻¹).
Diagram 1: GSR Catalyzes NADPH-Dependent GSH Regeneration.
Glutathione Peroxidase (GPX): The NADPH-Supported Peroxide Detoxifier
GPX reduces hydrogen peroxide and lipid hydroperoxides to water and corresponding alcohols, using GSH as the reductant, thereby producing GSSG.
- Reaction: H₂O₂ (or ROOH) + 2 GSH → 2 H₂O (or ROH + H₂O) + GSSG
- Role: Primary enzymatic defense against peroxides. GSR subsequently recycles GSSG, making the overall cycle NADPH-dependent.
Quantitative Data on GPX (GPX1 as example):
| Parameter | Typical Value / Range | Notes / Context |
|---|---|---|
| EC Number | EC 1.11.1.9 | |
| Human Gene (GPX1) | GPX1 | Cytosolic, ubiquitous isoform. |
| Km (H₂O₂) | ~10 - 50 µM | |
| Km (GSH) | ~1 - 10 mM | High, indicating GSH concentration is a key regulator. |
| Cofactor | Selenocysteine (Sec) at active site | Encoded by UGA codon; essential for activity. |
| Specific Activity | Varies widely by isoform/tissue | Often assayed coupled with GSR and NADPH. |
Glutathione S-Transferase (GST): The NADPH-Supported Conjugation Hub
GSTs catalyze the conjugation of GSH to electrophilic substrates (e.g., xenobiotics, lipid peroxidation products). This does not directly consume NADPH. However, the resulting conjugate is often exported, and the GSH pool is depleted. Maintaining GSH levels for GST-mediated detoxification requires continuous NADPH-dependent GSR activity.
- Reaction: RX + GSH → GS-R + HX (where RX is an electrophile).
- Role: Phase II detoxification, protection against electrophilic stress and secondary oxidative damage.
Quantitative Data on GST (GSTP1 as example):
| Parameter | Typical Value / Range | Notes / Context |
|---|---|---|
| EC Number | EC 2.5.1.18 | |
| Human Gene (GSTP1) | GSTP1 | Polymorphic; associated with drug response/toxicity. |
| Km (GSH) | ~0.1 - 1.0 mM | Generally lower than GPX, reflecting high affinity. |
| *Km (CDNB) | ~0.5 - 2.0 mM | *Model substrate 1-chloro-2,4-dinitrobenzene. |
| Specific Activity | Highly substrate-dependent | CDNB assay is standard for total GST activity. |
Detailed Experimental Protocol: Coupled GPX Activity Assay (Indirect, NADPH Oxidation)
- Principle: GPX reduces peroxide, generating GSSG. Added GSR immediately recycles GSSG back to GSH using NADPH. The rate of NADPH oxidation is proportional to GPX activity.
- Reagents:
- Assay Buffer (50 mM Tris-HCl, pH 7.6, with 0.5 mM EDTA).
- NADPH Solution (1.5 mM).
- GSH Solution (6 mM).
- GSR Solution (≥5 U/mL).
- Cumene Hydroperoxide or t-BuOOH (1.5 mM, diluted in water).
- Enzyme Source: Sample containing GPX.
- Procedure:
- Prepare a master mix on ice: Buffer, NADPH, GSH, GSR. Add to cuvette.
- Pre-incubate at 25°C for 5 min.
- Add enzyme source, mix, and incubate for another 2 min.
- Initiate the reaction by adding peroxide substrate.
- Record the linear decrease in A₃₄₀ for 3-5 minutes.
- Calculation: GPX activity is calculated from the rate of NADPH consumption, factoring in the coupled system stoichiometry.
Diagram 2: Integrated NADPH-Dependent Glutathione System.
The Scientist's Toolkit: Research Reagent Solutions
| Reagent / Material | Function / Application | Example Vendor/Product |
|---|---|---|
| β-NADPH (Tetrasodium Salt) | Essential substrate for GSR activity assays; used to prime the glutathione system in cell-based studies. | Sigma-Aldrich (N1630), Cayman Chemical (9000745) |
| GSH & GSSG (Reduced/Oxidized Glutathione) | Reaction substrates and standards; used to establish calibration curves, modulate cellular GSH pools. | Sigma-Aldrich (G4251, G4376) |
| Recombinant Human GSR/GPX/GST Proteins | Positive controls for enzymatic assays, screening for inhibitors, structural studies. | R&D Systems, Abcam, Cayman Chemical |
| GSR Activity Assay Kit (Colorimetric/Fluorometric) | High-throughput, standardized measurement of GSR activity in tissues/cells/biological fluids. | Cayman Chemical (703202), Abcam (ab83461) |
| Coupled GPX Activity Assay Kit | Reliable, indirect measurement of total GPX activity via NADPH oxidation. | Sigma-Aldrich (CGP1), Cayman Chemical (703102) |
| CDNB (1-Chloro-2,4-dinitrobenzene) | Universal chromogenic substrate for measuring total cytosolic GST activity. | Sigma-Aldrich (237329) |
| CellROX / DCFH-DA Probes | Fluorogenic probes for measuring general cellular ROS levels, downstream of GPX activity. | Thermo Fisher Scientific (C10422, D399) |
| Monochlorobimane (mBCI) | Cell-permeable, fluorogenic dye for specific measurement of cellular GSH levels via GST-mediated conjugation. | Sigma-Aldrich (69899) |
| BSO (Buthionine Sulfoximine) | Specific, irreversible inhibitor of γ-glutamylcysteine synthetase, used to deplete intracellular GSH pools experimentally. | Sigma-Aldrich (B2515) |
| NADPH/NADP⁺ Assay Kit | Quantification of the NADPH/NADP⁺ redox ratio, a critical parameter for system function. | Promega (G9081), BioAssay Systems (ECYP-100) |
The thioredoxin (Trx) system, comprising thioredoxin reductase (TXNRD), thioredoxin (Trx), and peroxiredoxins (Prx), constitutes a central redox regulatory network in mammalian cells. Its function is intrinsically coupled to the reducing power of NADPH. Within the broader landscape of cellular antioxidant systems, the Trx system operates in parallel and often cooperatively with the glutathione (GSH) system. Both are primary consumers of NADPH, maintaining a reduced intracellular environment, defending against oxidative stress, and supporting anabolic processes like DNA synthesis via ribonucleotide reductase (RNR). This guide details the core components, quantitative dynamics, and experimental interrogation of the Trx system, framed by its essential NADPH dependency.
Core Components & Quantitative Biochemistry
The Thioredoxin Reductase (TXNRD) Family
TXNRDs are selenocysteine-containing flavoenzymes that catalyze the NADPH-dependent reduction of thioredoxin (Trx). Mammals express three major isoforms with distinct subcellular localizations and functions.
Table 1: Mammalian Thioredoxin Reductase Isoforms
| Isoform | Gene | Localization | Primary Substrate | Apparent Km for NADPH (μM) | Specific Activity (U/mg) |
|---|---|---|---|---|---|
| TXNRD1 | TXNRD1 | Cytosol, Nucleus | Trx1 | 5 - 10 | 20 - 30 |
| TXNRD2 | TXNRD2 | Mitochondria | Trx2, Prx3 | 2 - 6 | 15 - 25 |
| TXNRD3 (TGR) | TXNRD3 | Testis, ER | Trx1, Grx, GPx7 | ~8 | 10 - 20 |
Peroxiredoxins (Prx) as Trx-Dependent Peroxidases
Prxs are critical thiol-dependent peroxidases that reduce hydrogen peroxide, organic hydroperoxides, and peroxynitrite. Their catalytic cycle relies on reduced Trx as the electron donor.
Table 2: Mammalian Thioredoxin-Dependent Peroxiredoxins
| Isoform | Type | Localization | Rate Constant with H2O2 (M⁻¹s⁻¹) | Trx Partner |
|---|---|---|---|---|
| Prx1 | Typical 2-Cys | Cytosol, Nucleus | 1.0 - 1.3 x 10⁷ | Trx1 |
| Prx2 | Typical 2-Cys | Cytosol | 1.3 - 1.5 x 10⁷ | Trx1 |
| Prx3 | Typical 2-Cys | Mitochondria | 1.0 - 1.4 x 10⁷ | Trx2 |
| Prx4 | Typical 2-Cys | ER, Secreted | ~1.0 x 10⁷ | Trx1, ER-Trx |
| Prx5 | Atypical 2-Cys | Mitochondria, Cytosol, Peroxisomes | ~1.0 x 10⁶ | Trx2, Trx1 |
| Prx6 | 1-Cys | Cytosol, Lysosomes | ~1.0 x 10⁵ | Not Trx-dependent |
Ribonucleotide Reductase (RNR): The Essential Anabolic Link
RNR catalyzes the de novo conversion of ribonucleotides to deoxyribonucleotides, the rate-limiting step in DNA synthesis. The class Ia RNR (active in mammalian cells) requires a stable tyrosyl radical for activity, generated by a diferric iron center. Its catalytic cycle depends on a pair of cysteines in the active site that must be reduced by an electron donor—this role is fulfilled primarily by reduced Trx1.
Table 3: Ribonucleotide Reductase Parameters
| Parameter | Value / Detail |
|---|---|
| Human Enzyme | Heterodimer: RRM1 (α2, regulatory) & RRM2 (β2, radical) |
| Electron Donor | Thioredoxin (Trx1) or Glutaredoxin (Grx) via GSH |
| Km for Trx (reduced) | 1 - 5 μM |
| Turnover Number (kcat) | 2 - 10 min⁻¹ |
| NADPH Consumption per Nucleotide | 2 electrons (via Trx/TXNRD) |
Experimental Protocols for System Analysis
Protocol: Measuring TXNRD Activity (DTNB Reduction Assay)
Principle: TXNRD reduces 5,5'-dithio-bis(2-nitrobenzoic acid) (DTNB) to 2-nitro-5-thiobenzoic acid (TNB), producing a yellow color detectable at 412 nm. NADPH is the electron donor. Reagents:
- Assay Buffer: 50 mM potassium phosphate, 1 mM EDTA, pH 7.4.
- NADPH Solution: 10 mM in assay buffer (prepare fresh).
- DTNB Solution: 10 mM in assay buffer.
- Enzyme Sample: Cell lysate or purified TXNRD.
- Specific Inhibitor Control: 10 μM Auranofin (TXNRD inhibitor). Procedure:
- In a cuvette, mix 700 μL assay buffer, 100 μL DTNB solution, and 100 μL enzyme sample.
- Start the reaction by adding 100 μL NADPH solution.
- Immediately monitor the increase in absorbance at 412 nm (ε412 = 14,150 M⁻¹cm⁻¹) for 2-3 minutes.
- Run a control with inhibitor (pre-incubate enzyme with auranofin for 10 min).
- Calculate activity: Activity (U/mL) = (ΔA412/min * Total Volume (μL)) / (14.15 * Sample Volume (μL) * Pathlength (cm)). One unit reduces 1 μmol DTNB/min.
Protocol: Assessing Prx Peroxidase Activity (Coupled Trx/TXNRD Assay)
Principle: Prx reduces H₂O₂, consuming reduced Trx, which is regenerated by TXNRD using NADPH. NADPH oxidation is measured at 340 nm. Reagents:
- Reaction Buffer: 50 mM HEPES, 1 mM EDTA, pH 7.0.
- Coupling System: Recombinant human Trx1 (5 μM), recombinant TXNRD1 (50 nM).
- NADPH Solution: 200 μM in reaction buffer.
- H₂O₂ Solution: 100 μM (prepare from a fresh dilution of 30% stock).
- Prx Sample: Purified Prx isoform. Procedure:
- In a cuvette, mix buffer, Trx1, TXNRD1, Prx sample, and NADPH solution. Final volume 1 mL.
- Incubate at 25°C for 2 min to establish a baseline at 340 nm.
- Initiate the peroxidase reaction by adding H₂O₂ (final conc. 50-100 μM).
- Record the linear decrease in A340 (ε340 = 6,220 M⁻¹cm⁻¹) for 1-2 minutes.
- Calculate Prx activity based on NADPH consumption: ΔA340/min corresponds to the oxidation of (ΔA340/6.22) μmol NADPH/mL/min.
Protocol: Monitoring Ribonucleotide Reduction (CDP Reduction Assay)
Principle: The conversion of [³H]-CDP to dCDP is measured by separating the products via ion-exchange chromatography. Reagents:
- Assay Buffer: 50 mM HEPES-KOH, 6 mM MgAcetate, 2 mM ATP (activator), 1 mM DTT (auxiliary reductant), pH 7.2.
- Reduction System: 5 μM Trx1, 100 nM TXNRD1, 200 μM NADPH.
- Substrate: 0.5 mM CDP spiked with [³H]-CDP (0.1 μCi/assay).
- Enzyme Source: Purified recombinant human RRM1/RRM2 complex.
- Stop Solution: 1 M HClO₄. Procedure:
- In an Eppendorf tube, combine assay buffer, reduction system, NADPH, and RNR (0.5-1 μg).
- Pre-incubate at 37°C for 2 min.
- Start reaction by adding the CDP substrate mix.
- Incubate at 37°C for 10 min.
- Stop the reaction with 100 μL of 1 M HClO₄ on ice.
- Neutralize with KOH, precipitate KClO₄ by centrifugation.
- Apply supernatant to a Poly-Prep column packed with Dowex-1 borate anion-exchange resin.
- Elute nucleoside monophosphates with 10 mL water (discard). Elute deoxyribonucleoside diphosphates with 10 mL of 0.15 M ammonium formate/0.05 M formic acid.
- Collect eluate and measure radioactivity by scintillation counting. Compare to a standard curve of [³H]-dCDP.
Visualization of Pathways and Workflows
Diagram Title: NADPH-Driven Thioredoxin System Core Pathways
Diagram Title: Coupled Assay for Prx Activity Workflow
The Scientist's Toolkit: Research Reagent Solutions
Table 4: Essential Reagents for Thioredoxin System Research
| Reagent / Material | Supplier Examples | Function & Application Notes |
|---|---|---|
| Recombinant Human TXNRD1 | Sigma-Aldrich, R&D Systems | Positive control for activity assays; source of enzyme for coupled systems. Seldom expressed in E. coli due to Sec codon; often from baculovirus. |
| Recombinant Human Trx1 | Abcam, BioVision | Essential electron donor for Prx and RNR assays. Ensure it's in a reduced state or reducible by DTT/TXNRD. |
| Recombinant Human Prx Isoforms | Proteintech, Novus | Substrates for defining Trx-dependent peroxidase activity. Critical for kinetic studies. |
| NAPH, Tetrasodium Salt | Roche, MilliporeSigma | Electron donor for TXNRD. Use high-purity grade. Prepare fresh solutions due to instability. |
| Auranofin | Tocris, Selleckchem | Potent, specific inhibitor of TXNRD (IC50 ~5 nM). Used as a negative control and for functional probing. |
| Anti-TXNRD1 Antibody | Santa Cruz, Cell Signaling | For Western blot, IP, and cellular localization. Confirm isoform specificity (cytosolic vs. mitochondrial). |
| Thioredoxin Reductase Activity Assay Kit | Cayman Chemical, Abcam | Commercial kit (often DTNB-based) for rapid, standardized activity measurement in cell/tissue lysates. |
| Mammalian RNR (RRM1/RRM2) Complex | BPS Bioscience | Purified enzyme for in vitro dNTP synthesis assays. Requires anaerobic handling for radical integrity. |
| [³H]-Cytidine 5'-Diphosphate | PerkinElmer, Moravek | Radiolabeled substrate for sensitive, direct measurement of RNR activity in vitro. |
| Secured -20°C Freezer | Thermo Fisher, Panasonic | Essential for long-term storage of enzymes, NADPH, and other labile reagents in the redox pathway. |
Within the broader thesis of NADPH function in cellular redox homeostasis, a central tenet is its compartmentalized utilization by the glutathione (GSH) and thioredoxin (Trx) systems. The spatial dynamics of NADPH generation and consumption—segregated into cytosol, mitochondria, and nucleus—are not merely logistical but fundamentally dictate redox signaling, antioxidant defense, and cellular fate. This whitepaper provides a technical guide to the distinct pools of NADPH, the systems they support, and the methodologies to study them, framing this within their indispensable roles in glutathione recycling and thioredoxin reduction.
NADPH is generated by dehydrogenase enzymes with distinct subcellular localization. The primary generators and their estimated contributions to pool sizes are summarized below.
Table 1: Major NADPH-Generating Enzymes and Their Compartmentalization
| Enzyme | Primary Localization | Major Pathway/Function | Estimated Contribution to Local Pool |
|---|---|---|---|
| Glucose-6-phosphate dehydrogenase (G6PD) | Cytosol | Pentose Phosphate Pathway (Oxidative Phase) | ~60-70% cytosolic NADPH |
| 6-Phosphogluconate dehydrogenase (6PGD) | Cytosol | Pentose Phosphate Pathway | ~20-30% cytosolic NADPH |
| Malic Enzyme 1 (ME1) | Cytosol | Malate -> Pyruvate + CO₂ + NADPH | Variable, context-dependent |
| Isocitrate Dehydrogenase 1 (IDH1) | Cytosol/Nucleus | Isocitrate -> α-KG + CO₂ + NADPH | Major nuclear source; significant cytosolic |
| Malic Enzyme 3 (ME3) | Mitochondria | Malate -> Pyruvate + CO₂ + NADPH | Primary mitochondrial source |
| Isocitrate Dehydrogenase 2 (IDH2) | Mitochondria | Isocitrate -> α-KG + CO₂ + NADPH | Critical for mitochondrial antioxidant defense |
| Folate Cycle (MTHFD1L/2) | Mitochondria | One-carbon metabolism, NADPH-linked | Minor but significant under stress |
| NADP+-dependent IDH (IDH3 not relevant) | -- | -- | -- |
Table 2: Estimated Steady-State NADPH Concentrations and Turnover by Compartment
| Cellular Compartment | Estimated [NADPH] (μM) | Estimated [NADPH]/[NADP⁺] Ratio | Primary Redox System Served | Major Consumer Enzymes |
|---|---|---|---|---|
| Cytosol | 10 - 50 | ~100:1 | Glutathione System (GR) | Glutathione Reductase (GR), Thioredoxin Reductase 1 (TrxR1), NOX/DUOX |
| Mitochondria | 20 - 100 | ~30:1 - 60:1 | Glutathione & Thioredoxin Systems | Glutathione Reductase 2 (GR2), Thioredoxin Reductase 2 (TrxR2) |
| Nucleus | 5 - 20 (difficult to measure) | ~50:1 (inferred) | Thioredoxin System (Primary) | Thioredoxin Reductase 1 (TrxR1), DNA repair enzymes |
| Peroxisomes | Low (nanomolar range) | Lower | Glutathione System | Peroxisomal GR/TrxR analogs |
System Localization: Glutathione vs. Thioredoxin Pathways
The GSH and Trx systems, while functionally overlapping, are spatially and enzymatically distinct. Their compartment-specific configurations are critical for targeted redox control.
Table 3: Compartment-Specific Configuration of Glutathione and Thioredoxin Systems
| System | Component | Cytosol | Mitochondria | Nucleus | Notes |
|---|---|---|---|---|---|
| Glutathione (GSH) | GSH Synthesis | Yes (γ-GCS, GS) | No (imported) | No (imported) | γ-GCL rate-limiting; cytosol only. |
| Reduced GSH Pool | High (1-11 mM) | Moderate (5-15 mM) | Low (difficult to quantify) | Total cellular pool ~1-15 mM. | |
| Glutathione Reductase (GR) | GR (GPX4 backup) | GR2 (essential) | Likely present (cytosolic import?) | GR2 is mitochondrial-specific. | |
| Glutathione Peroxidase (GPX) | GPX1, GPX4, etc. | GPX1, GPX4 | GPX1, GPX4? | GPX4 critical for lipid peroxidation. | |
| Thioredoxin (Trx) | Thioredoxin (Trx) | Trx1 | Trx2 | Trx1 (imported/modified) | Trx1 can shuttle to nucleus upon stress. |
| Thioredoxin Reductase (TrxR) | TrxR1 (Se-containing) | TrxR2 (Se-containing) | TrxR1 (imported) | Essential selenoproteins. | |
| Peroxiredoxin (Prx) | Prx I, II, VI | Prx III, V | Prx I, II, (III?) | Prx III is major mitochondrial H₂O₂ sensor. |
Title: NADPH Pools and Redox Systems Across Cellular Compartments
Experimental Protocols for Measuring Compartmentalized NADPH
Genetically-Encoded Rationetric NADPH Sensor Imaging (e.g., Apollo-NADP+)
This protocol utilizes the Apollo-NADP+ sensor, a fusion of a NADPH-binding domain with cpFP, targeted to specific compartments.
Protocol:
- Sensor Expression: Transfect cells with plasmids encoding Apollo-NADP+ targeted to cytosol (no tag), mitochondria (mito-targeting sequence from COX8A), or nucleus (NLS sequence).
- Cell Culture & Seeding: Seed transfected cells onto glass-bottom imaging dishes 24-48h post-transfection.
- Live-Cell Imaging Setup:
- Use a confocal or widefield fluorescence microscope with environmental control (37°C, 5% CO₂).
- For Apollo-NADP+, acquire images using two excitation wavelengths: Ex 405 nm (NADPH-sensitive) and Ex 488 nm (NADPH-insensitive reference). Emission is collected at ~515 nm.
- Rationetric Calculation & Calibration:
- Calculate ratio R = F₄₀₅ / F₄₈₈ for each pixel/cell.
- Perform in situ calibration at the end of each experiment: a. Acquire Rmin: Treat with 10 μM piericidin A (complex I inhibitor) and 5 μM antimycin A (complex III inhibitor) in glucose-free medium to maximize NADP⁺. b. Acquire Rmax: Treat with 10 mM H₂O₂ to fully oxidize pools, followed by wash and incubation with 5 mM glucose and 1 mM pyruvate to maximize NADPH.
- Calculate [NADPH] fraction = (R - Rmin) / (Rmax - R_min).
- Experimental Intervention: Apply treatments (e.g., oxidative stress with menadione, inhibition of G6PD with 6-AN) and record time-lapse ratio changes.
Subcellular Fractionation Followed by Enzymatic Cycling Assay
A biochemical approach to isolate compartments and measure NADPH quantitatively.
Protocol:
- Cell Harvest & Fractionation:
- Harvest 5-10 x 10⁷ cells by trypsinization and centrifugation.
- Wash with ice-cold PBS.
- Resuspend in isotonic mitochondrial buffer (225 mM mannitol, 75 mM sucrose, 30 mM Tris-HCl pH 7.4, 0.1 mM EDTA) with protease inhibitors.
- Homogenize with a tight-fitting Dounce homogenizer (30-40 strokes on ice). Check efficiency (>90% cell lysis) via trypan blue.
- Differential Centrifugation:
- Centrifuge at 600 x g, 10 min, 4°C. Pellet (P1) = nuclei and unbroken cells.
- Centrifuge supernatant (S1) at 7,000 x g, 10 min, 4°C. Pellet (P2) = crude mitochondria.
- Centrifuge resulting supernatant (S2) at 100,000 x g, 60 min, 4°C. Supernatant (S3) = cytosolic fraction. Pellet (P3) = microsomes.
- Nuclear Purification: Resuspend P1 in buffer with 0.5% NP-40, vortex, pellet nuclei (600 x g, 5 min), wash twice.
- Mitochondrial Wash: Resuspend P2 in mitochondrial buffer and repeat 7,000 x g spin. Use pellet as mitochondrial fraction.
- Validation of Fraction Purity: Assay for marker enzymes: Lactate Dehydrogenase (LDH, cytosol), Cytochrome c Oxidase (COX, mitochondria), Histone H3 (nuclei).
- NADPH Extraction & Assay:
- Immediately after fractionation, add fractions to 0.1N HCl (for total NADPH+NADP⁺) or 0.1N NaOH (for NADP⁺ only), vortex, heat at 60°C for 15 min, then neutralize.
- Use enzymatic cycling assay: In a 96-well plate, mix sample with assay buffer (100 mM Tris-HCl pH 8.0, 5 mM EDTA, 0.5 mM MTT, 2.5 μM phenazine ethosulfate (PES), 6 U/ml glucose-6-phosphate dehydrogenase). For NADPH-specific measurement, initiate reaction with 2 mM GSSG and 2 U/ml Glutathione Reductase (GR).
- The reaction: NADPH + GSSG → NADP⁺ + 2 GSH (catalyzed by GR). The generated NADP⁺ is immediately reduced back to NADPH by G6PD using G6P in the buffer, creating a cycle that reduces MTT. Measure absorbance at 570 nm over 10-30 min.
- Calculate NADPH concentration from a standard curve (0-10 μM NADPH) run in parallel.
Title: Subcellular Fractionation Workflow for NADPH Assay
The Scientist's Toolkit: Key Research Reagent Solutions
Table 4: Essential Reagents for Studying Compartmentalized NADPH Pools
| Reagent / Material | Primary Function / Target | Application Example in Protocols | Key Considerations |
|---|---|---|---|
| Genetically-Encoded Sensors (e.g., Apollo-NADP+, iNAP) | Rationetric measurement of [NADPH]/[NADP⁺] in live cells. | Section 4.1: Live-cell imaging of cytosolic, mitochondrial, or nuclear NADPH dynamics. | Requires transfection/transduction; calibration is essential for quantitative data. |
| 6-Aminonicotinamide (6-AN) | Competitive inhibitor of G6PD (cytosolic PPP). | Depleting cytosolic NADPH pool to assess compartment-specific reliance. | Can have off-target effects; use low doses (10-100 μM) for acute inhibition. |
| Triose Phosphate Isomerase Inhibitor (e.g., Oxamate) | Inhibits glycolysis, can shunt carbons to PPP. | Indirectly modulating cytosolic NADPH generation. | Not specific; affects overall energy metabolism. |
| ME/IDH Inhibitors (e.g., ME1 siRNA, AGI-6780 for mutant IDH2) | Silences or inhibits specific NADPH-generating dehydrogenases. | Probing the role of ME1 (cytosol) or IDH2 (mitochondria) in maintaining their local pools. | Selectivity for isoforms is critical; validate with genetic knockout. |
| Buthionine Sulfoximine (BSO) | Irreversible inhibitor of γ-glutamylcysteine synthetase (γ-GCS). | Depletes total cellular GSH, increasing demand on NADPH via GR, stressing the pools. | Long incubation (12-24h) required; monitors NADPH consumption rate. |
| Auranofin | Potent inhibitor of Thioredoxin Reductase (TrxR1, TrxR2). | Blocks NADPH consumption by Trx system, causing NADPH accumulation and Trx oxidation. | High potency (nM-μM range); useful for dissecting GSH vs. Trx system NADPH use. |
| Piericidin A & Antimycin A | Mitochondrial Complex I & III inhibitors. | Used in sensor calibration (induce NADP⁺ max) and to stress mitochondrial NADPH pool. | Toxic; use in glucose-free medium for maximal effect. |
| Digitonin (Permeabilizing Agent) | Selective cholesterol-dependent permeabilization of plasma membrane. | Used in "digitonin titration" to sequentially release cytosolic, then mitochondrial contents for assay. | Concentration and time-critical; must be optimized per cell type. |
| Recombinant Glutathione Reductase (GR) & GSSG | Core components of the enzymatic cycling assay. | Section 4.2: Quantifying NADPH in fractionated samples. | Ensure enzyme is NADPH-specific and has high activity. |
| NADPH Standard (tetrasodium salt) | Quantitative standard for calibration curves. | Essential for all biochemical assays (cycling, fluorometric) to convert signal to concentration. | Prepare fresh in appropriate buffer (e.g., Tris-EDTA, pH 8.0); light-sensitive. |
Within the cellular defense against oxidative and electrophilic stress, two major thiol-dependent systems—the glutathione (GSH) and thioredoxin (Trx) systems—are paramount. Both are fundamentally reliant on the reducing power of nicotinamide adenine dinucleotide phosphate (NADPH). This cofactor serves as the primary electron donor, directly linking cellular redox balance to metabolic status. This whitepaper frames the intricate interdependence and crosstalk between these systems within the critical context of NADPH availability and function. Understanding this networked redundancy is essential for research into diseases characterized by oxidative stress, such as cancer, neurodegeneration, and aging, and for the development of targeted therapeutics.
The Glutathione (GSH) System
The GSH system centers on the tripeptide glutathione (γ-L-glutamyl-L-cysteinylglycine) in its reduced (GSH) and oxidized (GSSG) forms. Key enzymes include:
- Glutathione Reductase (GR): Uses NADPH to reduce GSSG back to GSH.
- Glutathione Peroxidases (GPx): Use 2 GSH to reduce peroxides (e.g., H₂O₂, lipid peroxides) to water/alcohols, producing GSSG.
- Glutaredoxins (Grx): Thiol-disulfide oxidoreductases that primarily use GSH as a cofactor to reduce protein disulfides and mixed disulfides (deglutathionylation).
The Thioredoxin (Trx) System
The Trx system centers on the small protein thioredoxin (Trx) in its reduced (Trx-(SH)₂) and oxidized (Trx-S₂) forms. Key enzymes include:
- Thioredoxin Reductase (TrxR): A selenoenzyme that uses NADPH to reduce oxidized Trx.
- Thioredoxin (Trx): Directly reduces protein disulfides, including key targets like ribonucleotide reductase, peroxiredoxins (Prx), and transcription factors (e.g., NF-κB, AP-1).
- Peroxiredoxins (Prx): Major thiol-dependent peroxidases that are often reduced by Trx (some isoforms can also be reduced by Grx/GSH).
Quantitative Comparison of the GSH and Trx Systems
Table 1: Core Quantitative Parameters of the GSH and Trx Systems in Mammalian Cells
| Parameter | Glutathione System | Thioredoxin System | Notes & Implications |
|---|---|---|---|
| Primary Reductant | GSH (1-10 mM) | Trx1 (~1-10 µM) | [GSH] >> [Trx]; GSH acts as high-capacity redox buffer, Trx as high-affinity protein reductant. |
| NADPH-Dependent Reductase | Glutathione Reductase (GR) | Thioredoxin Reductase (TrxR) | Both are homodimers; Km(NADPH) for GR ~5 µM, for TrxR ~2-5 µM. Competitive demand for NADPH. |
| Redox Potential (E°') | GSSG/2GSH: -240 mV | Trx-S₂/Trx-(SH)₂: -270 mV to -290 mV | Trx system is more reducing, suitable for reducing protein disulfides. |
| Major Peroxidases | GPx (GPx1-8) | Prx (Prx1-6) | GPx has high peroxidase activity (k ~10^8 M⁻¹s⁻¹); Prx has high abundance but can be inactivated by hyperoxidation. |
| Backup Reductant Pathways | Grx can use TrxR/NADPH in vitro; TXNIP/NLRP3 modulation | Some Prx isoforms reducible by Grx/GSH; Nrf2 induction of GSH synthesis | Evidence of functional crosstalk and compensation. |
Table 2: Experimental Knockout/Inhibition Phenotypes Demonstrating Crosstalk
| Intervention (Model) | Primary System Impact | Compensatory Response in Other System | Reference Insights |
|---|---|---|---|
| GR Knockout (Yeast/Mice) | GSH depletion, GSSG accumulation, growth defect. | Upregulation of Trx/TrxR mRNA and activity; increased reliance on Trx system for peroxide detox. | Lethal in mice; embryonic death, highlighting essentiality but also crosstalk activation. |
| TrxR1 Inhibition (Auranofin in cells) | Accumulation of oxidized Trx1, reduced Prx activity. | Increased GSH synthesis (↑GCLC expression), increased GPx activity. | Cells shift H₂O₂ detoxification burden to the GSH/GPx pathway. |
| GSH Depletion (BSO treatment) | Drastic drop in GSH:GSSG ratio. | Increased TrxR activity and Trx protein levels; increased susceptibility if Trx system is also inhibited. | Demonstrates critical backup role of Trx system when GSH is compromised. |
| Double Inhibition (BSO + Auranofin) | Severe oxidative stress, protein oxidation, cell death. | Minimal compensation; synergistic cytotoxicity. | Validates the concept of networked redundancy as a therapeutic target. |
Key Experimental Protocols for Studying System Interdependence
Protocol: Measuring System-Specific Peroxide Clearance with Pharmacological Inhibition
Objective: To delineate the relative contribution of the GSH/GPx and Trx/Prx systems to cellular peroxide clearance. Reagents: See "The Scientist's Toolkit" below. Workflow:
- Cell Preparation: Plate cells in 96-well plates or prepare in suspension.
- Inhibition (30-60 min pre-treatment):
- GSH System Inhibition: Treat with 1-5 mM BSO (inhibits GSH synthesis) or 10-50 µM Mercaptosuccinate (inhibits GPx).
- Trx System Inhibition: Treat with 1-10 µM Auranofin (inhibits TrxR).
- Dual Inhibition: Combine inhibitors.
- Control: DMSO/vehicle.
- Peroxide Challenge: Add a bolus of H₂O₂ (e.g., 50-200 µM) or a lipid peroxide analog (e.g., t-BOOH).
- Real-Time Monitoring: Immediately measure peroxide clearance using:
- Fluorescent Probe (e.g., PF6-AM): Load cells with 5 µM PF6-AM for 30 min before experiment. After H₂O₂ addition, monitor fluorescence (Ex/Em ~490/515 nm) every 1-2 minutes. A slower fluorescence decay indicates impaired clearance.
- Amplex Red/HRP Assay: Take small aliquots of extracellular medium at time points (0, 2, 5, 10, 15 min). Measure residual H₂O₂ by reaction with Amplex Red (50 µM) and HRP (0.1 U/mL). Fluorescence signal is proportional to unmetabolized H₂O₂.
- Data Analysis: Plot residual H₂O₂ or fluorescence over time. Calculate initial clearance rates (V₀). Compare rates between inhibition conditions to attribute clearance capacity to each system.
Protocol: Assessing Protein S-Glutathionylation as a Crosstalk Mechanism
Objective: To detect and quantify protein S-glutathionylation (PSSG) changes upon perturbation of either redox system. Workflow:
- Treatment & Lysis: Treat cells with oxidative stress (e.g., diamide, H₂O₂) ± inhibitors (Auranofin, BSO). Lyse in a alkylation buffer (50 mM Tris-HCl pH 7.5, 150 mM NaCl, 1% NP-40) containing 20-50 mM N-ethylmaleimide (NEM) to rapidly alkylate free thiols and block artifactual oxidation/deglutathionylation.
- Free GSH Removal: Pass lysate through a desalting column (e.g., Zeba Spin) to remove small molecules like free GSH.
- Reduction of Mixed Disulfides: Split lysate. Treat one aliquot with a specific reducing agent:
- Experimental: Reduce with 10-20 mM DTT (reduces all disulfides) or 1-5 µM recombinant Grx1 + 1 mM GSH (specifically reduces protein-SSG bonds).
- Control: Incubate with buffer only.
- Labeling of Newly Freed Thiols: Remove the reducing agent via desalting. React the newly exposed protein thiols (from reduced PSSG) with a biotin-conjugated maleimide (e.g., Biotin-HPDP) or a thiol-reactive fluorescent tag.
- Detection:
- Streptavidin Pulldown/Western: Pull down biotinylated proteins with streptavidin beads, run SDS-PAGE, and probe for proteins of interest.
- Global Analysis: Run streptavidin-HRP blot on the biotinylated sample to see the global PSSG profile.
- Interpretation: Increased PSSG signal upon TrxR inhibition (Auranofin) suggests the Trx system (via Grx) is crucial for maintaining protein deglutathionylation, a direct crosstalk mechanism.
Diagrams of Pathways and Crosstalk
Diagram 1: NADPH-Driven GSH & Trx Systems Core Pathways (Max 760px)
Diagram 2: System Perturbation & Compensatory Crosstalk (Max 760px)
The Scientist's Toolkit: Key Research Reagent Solutions
Table 3: Essential Reagents for Studying GSH/Trx Interdependence
| Reagent / Material | Primary Function in Research | Application Example |
|---|---|---|
| Buthionine Sulfoximine (BSO) | Irreversible inhibitor of γ-glutamylcysteine synthetase (GCL), the rate-limiting enzyme in GSH synthesis. | Depleting intracellular GSH pools to study Trx system compensation and sensitization to oxidants. |
| Auranofin | Potent, cell-permeable inhibitor of Thioredoxin Reductase (TrxR) by selenocysteine modification. | Inhibiting the Trx system to assess GSH/GPx upregulation and measure protein S-glutathionylation. |
| Mercaptosuccinate | Competitive inhibitor of Glutathione Peroxidase (GPx). | Selectively impairing the GSH-dependent peroxidase pathway to probe Prx contribution. |
| Recombinant Human Grx1 | Enzyme specifically catalyzing deglutathionylation or thiol-disulfide exchange using GSH. | In assays to specifically reduce protein-SSG bonds, distinguishing them from other disulfides. |
| PF6-AM (or similar roGFP2 probes) | Genetically encoded or chemical fluorescent sensor for real-time, ratiometric measurement of H₂O₂ dynamics in live cells. | Quantifying peroxide clearance rates after pharmacological inhibition of specific redox systems. |
| Anti-Glutathione Antibody | Detects protein-glutathione mixed disulfides (S-glutathionylation) in Western blot or immunofluorescence. | Visualizing and quantifying PSSG as a molecular readout of redox stress and Trx/Grx system activity. |
| NADPH/NADP+ Assay Kit (Colorimetric/Fluorometric) | Quantifies the ratio of NADPH to NADP+, the central redox couple powering both systems. | Linking metabolic state (e.g., PPP activity) to the reducing capacity of GSH and Trx systems. |
| TXNIP siRNA/Plasmid | Modulates expression of the endogenous Trx inhibitor protein TXNIP, which links redox state to inflammation (NLRP3). | Studying transcriptional and signaling crosstalk between redox status and inflammatory pathways. |
Measuring NADPH Flux and Targeting Its Systems in Disease & Therapy
Within the critical research sphere of cellular redox homeostasis, the precise quantification of the NADPH/NADP+ ratio is paramount. This cofactor pair is the essential reducing currency for both the glutathione (GSH) and thioredoxin (Trx) antioxidant systems, governing processes from oxidative stress defense to nucleotide biosynthesis and drug metabolism. Accurate assessment of its status is therefore foundational to studies in cancer metabolism, neurodegeneration, and aging. This guide details the three gold-standard methodological approaches for quantifying these pyridine nucleotides, framing their application within redox systems research.
Spectrophotometric (UV-Vis) Assay
This method leverages the distinct absorbance properties of NADPH (A₃₄₀ nm) versus NADP⁺. The assay is often coupled with enzyme cycling reactions to enhance sensitivity for low-concentration samples.
Core Principle: NADPH has a strong absorbance peak at 340 nm, while NADP⁺ does not. The total pool (NADPH + NADP⁺) can be measured after enzymatic conversion of all NADP⁺ to NADPH.
Detailed Protocol for NADPH/NADP+ Ratio:
- Sample Preparation: Rapidly lyse cells or tissues in ice-cold acidic extraction buffer (e.g., 0.1M HCl for NADP⁺ preservation) or alkaline buffer (e.g., 0.1M NaOH for NADPH preservation) to halt enzymatic activity. Neutralize immediately.
- NADPH Measurement:
- Prepare a reaction mix: 0.1M Tris-Cl (pH 8.0), 2 mM EDTA, 0.5 mM DTNB [5,5'-dithi-bis-(2-nitrobenzoic acid)], and sample.
- Read baseline absorbance at 412 nm (for DTNB) or 340 nm.
- Initiate reaction by adding 2 U of glutathione reductase (GR).
- Monitor the increase in A₄₁₂ (reduction of DTNB by GSH, which is generated from GSSG by GR using NADPH) or the decrease in A₃₄₀ (direct oxidation of NADPH). Calculate NADPH concentration from a standard curve.
- Total NADP (NADPH + NADP⁺) Measurement:
- Take a separate aliquot of the neutralized extract.
- Add 0.1M Tris-Cl (pH 8.0), 2 mM EDTA, and 10 mM glucose-6-phosphate (G6P).
- Initiate reaction with 2 U of glucose-6-phosphate dehydrogenase (G6PDH). This enzyme converts all NADP⁺ to NADPH.
- Measure the final A₃₄₀ and calculate total NADP from a standard curve.
- Calculation: [NADP⁺] = [Total NADP] - [NADPH]. Ratio = [NADPH] / [NADP⁺].
Fluorometric Assay
Fluorometry offers significantly higher sensitivity than direct spectrophotometry, ideal for limited sample sizes like primary cells or subcellular fractions.
Core Principle: NADPH is intrinsically fluorescent (excitation ~340 nm, emission ~460 nm), while NADP⁺ is not. Enzymatic cycling systems can amplify the signal.
Detailed Protocol (Enzyme Cycling):
- Sample Extraction: As above, using acid/alkaline differential extraction.
- Reaction Setup: Prepare a cycling reagent containing:
- 100 mM Tris-Cl (pH 8.0)
- 0.5 mM GSSG
- 2 mM EDTA
- 0.1% BSA
- 5 µM flavin mononucleotide (FMN)
- 0.1 U/mL glutathione reductase (GR)
- 10 µM resazurin
- Assay Execution:
- Mix sample (or NADPH standard) with cycling reagent in a black-walled 96-well plate.
- Incubate at 37°C for 30-60 minutes, protected from light. GR continuously reduces GSSG to GSH using NADPH. The oxidized FMN is reduced by electrons from GSH, and reduced FMN then converts non-fluorescent resazurin to highly fluorescent resorufin.
- Measure fluorescence (Ex 540-570 nm / Em 580-620 nm).
- Quantification: The rate of resorufin generation is proportional to the NADPH concentration. Calculate from a standard curve (typically 0-1 µM NADPH).
HPLC-based Assay
HPLC provides the highest specificity, enabling simultaneous separation and quantification of NADPH, NADP⁺, and related metabolites without the need for separate extractions.
Core Principle: Reverse-phase or ion-pair chromatography separates metabolites, which are then detected via UV/Vis or mass spectrometry.
Detailed Protocol (UV Detection):
- Sample Preparation: Single extraction with perchloric acid or acetonitrile, followed by neutralization and centrifugation.
- Chromatography Conditions:
- Column: C18 reverse-phase column (e.g., 4.6 x 150 mm, 5 µm).
- Mobile Phase: Gradient of two buffers.
- Buffer A: 50 mM Potassium phosphate (pH 6.0).
- Buffer B: 50 mM Potassium phosphate (pH 6.0) with 20% methanol.
- Gradient: 0-5 min: 0% B; 5-15 min: 0-100% B; 15-20 min: 100% B.
- Flow Rate: 1.0 mL/min.
- Detection: UV absorbance at 254 nm (for adenine moiety) or 340 nm (specific for reduced forms).
- Analysis: Identify peaks by retention time comparison with pure standards. Quantify by integrating peak areas.
Quantitative Data Comparison
Table 1: Comparison of Gold-Standard NADPH/NADP+ Assays
| Parameter | Spectrophotometric | Fluorometric (Cycling) | HPLC-UV |
|---|---|---|---|
| Sensitivity | ~1-10 µM | ~1-10 nM | ~10-100 pmol (on-column) |
| Sample Volume | 50-200 µL | 10-50 µL | 10-50 µL (injection) |
| Key Advantage | Simple, cost-effective, robust | Highly sensitive, suitable for HTS | High specificity, multi-analyte |
| Key Limitation | Low sensitivity, interference | Complex reagent optimization | High cost, technical expertise |
| Throughput | Moderate | High | Low to Moderate |
| Applicable to | Cell lysates, tissue homogenates | Cell lysates, limited samples | Complex matrices, subcellular fractions |
The Scientist's Toolkit: Essential Research Reagent Solutions
Table 2: Key Reagents for NADPH/NADP+ Quantification
| Reagent / Kit | Core Function in Assay |
|---|---|
| Glutathione Reductase (GR) | Enzyme core of cycling assays; catalyzes NADPH-dependent reduction of GSSG. |
| Glucose-6-Phosphate Dehydrogenase (G6PDH) | Converts NADP⁺ to NADPH in spectrophotometric total NADP measurement. |
| DTNB (Ellman's Reagent) | Colorimetric thiol indicator; used in spectrophotometric NADPH assays. |
| Resazurin / Fluorescent Dye | Fluorescent reporter in cycling assays; signal increases with NADPH. |
| NADPH & NADP+ Standards | Essential for generating standard curves for accurate quantification. |
| Acid/Alkaline Extraction Buffers | Selectively stabilize either oxidized or reduced forms during sample prep. |
| Commercial Fluorometric Kits | Optimized, pre-formulated reagent mixes for high-sensitivity, standardized results. |
| C18 Reverse-Phase HPLC Columns | Stationary phase for chromatographic separation of NADPH from NADP⁺ and interferents. |
Visualizing NADPH in Redox Pathway Context
Diagram 1: NADPH Drives Glutathione & Thioredoxin Systems
Diagram 2: Spectrophotometric Assay Workflow
Diagram 3: Fluorometric Cycling Assay Principle
The cellular redox environment is a critical determinant of metabolic health, signaling fidelity, and stress resilience. Central to its maintenance are two primary NADPH-dependent antioxidant systems: the glutathione (GSH/GSSG) and thioredoxin (Trx) systems. NADPH serves as the essential electron donor, directly linking cellular metabolic state (via the pentose phosphate pathway, IDH, and ME1) to redox buffering capacity. Genetically encoded biosensors have revolutionized our ability to monitor the dynamics of these redox couples in real-time, within specific organelles, and in response to physiological stimuli or pathological insults. This whitepaper provides an in-depth technical guide to the current state of these biosensors, framed within the overarching thesis that precise, compartment-specific measurement of GSH/GSSG and Trx redox states is indispensable for understanding NADPH's role in redox homeostasis, signaling, and therapeutic targeting.
The Core Principles of Genetically Encoded Redox Biosensors
These biosensors are typically engineered fluorescent proteins (FPs) fused to redox-sensitive protein domains. Their fluorescence intensity (ratiometric or intensiometric) changes in response to the redox state of the fused domain, which equilibrates with the target cellular redox couple.
- For GSH/GSSG: Biosensors are based on redox-sensitive green fluorescent protein (roGFP) variants coupled to human glutaredoxin-1 (Grx1). Grx1 rapidly equilibrates roGFP's thiol-disulfide status with the GSH/GSSG pool. Popular versions include Grx1-roGFP2 and the more recently optimized Grx1-Orp1-roGFP2 for enhanced response kinetics.
- For Trx Redox State: Biosensors utilize roGFP fused directly to a specific redox-active motif from a Trx substrate or Trx itself. TrxRFP1 and Trx-roGFP2 are key examples, reporting on the redox state of the Trx system.
The readout is typically a ratio of fluorescence intensity at two excitation wavelengths (e.g., 400 nm and 480 nm for roGFP-based sensors), which is independent of sensor concentration and photobleaching, providing a robust quantitative measure.
Key Biosensors: Properties, Applications, and Quantitative Data
The following table summarizes the critical characteristics of leading biosensors for GSH/GSSG and Trx redox state.
Table 1: Genetically Encoded Biosensors for GSH/GSSG and Thioredoxin Redox State
| Biosensor Name | Redox Couple Reported | Core Architecture | Dynamic Range (ΔR/R₀) | Redox Midpoint Potential (E⁰′, mV, pH 7.0) | Key Features & Optimal Use Cases |
|---|---|---|---|---|---|
| roGFP2 | General Thiol Disulfide | roGFP alone | ~5-8 | -280 to -290 | Non-specific; responds to multiple redox couples. Use with caution for specific systems. |
| Grx1-roGFP2 | GSH/GSSG | roGFP2 fused to human Grx1 | ~6-8 | -315 to -325 | Gold standard for GSH/GSSG. Rapid equilibration (<5 min). Requires endogenous Grx/GSH system. |
| Grx1-Orp1-roGFP2 | GSH/GSSG | roGFP2 with Grx1 and yeast Orp1 | ~7-9 | ~ -310 | Faster equilibration kinetics (<2 min) due to Orp1 linker. Superior for detecting rapid transients. |
| Trx1-roGFP2 | Trx1 Redox State | roGFP2 fused to human Trx1 | ~4-5 | ~ -295 | Directly reports on Trx1 redox state. Sensitive to Trx reductase (TrxR) activity and NADPH. |
| TrxRFP1 | Trx Redox State | Redox-sensitive RFP (rxRFP) fused to Trx1 | ~2.5 (intensiometric) | ~ -290 | Enables multiplexing with GFP-based sensors. Ideal for dual-compartment imaging. |
| roGFP2-Tsa2ΔCR | Peroxiredoxin (Prx) Hyperoxidation | roGFP2 fused to yeast Tsa2 (Prx) | ~3-4 | N/A | Reports on H₂O₂ flux and Prx hyperoxidation, downstream of Trx system activity. |
Detailed Experimental Protocols
Protocol: Live-Cell Ratiometric Imaging of Grx1-roGFP2 for GSH/GSSG
Objective: To measure the real-time dynamics of the mitochondrial GSH/GSSG redox potential in HEK293T cells during oxidative stress.
Materials:
- Plasmid: pLPC-mito-Grx1-roGFP2 (Addgene #64985)
- Cells: HEK293T or other cell line of interest
- Imaging Medium: FluoroBrite DMEM (Thermo Fisher) supplemented with 10% FBS, 25 mM glucose, 1 mM pyruvate, and 10 mM HEPES (pH 7.4).
- Inducers/Inhibitors:
- Oxidant: tert-Butyl hydroperoxide (tBHP), 100-500 µM stock in PBS.
- Reductant: Dithiothreitol (DTT), 10 mM stock in water.
- GSH Synthesis Inhibitor: L-Buthionine-sulfoximine (BSO), 10 mM stock in water.
- Microscope: Confocal or widefield fluorescence microscope capable of rapid excitation switching at 405 nm and 488 nm, with emission collection at 510/20 nm.
Procedure:
- Transfection: Transfect cells with mito-Grx1-roGFP2 plasmid using a standard method (e.g., PEI, Lipofectamine 3000) 24-48 hours prior to imaging.
- Preparation: Plate transfected cells on poly-L-lysine-coated glass-bottom imaging dishes at a confluency of 50-70%.
- Calibration (In-Situ): At the end of each experiment, perfuse cells sequentially with:
- Full Oxidation: Imaging medium + 10 mM DTT (to fully reduce the sensor).
- Full Reduction: Imaging medium + 2 mM tBHP (to fully oxidize the sensor).
- Incubate for 5-10 minutes after each addition before imaging.
- Image Acquisition: Acquire ratiometric images.
- Capture two images per time point: one with 405 nm excitation, one with 488 nm excitation.
- Use identical exposure times and gains for all samples in an experiment.
- Acquire a baseline (3-5 time points) before applying experimental treatments (e.g., 200 µM tBHP, 100 µM BSO).
- Data Analysis:
- Generate a ratio image (405 nm/488 nm) for each time point using ImageJ/Fiji or microscope software.
- Measure the average ratio (R) within a defined cellular region of interest (e.g., mitochondria).
- Normalize the ratio from each time point (R) against the fully reduced (Rred) and fully oxidized (Rox) ratios obtained during calibration: Oxidation Degree = (R - Rred) / (Rox - R_red).
- Convert the Oxidation Degree to redox potential (Eh) using the Nernst equation: Eh = E⁰′ - (RT/nF) * ln([Red]/[Ox]), where [Red]/[Ox] = (1 - Oxidation Degree) / Oxidation Degree, and E⁰′ for Grx1-roGFP2 is -320 mV.
Protocol: Validating NADPH Dependence of Trx1-roGFP2 Signal
Objective: To demonstrate that changes in Trx1 redox state are directly dependent on NADPH availability via thioredoxin reductase (TrxR).
Materials:
- Plasmid: Cytosolic Trx1-roGFP2
- Inhibitors:
- TrxR Inhibitor: Auranofin (1-10 µM stock in DMSO).
- NADPH Synthesis Inhibitor (Glucose-6-P Dehydrogenase): 6-Aminonicotinamide (6-AN, 1-5 mM stock in water).
- Glucose-Free Imaging Medium
Procedure:
- Transfert and plate cells as in Protocol 4.1.
- Acquire a 5-minute baseline in normal glucose imaging medium.
- Intervention 1: Switch to glucose-free medium + 6-AN (1 mM) to inhibit NADPH production via the pentose phosphate pathway. Image for 20-30 minutes.
- Intervention 2: Add auranofin (2 µM) to the medium to directly inhibit TrxR. Image for an additional 20 minutes.
- Perform in-situ calibration as in Step 3 of Protocol 4.1.
- Analysis: Plot the normalized Trx1-roGFP2 oxidation degree over time. A gradual oxidation upon 6-AN addition, followed by a rapid, pronounced oxidation upon auranofin addition, confirms NADPH/TrxR dependence.
Visualizing Pathways and Workflows
Diagram 1: NADPH Drives Redox Systems & Biosensor Readout (100 chars)
Diagram 2: Live-Cell Biosensor Imaging & Analysis Workflow (98 chars)
The Scientist's Toolkit: Essential Research Reagents
Table 2: Key Research Reagent Solutions for Redox Biosensor Experiments
| Reagent / Material | Primary Function in Biosensor Research | Example Product / Note |
|---|---|---|
| Grx1-roGFP2 Plasmids | Express the biosensor in mammalian cells; organelle-targeted versions (mito, ER, nucleus) enable compartment-specific measurement. | Addgene #64985 (Mito), #64986 (Cytosol), #64987 (ER). |
| Trx1-roGFP2 Plasmids | Express the biosensor to monitor thioredoxin-1 redox state. | Available from original authors (Todtermunde et al., 2021) or commercial protein suppliers. |
| Auranofin | Potent and specific inhibitor of Thioredoxin Reductase (TrxR). Used to validate NADPH/TrxR dependence of Trx biosensor signal. | Sigma-Aldrift A6733. Use at 0.5-2 µM in cell culture. |
| L-Buthionine-sulfoximine (BSO) | Inhibitor of γ-glutamylcysteine synthetase, depletes cellular glutathione. Used to stress the GSH system and probe biosensor specificity. | Sigma-Aldrift B2515. Use at 100-500 µM for 12-24 hours. |
| tert-Butyl Hydroperoxide (tBHP) | Membrane-permeable organic hydroperoxide used as a controlled oxidant to challenge redox systems and for in-situ biosensor calibration. | Sigma-Aldrift 458139. Use at 100-500 µM for acute treatment. |
| Dithiothreitol (DTT) | Strong reducing agent. Used for in-situ calibration of biosensors to define the fully reduced state (R_red). | Thermo Fisher 20291. Use at 5-10 mM for calibration. |
| FluoroBrite DMEM | Low-autofluorescence imaging medium. Essential for high signal-to-noise live-cell ratiometric imaging. | Thermo Fisher A1896701. |
| Poly-L-Lysine Coating | Enhances adherence of cells to imaging dishes, preventing movement during time-series experiments. | Sigma-Aldrift P8920. |
| Lipofectamine 3000 | High-efficiency, low-toxicity transfection reagent for delivering biosensor plasmids to a wide range of mammalian cell lines. | Thermo Fisher L3000015. |
Nicotinamide adenine dinucleotide phosphate (NADPH) is the principal cellular reductant, essential for maintaining redox balance through the glutathione (GSH) and thioredoxin (Trx) systems. In oncology, many cancer cells exhibit a heightened dependence on NADPH to counteract oxidative stress associated with rapid proliferation, metabolic dysregulation, and oncogenic signaling. This whitepaper details a therapeutic strategy focused on depleting NADPH by targeting two key enzymes in its production: Glucose-6-phosphate dehydrogenase (G6PD) in the pentose phosphate pathway (PPP) and NAD(P)H:quinone oxidoreductase 1 (NQO1), often overexpressed in tumors. This approach is framed within the broader thesis that selective disruption of NADPH flux cripples the glutathione and thioredoxin antioxidant systems, leading to lethal oxidative damage in malignant cells.
Target Enzymes: G6PD and NQO1
G6PD catalyzes the first, rate-limiting step of the oxidative PPP, the primary source of cytosolic NADPH. Its activity is crucial for recycling oxidized glutathione (GSSG) back to its reduced form (GSH) via glutathione reductase (GR).
NQO1 is a two-electron reductase that utilizes NADPH to detoxify quinones, preventing their participation in redox cycling and generation of reactive oxygen species (ROS). Paradoxically, in the context of specific pro-drugs, NQO1 can be exploited to consume NADPH catalytically, leading to its depletion.
Table 1: Key Characteristics of G6PD and NQO1
| Characteristic | G6PD | NQO1 |
|---|---|---|
| Primary Function | NADPH generation (PPP) | Quinone detoxification (2-electron reduction) |
| Cofactor | NADP⁺ | NADPH / NADH |
| Cancer Association | Overexpression in many cancers (e.g., lung, pancreatic) | Frequently overexpressed (e.g., NSCLC, pancreatic, breast) |
| Consequence of Inhibition/Exploitation | Reduced NADPH production, impaired GSH regeneration | NADPH consumption, ROS generation from unmetabolized substrates |
| Example Inhibitor/Pro-drug | 6-aminonicotinamide (6-AN) | β-lapachone (ARQ761) |
Quantitative Data on NADPH Depletion and Efficacy
Table 2: Experimental Data from Key Studies
| Study Model | Intervention | Key Metric | Result | Outcome |
|---|---|---|---|---|
| Pancreatic Cancer Cell Line (MIA PaCa-2) | β-lapachone (NQO1 bioactivatable) | Intracellular NADPH levels | Decrease of ~70% within 30 min | Massive ROS increase, caspase-independent cell death (NAD⁺/ATP depletion) |
| Lung Adenocarcinoma (A549 Xenograft) | G6PD shRNA + Standard Chemo | Tumor Growth Inhibition | 85% reduction vs. control | Significant synergy with cisplatin, increased apoptosis |
| Triple-Negative Breast Cancer (MDA-MB-231) | 6-AN (G6PD inhibitor) + BSO (GSH inhibitor) | GSH/GSSG Ratio | Ratio decreased from ~20:1 to ~2:1 | Severe oxidative stress, synergistic cytotoxicity |
| NQO1+ vs. NQO1- Isogenic Cell Lines | β-lapachone | Cell Viability (IC₅₀) | IC₅₀: 2 µM (NQO1+) vs. >20 µM (NQO1-) | Demonstrates NQO1-dependent lethality |
Detailed Experimental Protocols
Protocol 4.1: Measuring NADPH/NADP⁺ Ratio Following NQO1 Bioactivation
- Objective: Quantify acute NADPH depletion after treatment with NQO1 bioactivatable agents (e.g., β-lapachone).
- Materials: Cultured cancer cells, β-lapachone, NADP/NADPH extraction buffer, NADPH/NADP⁺-Glo Assay (Promega).
- Method:
- Seed cells in a white-walled 96-well plate. Pre-treat with dicoumarol (NQO1 inhibitor) or vehicle for control.
- Treat cells with β-lapachone (e.g., 1-5 µM) for 15, 30, and 60 minutes.
- Lyse cells with the provided extraction buffer.
- For NADPH measurement, add an aliquot of lysate directly to the NADP/NADPH-Glo detection reagent (which selectively detects NADPH).
- For Total NADP(H) measurement, heat a separate aliquot at 60°C for 30 min to decompose NADP⁺, then add to detection reagent.
- Calculate NADP⁺ = Total NADP(H) – NADPH. Determine the NADPH/NADP⁺ ratio.
- Correlate with cell viability measured in parallel.
Protocol 4.2: Assessing Synergy Between G6PD Inhibition and Glutathione Synthesis Blockade
- Objective: Evaluate combinatorial oxidative stress via the GSH system.
- Materials: Cells, 6-Aminonicotinamide (6-AN), Buthionine sulfoximine (BSO), GSH/GSSG-Glo Assay, CellTiter-Glo for viability.
- Method:
- Treat cells in a matrix combination of 6-AN (0.1-1 mM) and BSO (0.1-1 mM) for 48 hours.
- GSH/GSSG Measurement: Lyse cells with TCA-based buffer to acidify. For total glutathione, neutralize an aliquot and detect with the luminescent assay. For GSSG, derivatize GSH in a separate aliquot with 2-vinylpyridine, then measure remaining GSSG.
- Calculate GSH = Total Glutathione – (2 x GSSG).
- Perform cell viability assay on treated cells.
- Analyze synergy using CompuSyn software and the Chou-Talalay method (Combination Index).
Signaling Pathways and Experimental Workflows
Diagram 1: NADPH Metabolism & Therapeutic Targeting
Diagram 2: Core Experimental Workflow
The Scientist's Toolkit: Key Research Reagent Solutions
Table 3: Essential Reagents for NADPH Depletion Research
| Reagent / Kit | Supplier Examples | Primary Function |
|---|---|---|
| β-Lapachone (ARQ761) | MedChemExpress, Selleckchem | NQO1 bioactivatable substrate; catalytically consumes NADPH. |
| 6-Aminonicotinamide (6-AN) | Sigma-Aldrich, Tocris | Competitive inhibitor of G6PD; blocks NADPH production via PPP. |
| NADP/NADPH-Glo Assay | Promega | Luminescent measurement of NADPH and total NADP(H) pools. |
| GSH/GSSG-Glo Assay | Promega | Quantitative determination of glutathione redox state (GSH:GSSG). |
| CellROX Green/Orange Reagents | Thermo Fisher Scientific | Flow cytometry or microscopy-based detection of intracellular ROS. |
| Buthionine Sulfoximine (BSO) | Cayman Chemical, Sigma-Aldrich | Inhibitor of γ-glutamylcysteine synthetase; depletes cellular GSH. |
| Dicoumarol | Sigma-Aldrich, Tocris | Pharmacological inhibitor of NQO1; essential control for NQO1-dependent effects. |
| Recombinant Human NQO1 / G6PD | Abcam, Sino Biological | Positive controls for enzyme activity assays and inhibitor studies. |
| Methylene Blue | Sigma-Aldrich | Alternative NQO1 substrate; used in spectrophotometric NQO1 activity assays. |
Nicotinamide adenine dinucleotide phosphate (NADPH) is a critical redox cofactor essential for maintaining cellular antioxidant defense systems. Within the context of neuroprotection, NADPH serves as the primary electron donor for the glutathione (GSH) and thioredoxin (Trx) systems, which are fundamental for detoxifying reactive oxygen species (ROS) and repairing oxidative damage. In neurodegenerative diseases (e.g., Alzheimer's, Parkinson's) and cerebral ischemic injury, oxidative stress is a pivotal pathogenic mechanism leading to neuronal death. Consequently, boosting intracellular NADPH levels presents a promising therapeutic strategy to enhance endogenous antioxidant capacity, thereby promoting neuronal survival. This whitepaper provides a technical guide on experimental approaches to augment NADPH in preclinical models of neurodegeneration and ischemia, framed within the broader thesis of NADPH's indispensable role in sustaining the GSH and Trx systems.
NADPH-Dependent Antioxidant Systems: Core Pathways
The Glutathione System
The tripeptide glutathione (γ-glutamyl-cysteinyl-glycine) exists in reduced (GSH) and oxidized (GSSG) states. Glutathione reductase (GR), a flavoenzyme, reduces GSSG back to GSH using NADPH as an electron donor. Maintaining a high GSH/GSSG ratio is crucial for cellular redox homeostasis, directly dependent on NADPH availability.
The Thioredoxin System
Thioredoxin (Trx) is a small redox protein that reduces disulfide bonds in target proteins. Oxidized Trx is regenerated by thioredoxin reductase (TrxR), a selenocysteine-containing enzyme that also requires NADPH. This system is vital for scavenging peroxides and regulating transcription factors like NF-κB and AP-1.
The functional interplay of these systems is outlined in the pathway diagram below.
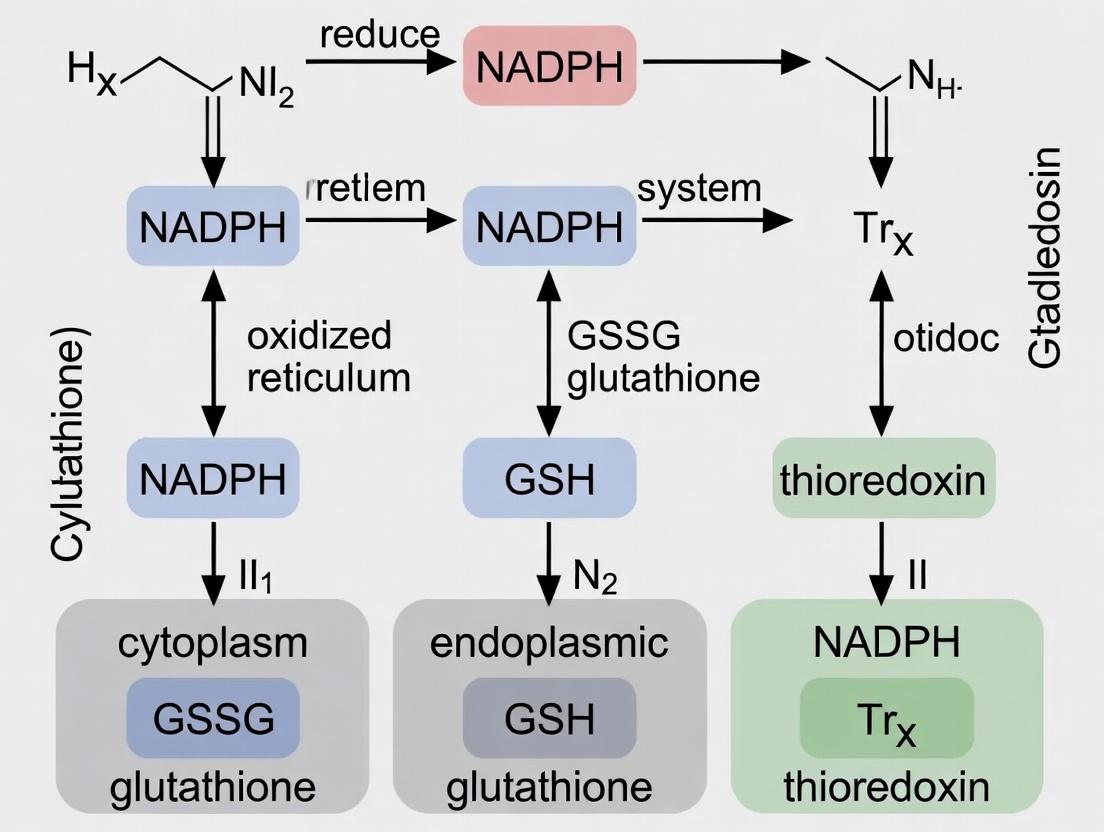
Diagram 1: NADPH fuels the glutathione and thioredoxin antioxidant systems.
Strategies to Boost NADPH for Neuroprotection
Multiple enzymatic pathways contribute to NADPH generation, offering distinct therapeutic targets.
Key NADPH-Generating Enzymes & Pharmacologic Modulators
| Enzyme/Pathway | Primary Role | Pharmacologic Activator/Substrate | Reported Efficacy in Models | Key Reference (Example) |
|---|---|---|---|---|
| Glucose-6-Phosphate Dehydrogenase (G6PD) | Rate-limiting enzyme in Pentose Phosphate Pathway (PPP). | Alda-1, 6-AN (inhibitor for study), recombinant enzyme. | ↑ Neuronal survival post-ischemia by ~40% in rat MCAO. | (Li et al., 2021) |
| Malic Enzyme 1 (ME1) | Catalyzes oxidative decarboxylation of malate to pyruvate, generating NADPH. | ME1 gene therapy, small-molecule enhancers (under investigation). | Reduced infarct volume by ~35% in mouse tMCAO model. | (Wang et al., 2023) |
| Isocitrate Dehydrogenase 1 (IDH1) | Cytosolic enzyme converting isocitrate to α-KG, producing NADPH. | AG-120 (Ivosidenib) - mutant IDH1 inhibitor; NADPH boost via WT IDH1 is indirect. | Context-dependent; mutant inhibition in glioma modulates redox. | (Waitkus et al., 2018) |
| Nicotinamide Nucleotide Transhydrogenase (NNT) | Mitochondrial enzyme coupling proton gradient to convert NADH to NADPH. | NNT overexpression via AAV vectors. | Protected dopaminergic neurons in MPTP mouse model (∼30%). | (Zhang et al., 2022) |
| NAD Kinase (NADK) | Phosphorylates NAD+ to form NADP+, precursor to NADPH. | NADK activators (e.g., compounds modulating Mg2+ availability). | In vitro: ↑ NADPH/NADP+ ratio by 2.5x in HT22 cells under ox stress. | (Pollak et al., 2021) |
| Salvage Pathway (NAMPT) | Rate-limiting for NAD+ synthesis from nicotinamide, upstream of NADPH. | P7C3, FK866 (inhibitor for study), NMN supplements. | Improved cognitive function in AD mouse model (∼25% on Morris water maze). | (Hou et al., 2022) |
Direct NADPH/Precursor Supplementation
| Compound | Mechanism | Model Tested | Outcome (Quantitative) | Delivery Challenge |
|---|---|---|---|---|
| NADPH (disodium salt) | Direct provision of cofactor. | In vitro neuronal cultures under glutamate toxicity. | 100 µM increased cell viability from 45% to 78%. | Poor cellular uptake, unstable in plasma. |
| Nicotinamide Riboside (NR) | Boosts NAD+ pool, potentially available for NADPH synthesis. | APP/PS1 Alzheimer's mice (oral gavage, 12 months). | Cortical NAD+ levels ↑ 50%; GSH/GSSG ratio improved by 30%. | Requires efficient conversion; tissue-specific effects. |
| Cytoprotective NADPH Precursor | Novel cell-permeable derivatives (e.g., NH001). | Rat photothrombotic stroke model (i.p. injection). | Infarct volume reduced by 55% at 24h; tissue NADPH ↑ 3-fold. | Under clinical development. |
Detailed Experimental Protocols
Protocol: Evaluating NADPH Boosters in a Murine Transient Middle Cerebral Artery Occlusion (tMCAO) Model
Aim: To assess the neuroprotective effect of the G6PD activator Alda-1 in cerebral ischemia.
Materials:
- Adult C57BL/6J mice (10-12 weeks, male, 22-25g).
- Alda-1 (Tocris), dissolved in 10% DMSO, 40% PEG300, 50% saline.
- Silicone-coated 6-0 monofilament (Doccol Corp).
- Laser Doppler Flowmetry (LDF) probe.
- NADPH/NADP+ Assay Kit (Colorimetric, Abcam ab65349).
- Glutathione Assay Kit (Fluorometric, Sigma MAK461).
- TTC (2,3,5-Triphenyltetrazolium chloride) solution (2%).
Procedure:
- Pre-treatment: Mice are randomized into Sham, Vehicle, and Alda-1 (20 mg/kg) groups (n=10/group). Alda-1 or vehicle is administered intraperitoneally 30 minutes before occlusion.
- tMCAO Surgery: Anesthesia is induced with 5% isoflurane and maintained at 1.5-2%. Body temperature is maintained at 37.0±0.5°C. The right common carotid artery (CCA), external carotid artery (ECA), and internal carotid artery (ICA) are exposed. A 6-0 silicone-coated filament is introduced via the ECA stump and advanced into the ICA to block the MCA origin. Cerebral blood flow (CBF) reduction to <20% baseline is confirmed by LDF. Occlusion is maintained for 60 minutes.
- Reperfusion: The filament is withdrawn to allow reperfusion (CBF recovery >80%). The ECA is ligated, and the incision closed.
- Post-treatment & Sacrifice: Alda-1/Vehicle is administered again at 12h post-reperfusion. At 24h post-reperfusion, mice are euthanized.
- Infarct Volume Analysis: Brains are rapidly removed, sliced into 1mm coronal sections, and incubated in 2% TTC at 37°C for 20 min. Viable tissue stains red (formazan), while infarcted tissue remains pale. Sections are imaged, and infarct volume (corrected for edema) is calculated using ImageJ software:
Infarct Volume (%) = (Contralateral Hemisphere Volume - Non-Infarcted Ipsilateral Volume) / Contralateral Hemisphere Volume * 100. - Biochemical Assay (Ipsilateral Cortex): Snap-frozen brain tissue is homogenized in assay-specific buffers. NADPH and total NADP+ levels are measured colorimetrically. The NADPH/NADP+ ratio is calculated. Total GSH and GSSG levels are measured fluorometrically to compute the GSH/GSSG ratio.
Protocol: In Vitro Assessment of NADPH Boosters in Glutamate-Induced Oxytosis (HT22 Cell Line)
Aim: To determine the cytoprotective effect of the NAD+ precursor Nicotinamide Mononucleotide (NMN) against glutamate toxicity.
Materials:
- HT22 mouse hippocampal neuronal cell line.
- NMN (Sigma), dissolved in PBS, filter-sterilized.
- L-Glutamate (Sigma), prepared in culture medium.
- CellTiter-Glo 2.0 Assay (Promega) for viability.
- ROS-Glo H2O2 Assay (Promega).
- GSH-Glo Glutathione Assay (Promega).
Procedure:
- Cell Culture & Treatment: HT22 cells are seeded in 96-well plates (5x10^3 cells/well) in DMEM + 10% FBS. After 24h, cells are pre-treated with NMN (0.5 mM, 1.0 mM) or vehicle for 6h.
- Oxytosis Induction: Culture medium is replaced with fresh medium containing 5 mM glutamate along with the respective pre-treatment (NMN/vehicle). Cells are incubated for 12h.
- Viability Assay: An equal volume of CellTiter-Glo 2.0 reagent is added to each well. After 10 min incubation, luminescence is recorded. Viability is normalized to the no-glutamate control group (100%).
- ROS Measurement: Concurrently, ROS-Glo reagent is used per manufacturer's protocol. Luminescence, proportional to H2O2 levels, is measured.
- GSH Measurement: The GSH-Glo assay is performed on separate wells. Luciferin-NT substrate is added, and luminescence (inversely proportional to GSH levels) is measured after glutathione S-transferase reaction.
- Data Analysis: IC50 values for protection are calculated. Statistical significance is determined via one-way ANOVA with post-hoc Tukey test (p<0.05).
Diagram 2: Workflow for in vitro neuroprotection assay in HT22 cells.
The Scientist's Toolkit: Key Research Reagent Solutions
| Reagent/Tool | Supplier Examples | Primary Function in NADPH/Neuroprotection Research |
|---|---|---|
| NADP/NADPH Assay Kit (Colorimetric/Fluorometric) | Abcam (ab65349), Sigma (MAK038), Promega (G9081) | Quantifies NADPH and total NADP+ levels to calculate the NADPH/NADP+ ratio, a key redox metric. |
| Glutathione Assay Kit (GSH/GSSG) | Sigma (MAK461), Cayman Chemical (703002), Promega (V6911) | Measures reduced and oxidized glutathione to determine GSH/GSSG ratio, indicating antioxidant capacity. |
| ROS Detection Probes (CellROX, DCFH-DA) | Thermo Fisher, Sigma | Cell-permeable fluorescent dyes that become fluorescent upon oxidation, allowing visualization and quantification of intracellular ROS. |
| G6PD Activity Assay Kit | Sigma (MAK015), BioVision (K757) | Directly measures the enzymatic activity of Glucose-6-Phosphate Dehydrogenase, a major NADPH source. |
| Recombinant Human NAMPT Protein | R&D Systems, Novus Biologicals | Used to study the effects of exogenous NAMPT or to supplement activity in models of NAD+ depletion. |
| Alda-1 (G6PD Activator) | Tocris (3991), Sigma (SML1088) | Small-molecule pharmacological tool to activate G6PD, used to test the protective role of the PPP. |
| FK866 (NAMPT Inhibitor) | Tocris (4815), Sigma (F8557) | Potent and specific inhibitor of NAMPT, used to deplete NAD+ pools and establish a stress model. |
| AAV-hNNT (serotype 9) | Vector Biolabs, Vigene Biosciences | Adeno-associated virus for in vivo overexpression of human Nicotinamide Nucleotide Transhydrogenase (NNT) in neural tissue. |
| Seahorse XFp Analyzer & Cell Mito Stress Test | Agilent Technologies | Measures real-time oxygen consumption rate (OCR) and extracellular acidification rate (ECAR) to assess metabolic function and mitochondrial health post-NADPH modulation. |
Boosting NADPH via modulation of its generating enzymes or precursor supply represents a validated and promising approach for neuroprotection across diverse injury models. The efficacy is largely mediated through enhanced fueling of the GSH and Trx systems, thereby mitigating oxidative damage. Future research must focus on developing brain-penetrant, specific pharmacological modulators of key enzymes like G6PD and ME1, optimizing delivery methods for NADPH precursors, and understanding the long-term consequences of NADPH elevation. Integrating these strategies with other therapeutic modalities may offer synergistic benefits for treating neurodegenerative and ischemic brain disorders.
1. Introduction within the NADPH Function Thesis Context This whitepaper is framed within a broader thesis investigating the pivotal role of NADPH as the central electron donor for cellular reductive antioxidant systems. The glutathione reductase (GSR) and thioredoxin reductase (TXNRD) enzyme families are critical NADPH-dependent oxidoreductases responsible for maintaining intracellular redox homeostasis. Their function—reducing oxidized glutathione (GSSG) and thioredoxin (Trx), respectively—is entirely contingent on NADPH availability and flux. Consequently, pharmacological modulation of GSR and TXNRD directly influences the redox balance, impacting pathways from oxidative stress response to cell proliferation and death. This guide provides a technical deep-dive into direct and indirect pharmacological agents targeting these enzymes, positioning them as key intervention points within the NADPH-linked redox network.
2. Direct Pharmacological Modulators Direct modulators bind to the active site or allosteric sites of GSR or TXNRD, precisely altering their catalytic activity.
2.1 Direct Inhibitors GSR Inhibitors: Carmustine (BCNU) is a classical inhibitor that carbamoylates the active-site cysteine residue, irreversibly inactivating the enzyme. TXNRD Inhibitors: Auranofin, a gold(I)-containing compound, potently and irreversibly inhibits TXNRD by coordinating with the selenocysteine residue in the enzyme's active site, making it a benchmark inhibitor in research and a candidate for repurposing in cancer and antimicrobial therapy.
2.2 Direct Activators* No potent, highly selective direct small-molecule activators of GSR are widely recognized. For TXNRD, supraphysiological levels of selenium (as selenite) can upregulate enzyme expression and incorporation of the essential selenocysteine, acting as an indirect transcriptional activator.
3. Indirect Pharmacological Modulators Indirect modulators affect enzyme activity by altering substrate/cofactor availability, post-translational modifications, or expression levels.
3.1 NADPH-Level Modulators The activity of both GSR and TXNRD is intrinsically linked to NADPH concentration. Inhibitors: Compounds that inhibit glucose-6-phosphate dehydrogenase (G6PD), the rate-limiting enzyme of the pentose phosphate pathway (PPP), deplete NADPH and thus indirectly inhibit GSR and TXNRD function. 6-Aminonicotinamide (6-AN) is a prototypical G6PD inhibitor. Activators: Activation of the PPP, for instance via Nrf2 agonists like sulforaphane which upregulate G6PD and other NADPH-generating enzymes, indirectly potentiates GSR and TXNRD activity by increasing NADPH supply.
3.2 Substrate-Level and Expression Modulators GSH Depletors: Buthionine sulfoximine (BSO) inhibits γ-glutamylcysteine synthetase, depleting glutathione (GSH). This increases the GSSG:GSH ratio, placing a high demand on GSR, effectively testing its capacity under stress. Pro-Oxidants: Agents like paraquat generate superoxide, leading to GSSG and oxidized Trx accumulation, indirectly increasing the enzymatic demand on both GSR and TXNRD. Transcriptional Regulators: The Nrf2-Keap1 pathway upregulates the expression of GSR, TXNRD1, and biosynthetic enzymes for GSH and NADPH. Pharmacological Nrf2 activators (e.g., bardoxolone methyl, dimethyl fumarate) thus indirectly increase the capacity of both systems.
4. Quantitative Data Summary
Table 1: Direct Inhibitors of GSR and TXNRD
| Compound | Target | IC50 / Ki | Mechanism of Action | Primary Research Context |
|---|---|---|---|---|
| Carmustine (BCNU) | GSR | ~10-50 µM | Irreversible carbamoylation of active-site Cys. | Glioblastoma research, chemosensitization. |
| Auranofin | TXNRD (Sec) | 0.1-0.5 µM | Irreversible inhibition via gold coordination to Sec. | Cancer, rheumatoid arthritis, antimicrobial. |
| DHEA | GSR | ~20 µM (Competitive vs NADPH) | Competitive inhibition with respect to NADPH. | Steroid metabolism & redox interplay studies. |
Table 2: Indirect Modulators via NADPH/Substrate Pathways
| Compound | Primary Target | Effect on GSR/TXNRD | Mechanism | Key Use |
|---|---|---|---|---|
| 6-Aminonicotinamide (6-AN) | G6PD | Indirect Inhibition | Depletes NADPH via PPP inhibition. | Studying NADPH dependency in cells. |
| Buthionine Sulfoximine (BSO) | γ-GCS | Indirect Challenge (Inhibits GSH synthesis) | Depletes GSH, increases GSSG, challenges GSR. | Creating glutathione deficiency models. |
| Sulforaphane | Nrf2-Keap1 | Indirect Potentiation | Upregulates GSR, TXNRD1, & NADPH-producing genes. | Chemoprevention, antioxidant response studies. |
5. Detailed Experimental Protocols
5.1 Protocol: Measuring TXNRD Activity Inhibition (Auranofin) Objective: Quantify direct inhibition of TXNRD activity by auranofin in cell lysates. Reagents: Recombinant TXNRD or cell lysate, NADPH (200 µM), DTNB (5,5'-dithio-bis-(2-nitrobenzoic acid); 2 mM), EDTA (1 mM), Auranofin (serial dilutions in DMSO), assay buffer (50 mM Tris-HCl, pH 7.5, 1 mM EDTA). Procedure:
- Prepare reaction mix: 150 µL assay buffer, 10 µL NADPH (final 100 µM), 10 µL DTNB (final 0.2 mM), and 20 µL of TXNRD source (diluted to give linear reaction).
- In a 96-well plate, add 10 µL of auranofin or vehicle (DMSO) to the reaction mix. Pre-incubate for 10 min at 25°C.
- Initiate reaction by adding 10 µL of NADPH (if not already present) or enzyme. Monitor the increase in absorbance at 412 nm (due to TNB²⁻ formation from DTNB reduction) for 3-5 minutes.
- Calculate activity as ∆A412/min. Plot residual activity vs. inhibitor concentration to determine IC50.
5.2 Protocol: Assessing Indirect Modulation via NADPH Depletion (6-AN) Objective: Evaluate the indirect effect of NADPH depletion on GSR-dependent GSSG recycling. Reagents: Cultured cells, 6-AN (1 mM stock), CellTiter-Glo 2.0 Assay (for NADPH/NADH), GSH/GSSG Ratio Detection Assay Kit, lysis buffer. Procedure:
- Treat cells with 6-AN (e.g., 10-100 µM) or vehicle for 24-48 hours.
- Harvest cells and split lysate for parallel assays.
- NADPH Measurement: Use CellTiter-Glo 2.0 (luminescence proportional to total NAD(P)H) or a specific enzymatic cycling assay for NADPH. Normalize to protein content.
- GSH/GSSG Ratio: Use a commercial kit based on TNB formation or fluorescent probes. A decreased ratio indicates impaired GSR capacity due to NADPH depletion.
- Correlate NADPH levels with GSH/GSSG ratio to establish the functional link.
6. Pathway and Workflow Visualizations
Diagram Title: Integrative View of GSR/TXNRD Modulation & NADPH Nexus
Diagram Title: Core Workflow for Evaluating GSR/TXNRD Modulators
7. The Scientist's Toolkit: Research Reagent Solutions
Table 3: Essential Reagents for GSR/TXNRD Research
| Reagent | Function & Application | Example Product/Source |
|---|---|---|
| Recombinant Human GSR/TXNRD | Positive control for enzyme activity assays, inhibitor screening, and kinetic studies. | Sigma-Aldrich, Cayman Chemical, Enzo Life Sciences. |
| Auranofin (Gold(I) complex) | Benchmark direct, irreversible inhibitor of TXNRD. Used as a control in TXNRD inhibition studies. | Tocris Bioscience, Sigma-Aldrich. |
| Carmustine (BCNU) | Classical direct inhibitor of GSR. Used to induce glutathione redox disruption. | MedChemExpress, Selleckchem. |
| GSH/GSSG Ratio Detection Kit | Fluorometric or colorimetric measurement of the reduced/oxidized glutathione pool to assess GSR functional output. | Cayman Chemical #703002, Abcam #ab239709. |
| NADPH/NADP+ Quantification Kit | Specific measurement of NADPH levels (often via enzymatic cycling) to assess cofactor availability. | Biovision #K347, Abcam #ab65349. |
| DTNB (Ellman's Reagent) | Chromogenic substrate used in TXNRD activity assays (measured at A412) and for total GSH estimation. | Sigma-Aldrich #D8130. |
| Insulin Disulfide Reduction Assay Reagents | Classic endpoint assay for TXNRD activity: TXNRD reduces insulin disulfides, measured by turbidity at A650. | Requires Insulin, NADPH, EDTA, DTT. |
| BSO (Buthionine Sulfoximine) | Inhibitor of γ-glutamylcysteine synthetase. Used to deplete cellular GSH and stress the GSR system. | Sigma-Aldrich #B2515. |
| CellTiter-Glo 2.0 Assay | Luminescent assay for cellular ATP and NAD(P)H, useful for indirect viability/energy/redox state screening. | Promega #G9242. |
| Nrf2 Activators (e.g., Sulforaphane) | Indirect modulators used to study the transcriptional upregulation of GSR, TXNRD, and NADPH-producing enzymes. | Cayman Chemical #14783. |
Overcoming Experimental Hurdles in NADPH-Dependent Redox Research
This whitepaper, framed within a broader thesis on NADPH function in glutathione and thioredoxin systems research, addresses critical technical challenges in enzyme activity assays. Accurate measurement of enzymes like glutathione reductase (GR), thioredoxin reductase (TrxR), and glutathione peroxidase (GPx)—all pivotal in cellular redox homeostasis and dependent on NADPH—is essential for fundamental biochemistry and drug discovery. Suboptimal assay design leads to erroneous kinetic parameters and flawed conclusions.
Substrate Stability: The Foundation of Reliable Kinetics
The instability of key substrates, notably NADPH, is a primary source of error. NADPH degrades under assay conditions, leading to overestimation of enzyme activity if not corrected.
Key Quantitative Data on Substrate Stability
Table 1: Stability of NADPH under Common Assay Conditions
| Condition (pH 7.4, 25°C) | Half-life (minutes) | Degradation Rate (nM/min) | Primary Degradation Product |
|---|---|---|---|
| In buffer alone | 120-180 | ~2-4 | NADP+ |
| With 1 mM EDTA | >300 | <1 | NADP+ |
| Exposed to ambient light | 60-90 | 5-8 | Photo-products |
| In cell lysate background | 30-50 | 10-20 | NADP+ and others |
Experimental Protocol for Assessing NADPH Stability:
- Reagent Preparation: Prepare 100 µM NADPH in your standard assay buffer (e.g., 50 mM potassium phosphate, pH 7.4, with 1 mM EDTA).
- Baseline Measurement: Aliquot the NADPH solution into a microplate or cuvette. Immediately measure the absorbance at 340 nm (A340) every minute for 5 minutes to establish an initial stable baseline.
- Long-term Monitoring: Continue measuring A340 at 5-minute intervals for 60-120 minutes while maintaining the assay temperature (e.g., 25°C or 37°C). Shield the sample from light.
- Data Analysis: Plot A340 vs. time. The slope of the linear phase of decay represents the non-enzymatic degradation rate. Use this rate to correct subsequent enzyme assay rates.
Coupling Reactions: Ensuring Linear and Proportional Response
Many assays for redox enzymes use coupled systems. For example, GR activity is often linked to DTNB (5,5'-dithio-bis-(2-nitrobenzoic acid)) reduction, monitoring TNB formation at 412 nm. Inefficient coupling leads to lag phases and underestimation of activity.
Table 2: Common Coupling Enzymes and Their Pitfalls
| Coupling System | Target Enzyme | Monitor Wavelength | Common Pitfall | Recommended Optimization |
|---|---|---|---|---|
| DTNB (Ellman's reagent) | GR, TrxR | 412 nm | Non-enzymatic reduction by low MW thiols | Include Thiol Scavengers (e.g., NEM) |
| NADPH oxidation direct | GR, TrxR | 340 nm | High background from NADPH instability | Use robust blank correction (see Section 3) |
| Coupled GPx assay (GR+NADPH) | GPx | 340 nm | Lag phase if GR is limiting | Use 2-5 U/mL excess GR |
Experimental Protocol for Validating a Coupled Assay (GPx Example):
- Reaction Mix: Prepare in a cuvette: 50 mM Tris-HCl (pH 7.6), 1 mM EDTA, 1 mM sodium azide (inhibits catalase), 0.24 U/mL GR, 1 mM GSH, 0.16 mM NADPH.
- Pre-incubation: Incubate at 25°C for 5 minutes to allow stabilization and consume any endogenous peroxides.
- Initiation: Start the reaction by adding both the peroxide substrate (e.g., 0.2 mM tert-butyl hydroperoxide) and the GPx enzyme sample.
- Validation: The initial lag phase should be <30 seconds. The linear decrease in A340 over 2-3 minutes is proportional to GPx activity. Vary the amount of GPx to confirm linearity of rate vs. enzyme concentration.
Blank Corrections: Isolating the Enzymatic Signal
Improper blanking is perhaps the most common procedural error, profoundly affecting assays with high background like NADPH-dependent reactions.
Detailed Blank Correction Methodology:
- True Reaction Blank: Contains all components except the enzyme source, which is replaced by an equal volume of buffer or a heat-inactivated enzyme sample. This corrects for non-enzymatic substrate decay and any chemical side-reactions.
- Sample Background Blank: Contains the enzyme source but not the primary substrate. This corrects for any inherent activity in the sample (e.g., other NADPH-oxidizing enzymes) or turbidity. For GR, this would contain cell lysate and DTNB, but no oxidized glutathione (GSSG).
- Protocol for a Dual-Blank Corrected GR Assay:
- Prepare three sets of reactions in parallel.
- Set A (Complete): Buffer + NADPH + GSSG + DTNB + Enzyme.
- Set B (True Reaction Blank): Buffer + NADPH + GSSG + DTNB + Buffer (no enzyme).
- Set C (Sample Background Blank): Buffer + NADPH + Buffer (no GSSG) + DTNB + Enzyme.
- Measure A412 increase over time. Corrected Rate = Rate(A) - Rate(B) - Rate(C).
The Scientist's Toolkit
Table 3: Research Reagent Solutions for Robust NADPH-linked Assays
| Item | Function & Rationale |
|---|---|
| NADPH, Lithium Salt | More stable and soluble than sodium salt; essential electron donor for GR/TrxR. |
| Recombinant Coupling Enzymes (e.g., GR) | High-specific-activity, contaminant-free enzymes ensure efficient coupling reactions. |
| DTNB (Ellman's Reagent) | Chromogenic thiol detector; used to monitor GSH generation in GR assays. |
| EDTA (0.5-1 mM in buffers) | Chelates divalent cations, reducing metal-catalyzed oxidation of NADPH and thiols. |
| N-Ethylmaleimide (NEM) | Thiol scavenger; added to coupling assays to quench background non-enzymatic reduction. |
| Microplate Reader with Temperature Control | Essential for high-throughput, stable kinetic measurements across multiple samples. |
| UV-transparent Microplates | Ensure accurate low-wavelength (340 nm) absorbance readings for NADPH oxidation. |
Visualizing Pathways and Workflows
NADPH in Glutathione Redox Cycle
GR Activity Assay & Correction Workflow
Optimizing Cell Lysis and Extraction Buffers to Preserve Labile NADPH Pools and Redox States
This guide is framed within the broader thesis that precise measurement of cellular NADPH is critical for understanding its function as the central electron donor in redox homeostasis, primarily through the glutathione (GSH/GSSG) and thioredoxin (Trx) systems. NADPH drives glutathione reductase (GR) and thioredoxin reductase (TrxR), maintaining reduced pools of GSH and Trx that mitigate oxidative stress, regulate signaling, and support biosynthesis. The lability of NADPH and the dynamic nature of these redox couples make their preservation during cell disruption a major technical challenge. Inaccurate measurements can lead to erroneous conclusions about cellular redox capacity and its implications in disease and drug response.
The Core Challenge: NADPH Lability During Extraction
NADPH is susceptible to rapid enzymatic degradation (e.g., by NADPases) and chemical oxidation during cell lysis. Furthermore, the GSH/GSSG and Trx redox states can shift artifacts if lysis conditions are not appropriately controlled. Key factors influencing preservation include:
- pH: Alkaline conditions stabilize NADPH but can hydrolyze other components. Near-neutral pH is often a compromise.
- Temperature: Rapid cooling and processing at 0-4°C is non-negotiable.
- Chemical Stabilizers: Inclusion of inhibitors and chelators to block degradation pathways.
- Speed: Extraction must be faster than the degradation rate.
Optimized Buffer Formulations: A Comparative Analysis
Based on current literature and protocols, the following table summarizes optimized buffer compositions for preserving NADPH and associated redox couples.
Table 1: Comparative Analysis of Optimized Extraction Buffers
| Component | Acidic Extraction (e.g., for HPLC) | Alkaline Extraction (e.g., for enzymatic cycling) | Neutral Stabilizing Buffer (for redox couples) | Function and Rationale |
|---|---|---|---|---|
| Base Buffer | 0.1-0.2 M HCl or 0.1 M Formic Acid | 0.1-0.2 M NaOH | 50-100 mM Potassium Phosphate, HEPES, or CHES | Acid/alkaline denatures enzymes instantly; neutral buffer requires additional inhibitors. |
| pH | ~2.0 | ~12.0 | 7.0-8.0 (with adjustments) | Extreme pH halts enzyme activity. Neutral pH must be carefully controlled. |
| Chaotrope/Denaturant | --- | --- | 0.1% Triton X-100 or 6-8 M Urea | Aids in complete lysis and protein denaturation to stop enzyme activity. |
| NADPH Stabilizer | --- | 1-5 mM Cysteine (fresh) | 0.1-1 mM DTT or TCEP (controversial for GSH) | Cysteine in alkali protects NADPH from degradation. DTT/TCEP can artificially reduce pools; use with caution for endpoint measurements. |
| Metalloenzyme Inhibitor | --- | --- | 1-10 mM EDTA or EGTA | Chelates metals required for many phosphatases and oxidases. |
| Protease/Enzyme Inhibitor | --- | --- | Complete protease inhibitor cocktail | Prevents protein degradation that could release bound NADPH or enzymes. |
| Specialized Additives | --- | --- | 10-50 mM N-Ethylmaleimide (NEM) or Iodoacetate | Critical for GSH/GSSG: Alkylates and "freezes" free thiols instantly upon lysis to prevent air oxidation and thiol-disulfide exchange. Must be added immediately to lysate. |
| Processing Temp | 0-4°C (on ice) | 0-4°C (on ice) | 0-4°C (on ice) | Slows all chemical degradation pathways. |
| Key Advantage | Complete, instantaneous enzyme quenching. | Stabilizes NADPH specifically for cycling assays. | Preserves native redox states of GSH/GSSG and Trx for accurate ratio determination. | |
| Key Disadvantage | Not compatible with many enzymatic assays; may hydrolyze NADPH over time. | Harsh conditions may degrade other metabolites. | Buffer components may interfere with downstream assays if not removed. |
Detailed Experimental Protocols
Protocol 4.1: Rapid-Freeze Clamp and Acid Extraction for Total NADP(H) (HPLC/MS)
Principle: Instantaneous thermal and chemical inactivation of metabolism.
- Cell/Tissue Arrest: Use a Wollenberger clamp pre-cooled in liquid N₂. Squeeze sample (~100 mg) between metal blocks, freeze in <1 sec.
- Pulverization: Transfer frozen wafer to a mortar or cryomill under liquid N₂, grind to a fine powder.
- Acidic Extraction: Weigh powder into cold 0.2 M HCl (or 80:20 MeOH:Water with 0.1 M Formic Acid). Vortex vigorously for 60 sec.
- Clarification: Centrifuge at 16,000 x g, 10 min, 4°C.
- Neutralization: For some assays, collect supernatant and neutralize immediately with 0.2 M NaOH/0.1 M KPO₄ buffer. Keep on ice.
- Analysis: Analyze supernatant directly via HPLC with UV/fluorescence detection or LC-MS/MS.
Protocol 4.2: NEM-Alkylated Lysis for Preserving GSH/GSSG Redox State
Principle: Rapid lysis with thiol alkylation to "trap" the in vivo redox state.
- Prepare Ice-Cold Lysis Buffer: 100 mM Potassium Phosphate, 5 mM EDTA, 0.1% Triton X-100, pH 7.0. Keep on ice.
- Prepare Alkylation Solution: 100 mM N-Ethylmaleimide (NEM) in water or buffer. Prepare fresh and keep on ice in the dark.
- Harvest Cells: For adherent cells, quickly aspirate media, wash once with cold PBS, and place plate on ice.
- Rapid Lysis & Alkylation: Add cold lysis buffer to cells. Immediately after adding buffer, add NEM solution to a final concentration of 20 mM. Scrape cells and transfer the lysate to a pre-cooled microfuge tube within 10-15 seconds of buffer addition.
- Vortex & Incubate: Vortex 10 sec, incubate on ice for 5 min.
- Deproteinization: Add an equal volume of 10% (w/v) metaphosphoric acid, vortex, incubate 5 min on ice.
- Clarification: Centrifuge at 16,000 x g, 10 min, 4°C.
- Analysis: Use the supernatant for enzymatic recycling assays for total GSH and GSSG. NEM does not interfere with the standard GR-DTNB assay.
Visualization of Pathways and Workflows
Diagram Title: NADPH-Driven Glutathione & Thioredoxin Redox Systems
Diagram Title: Optimized Sample Processing Workflow Decision Tree
The Scientist's Toolkit: Essential Research Reagent Solutions
Table 2: Key Reagents for NADPH & Redox State Preservation Experiments
| Reagent / Solution | Function / Rationale | Critical Notes |
|---|---|---|
| N-Ethylmaleimide (NEM) | Thiol-specific alkylating agent. Instantly "freezes" reduced thiols (GSH, reduced Trx) upon lysis to prevent post-lysis oxidation and scrambling. | Must be fresh. Light-sensitive. Optimize concentration (10-50 mM final) to avoid under- or over-alkylation. |
| Metaphosphoric Acid (MPA) | Protein precipitant and acidifying agent. Preserves acid-labile metabolites like NADPH and GSH during deproteinization. | Prepare as 5-10% (w/v) solution. Supernatant is stable for several hours on ice. |
| Perchloric Acid (PCA) | Strong acid for deproteinization and instantaneous enzyme inactivation. Effective for a wide range of metabolites. | Requires subsequent neutralization with KOH/K₂CO₃ to form insoluble KClO₄, which is removed by centrifugation. |
| Triethanolamine (TEA) / CHES Buffer | Alkaline buffers used in NADPH-specific enzymatic cycling assays. Help stabilize NADPH during extraction and assay. | Typical pH range 8.0-8.5. Provides optimal environment for glutathione reductase in cycling assays. |
| Phenylmethanesulfonyl Fluoride (PMSF) | Serine protease inhibitor. Prevents degradation of redox-regulatory enzymes that could alter metabolite pools. | Short half-life in aqueous solution; add to buffer just before use. Toxic. |
| Dimethyl succinate + Iodoacetamide | Sequential alkylation strategy for proteomic analysis of thiol redox states (OxICAT). Iodoacetamide alkylates newly reduced thiols post-lysis. | Used for advanced, global redox proteomics studies alongside NADPH pool measurements. |
| NADPH Standard, Lithium Salt | High-purity standard for calibration curves in HPLC or enzymatic assays. Lithium salt offers superior stability and solubility. | Store desiccated at -20°C. Make fresh solutions daily for accurate quantification. |
| Glutathione Reductase (GR), from yeast | Essential enzyme for enzymatic recycling assays for GSH/GSSG and for NADPH consumption assays. | High specific activity is crucial for sensitive cycling assays. Keep on ice. |
Within the broader thesis of NADPH function in glutathione and thioredoxin systems research, a central challenge is dissecting whether observed phenotypes are directly attributable to NADPH redox coupling or are secondary consequences of system-wide metabolic perturbation. This technical guide provides a framework for designing experiments that isolate NADPH-specific roles, with a focus on quantitative metrics and stringent controls.
NADPH serves as the exclusive reducing cofactor for both the glutathione (GSH) and thioredoxin (Trx) antioxidant systems. In phenotypic studies—ranging from cancer cell proliferation to neuronal oxidative stress—a change in NADPH levels or NADPH/NADP⁺ ratio can simultaneously affect:
- Glutathione System: Via glutathione reductase (GR).
- Thioredoxin System: Via thioredoxin reductase (TrxR).
- Other NADPH-Dependent Processes: Including NADPH oxidases (NOX), cytochrome P450 enzymes, and biosynthetic pathways. Attributing an observed effect specifically to NADPH's role in one system requires disentangling these interconnected networks and controlling for compensatory mechanisms.
Core Quantitative Metrics for NADPH Function
To establish causality, the following parameters must be measured concurrently. Table 1 summarizes key quantitative benchmarks.
Table 1: Core Quantitative Metrics for NADPH-Specific Analysis
| Metric | Typical Assay/Method | Significance for Direct Effect | Representative Baseline Value (Mammalian Cell) |
|---|---|---|---|
| NADPH/NADP⁺ Ratio | Enzymatic cycling or LC-MS/MS | Primary indicator of reductive redox capacity. | 10:1 to 100:1 (cytosol) |
| Total GSH/GSSG | DTNB recycling assay | Pool size and oxidation state of glutathione system. | [GSH] 1-10 mM; GSH/GSSG >100:1 |
| Trx1 (Reduced/Oxidized) | Redox western blot with maleimide probes | Oxidation state of the thioredoxin system. | >90% reduced (cytosol) |
| NADPH Consumption Rate | ΔA340 with substrate (e.g., GSSG) | Direct enzymatic activity of GR/TrxR. | GR: 50-150 nmol/min/mg protein |
| ROS (e.g., H₂O₂) | Genetically-encoded sensors (HyPer) or fluorescent probes (CM-H2DCFDA) | Functional output of antioxidant failure. | Cell-type dependent |
Experimental Protocols for Isolating Direct Effects
Protocol: Genetic Uncoupling of NADPH Consumption
Objective: To determine if a phenotype requires NADPH consumption by a specific system (GR or TrxR). Method:
- Knockdown/CRISPRi: Target glutathione reductase (GSR) or thioredoxin reductase 1 (TXNRD1).
- Rescue Constructs: Express wild-type (WT) or enzyme-dead (e.g., Cys→Ser in redox-active site) cDNA variants of the target gene in knockdown cells. The enzyme-dead mutant acts as a "client protein placeholder" that maintains potential protein-protein interactions but lacks NADPH consumption.
- Phenotypic Assay: Measure cell viability/proliferation under oxidative stress (e.g., 100-500 μM H₂O₂) or specific inhibitors (e.g., Auranofin for TrxR).
- Key Control: Verify that rescue with WT enzyme restores NADPH consumption rate (Table 1 metric) and phenotype, while the enzyme-dead mutant does not, despite similar expression levels. This confirms the phenotype is tied to NADPH turnover, not just physical presence of the protein.
Protocol: Compartment-Specific NADPH Pool Modulation
Objective: To test if phenotypes are driven by NADPH dynamics in specific subcellular locales (cytosol vs. mitochondria). Method:
- Targeted Enzymes: Use constructs for cytosolic (cICDH) vs. mitochondrial (mICDH) isocitrate dehydrogenase, the primary NADPH-producing enzymes.
- Overexpression/Knockdown: Manipulate these enzymes individually and measure compartment-specific NADPH/NADP⁺ ratios using targeted fluorescent biosensors (e.g., Apollo-NADP⁺ for cytosol vs. mito).
- Pathway-Specific Readout: In parallel, assay system-specific outputs: GSH/GSSG (primarily cytosolic) and mitochondrial peroxiredoxin 3 oxidation state (for mitochondrial Trx2 system).
- Analysis: Correlate compartmental NADPH changes with system-specific redox changes and the phenotype. A direct effect will show tight correlation between, e.g., mitochondrial NADPH depletion, Prx3 oxidation, and the onset of apoptosis.
Protocol: Kinetic Dissection Using System-Specific Inhibitors
Objective: To pharmacologically isolate the contribution of each NADPH-dependent system to a rapid phenotypic change. Method:
- Pre-treatment: Apply system-specific inhibitors:
- Glutathione System: Buthionine sulfoximine (BSO, inhibits GSH synthesis) or 2-AAPA (inhibits GR).
- Thioredoxin System: Auranofin (inhibits TrxR) or PX-12 (inhibits Trx1).
- Time-Course: Induce a stress (e.g., glucose withdrawal to lower NADPH production) and measure parameters from Table 1 at T=0, 15, 30, 60, 120 minutes.
- Modeling: Plot the rate of change (kinetics) of NADPH depletion, GSSG accumulation, and Trx oxidation. The system whose inhibition most closely mimics the kinetics of the full phenotypic response is likely the primary, direct NADPH consumer responsible.
The Scientist's Toolkit: Essential Research Reagents
Table 2: Key Reagent Solutions for NADPH Phenotypic Studies
| Reagent / Tool | Category | Primary Function in This Context |
|---|---|---|
| Auranofin | Small Molecule Inhibitor | Potent and relatively selective inhibitor of Thioredoxin Reductase (TrxR). Used to block NADPH flow into the Trx system. |
| Buthionine Sulfoximine (BSO) | Small Molecule Inhibitor | Inhibits γ-glutamylcysteine synthetase, depleting cellular glutathione (GSH). Uncovers phenotypes dependent on the GSH system. |
| siRNA/CRISPR vs. GSR, TXNRD1 | Genetic Tools | For stable, specific knockdown/knockout of glutathione reductase or thioredoxin reductase 1. |
| roGFP2-Orp1 / Grx1-roGFP2 | Genetically-Encoded Sensor | roGFP2-Orp1 reports specific H₂O₂ levels; Grx1-roGFP2 reports glutathione redox potential (EGSH). Allows real-time, compartment-specific measurement. |
| Apollo-NADP⁺ Sensor | Genetically-Encoded Sensor | Ratiometric sensor for NADPH/NADP⁺ ratio. Targeted versions allow measurement in cytosol, mitochondria, or nucleus. |
| PNA-Biotin / PEG-Mal | Biochemical Probes | Polyethyleneglycol-maleimide (PEG-Mal) labels free protein thiols; used in redox western to quantify reduced vs. oxidized Trx or Prx. |
| Recombinant Human GR/TrxR | Enzyme | Positive control for activity assays. Essential for in vitro validation of inhibitor efficacy or NADPH consumption rates. |
Visualizing Pathways and Workflows
NADPH Drives Glutathione & Thioredoxin Systems
Decision Flowchart: Direct vs Indirect NADPH Role
Addressing the Challenge of Compartment-Specific NADPH Measurement in Intact Cells
NADPH is the essential electron donor for both the glutathione (GSH) and thioredoxin (Trx) antioxidant systems, which are compartmentalized within the cytosol, mitochondria, and nucleus. Understanding localized redox imbalances requires precise, compartment-specific NADPH quantification, a significant technical hurdle in intact, living cells. This guide details current methodologies within the broader thesis that dysregulated NADPH dynamics in specific compartments are a root cause of pathological oxidative stress, impacting drug mechanisms in cancer, neurodegeneration, and metabolic diseases.
Quantitative Landscape of Cellular NADPH Pools
Recent studies using genetically encoded sensors have begun to quantify baseline NADPH ratios and concentrations across compartments. The following table summarizes key quantitative findings.
Table 1: Compartment-Specific NADPH Levels and Ratios in Mammalian Cells
| Cellular Compartment | Reported NADPH:NADP⁺ Ratio (Range) | Estimated [NADPH] (μM) | Primary Antioxidant System | Key Measurement Method |
|---|---|---|---|---|
| Cytosol | 10:1 to 100:1 | 50 - 100 | Glutathione (GSH) System | iNAP1 sensor, enzymatic assay |
| Mitochondria | 20:1 to 200:1 | 30 - 80 | Both GSH & Thioredoxin (Trx) | Peredox-mito, SoNar-mito |
| Nucleus | ~5:1 to 50:1 (inferred) | 10 - 30 (inferred) | Thioredoxin (Trx) System | Indirect, NLS-targeted sensors |
Core Methodologies for Compartment-Specific Measurement
Genetically Encoded Fluorescent Biosensors (Primary Method)
These are fusion proteins comprising a NADPH-binding domain (e.g., Rex from B. subtilis) coupled to a pair of fluorescent proteins (FPs) for Förster Resonance Energy Transfer (FRET) or a single circularly permuted FP.
Protocol: Live-Cell Imaging with iNAP Sensors
- Sensor Expression: Transfect cells with plasmid vectors encoding compartment-targeted sensors (e.g., iNAP1 for cytosol, iNAP3 for mitochondria, iNAP4 for endoplasmic reticulum). Use appropriate targeting sequences: COX8 presequence for mitochondria, NLS for nucleus.
- Imaging Setup: Culture cells on glass-bottom dishes. Use a confocal or widefield fluorescence microscope with environmental control (37°C, 5% CO₂).
- Dual-Excitation Ratiometric Measurement:
- Excitation: Alternate between 405 nm (NADPH-sensitive) and 488 nm (isosbestic reference) lasers.
- Emission: Collect at 510-550 nm.
- Calculation: The ratio (R) = Fluorescence(405ex)/Fluorescence(488ex). R correlates directly with [NADPH].
- Calibration: Perform in situ calibration post-experiment using 10 μM rotenone (to minimize NADPH) followed by 50 μM phenylethyl isothiocyanate (to maximize NADPH) to define Rmin and Rmax. [NADPH] is calculated using the formula: [NADPH] = K_d * ((R - Rmin)/(Rmax - R)).
Table 2: Key Research Reagent Solutions
| Reagent/Tool | Function & Application |
|---|---|
| iNAP1, iNAP3, iNAP4 | Genetically encoded biosensors for cytosolic, mitochondrial, and ER NADPH, respectively. |
| SoNar / Frex Family | Single-wavelength, intensiometric sensors for high-throughput screening. |
| Peredox (T-Rex) | FRET-based sensor reporting the NADPH:NADP⁺ ratio. |
| Rothenone & Antimycin A | Inhibitors of mitochondrial Complex I & III used to perturb mitochondrial NADPH. |
| Glucose-6-Phosphate Dehydrogenase (G6PD) Inhibitor (e.g., 6-AN) | Blocks pentose phosphate pathway to deplete cytosolic NADPH. |
| Methylene Blue | Electron acceptor that oxidizes NADPH, used for calibration. |
Enzymatic Cycling Assays on Subcellular Fractions
A complementary approach requiring cell disruption and fractionation.
Protocol: Mitochondrial Isolation followed by NADPH Assay
- Cell Fractionation: Use digitonin permeabilization or differential centrifugation to isolate intact mitochondria (e.g., using a Mitochondrial Isolation Kit). Validate purity via Western blot for compartment markers (e.g., VDAC1 for mitochondria, LDH for cytosol).
- Metabolite Extraction: Rapidly lyse the mitochondrial pellet in 0.1M NaOH (for NADPH) or 0.1M HCl (for NADP⁺) at 80°C, then neutralize.
- Enzymatic Cycling Reaction:
- Prepare assay buffer: 50 mM Tris-HCl (pH 8.0), 0.5 mM EDTA, 5 mM MgCl₂, 0.1 mg/ml BSA, 0.2 mM thiazolyl blue (MTT), 2 mM phenazine ethosulfate (PES).
- To 50 μL sample, add 100 μL assay buffer + 0.5 U glucose-6-phosphate dehydrogenase (G6PD).
- Initiate reaction with 2 mM glucose-6-phosphate. The cycle is: NADP⁺ + G6P → 6PG + NADPH; NADPH + PES → NADP⁺ + PESH₂; PESH₂ + MTT → Formazan (blue) + PES.
- Measure absorbance at 570 nm over 10-20 minutes. Compare to an NADPH standard curve.
Integrated Signaling Pathways & Experimental Workflow
The compartmentalized NADPH systems interact with core cellular pathways. The following diagrams illustrate these relationships and a standard experimental workflow.
Title: NADPH Sources and Antioxidant Systems by Compartment
Title: Workflow for Compartment-Specific NADPH Measurement
Accurate, compartment-resolved NADPH measurement is now achievable through integrated use of targeted biosensors and biochemical validation. This capability is pivotal for testing the central thesis that compartment-specific NADPH deficits drive disease-specific redox vulnerabilities. Future advancements in near-infrared biosensors and multiplexed imaging with other redox probes will further empower drug development, enabling the precise targeting of NADPH metabolism in defined cellular locales.
This guide is framed within the context of investigating NADPH-dependent redox systems, specifically the glutathione (GSH) and thioredoxin (Trx) pathways, which are critical for maintaining cellular redox homeostasis, antioxidant defense, and signaling. Genetically encoded biosensors, such as roGFP (redox-sensitive GFP) or HyPer, are indispensable tools for real-time, compartment-specific monitoring of redox states (e.g., GSH/GSSG, NADPH/NADP+ ratios, H2O2 levels). A persistent low signal from these biosensors compromises data integrity, leading to erroneous conclusions about cellular redox status. This whitepaper provides an in-depth technical analysis for diagnosing and resolving the principal issues leading to low signal: poor expression, improper calibration, and signal quenching.
Core Issue Diagnosis: A Systematic Approach
Low biosensor signal can originate at multiple stages. The following flowchart maps the logical troubleshooting pathway.
Diagram Title: Logical Flow for Low Signal Troubleshooting
Primary Cause 1: Suboptimal Biosensor Expression
Low expression is the most common culprit. For NADPH redox research, sensors like roGFP2-Orp1 (H2O2) or Grx1-roGFP2 (GSH/GSSG) must be sufficiently abundant.
Experimental Protocol: Validating Expression
- Microscopy Check: Image live cells using both excitation channels (e.g., 400 nm and 480 nm for roGFP). A weak signal in both channels suggests low expression.
- Western Blot Analysis:
- Lyse transfected cells in RIPA buffer with protease inhibitors.
- Run 20-30 µg protein on a 10-12% SDS-PAGE gel.
- Transfer to PVDF membrane, block with 5% BSA.
- Probe with primary antibody (e.g., anti-GFP, 1:2000) overnight at 4°C.
- Use HRP-conjugated secondary antibody and chemiluminescent detection.
Optimization Strategies:
- Promoter Selection: Use strong, constitutive promoters (CMV, EF1α) or inducible systems (Tet-On). For sensitive cell lines, consider weaker promoters (PGK) to avoid toxicity.
- Codon Optimization: Ensure the biosensor gene is optimized for your host organism (e.g., human, mouse, yeast).
- Transfection/Transduction: Optimize reagent:DNA ratio or viral titer. Use stable cell lines for consistent expression.
Primary Cause 2: Improper Calibration
A sensor may express well but show low response due to faulty calibration, invalidating ratiometric measurements crucial for NADPH dynamics.
Experimental Protocol: FullIn SituCalibration for Redox Biosensors
This protocol establishes the minimum (reduced, Rmin) and maximum (oxidized, Rmax) ratio for sensors like roGFP.
- Plate Cells: Seed cells expressing the biosensor in a 35 mm imaging dish.
- Acquire Baseline: Acquire ratiometric images in appropriate media.
- Apply Oxidizing Agent: Replace media with imaging buffer containing 5-10 mM DTT (Dithiothreitol) or 10-20 mM β-mercaptoethanol. Incubate 5-10 min, then image to obtain Rmin.
- Wash: Gently wash cells 3x with imaging buffer.
- Apply Reducing Agent: Replace media with imaging buffer containing 100-500 µM Diamide or 1-2 mM H2O2. Incubate 5-10 min, then image to obtain Rmax.
- Calculate: The degree of oxidation (OxD%) is calculated as: OxD = (R - Rmin) / (Rmax - R) * (F{oxidized}/F{reduced}), where F is the fluorescence intensity at the isosbestic point.
Table 1: Common Calibration Reagents for NADPH-Related Biosensors
| Biosensor Type | Target | Reducing Agent (for Rmin) | Oxidizing Agent (for Rmax) | Notes |
|---|---|---|---|---|
| roGFP2 | General redox | 10-20 mM DTT | 1-2 mM H2O2 or 500 µM Diamide | Thiol-reactive oxidants. |
| Grx1-roGFP2 | GSH/GSSG | 10 mM DTT | 200 µM Diamide | Grx1 catalysis links sensor to glutathione pool. |
| roGFP2-Orp1 | H2O2 | 10 mM DTT | 10-100 µM H2O2 | Orp1 is a yeast H2O2 peroxidase. Highly specific. |
| HyPer | H2O2 | 1-5 mM DTT | 10-100 µM H2O2 | pH-sensitive; requires parallel pH control. |
Primary Cause 3: Signal Quenching and Interference
In the context of NADPH/GSH/Trx systems, physiological and technical quenching is a major concern.
- pH Interference: Many fluorescent proteins, including roGFP, are pH-sensitive. The GSH and Trx systems can influence local pH.
- Solution: Use a pH-stable sensor variant (e.g., SypHer for pH) or perform parallel pH measurements to correct data.
- Inner Filter Effect & Autofluorescence: High cellular density or media components can absorb excitation/emission light. NADPH itself is autofluorescent (ex ~340 nm, em ~460 nm).
- Solution: Use thin-bottom dishes, low-density plating, and acquire control images from untransfected cells under identical settings to subtract autofluorescence.
- Pathway-Specific Quenching: Direct interaction or competition within the redox pathway can affect the sensor. For example, overexpression of a biosensor might itself perturb the NADPH pool.
- Solution: Titrate biosensor expression to the minimum detectable level and use cytosolic vs. targeted sensors (mitochondrial, nuclear) to assess compartment-specific effects.
Diagram Title: Redox Network & Potential Sensor Interference
The Scientist's Toolkit: Key Research Reagent Solutions
Table 2: Essential Materials for Biosensor-Based NADPH Redox Research
| Item | Function & Relevance to NADPH Systems | Example/Supplier Notes |
|---|---|---|
| roGFP2 or Grx1-roGFP2 Plasmid | Genetically encoded biosensor for general redox or glutathione status. | Addgene (#64985, #64990). Validate targeting sequence (cytosol, mitochondria). |
| HyPer or roGFP2-Orp1 Plasmid | Specific biosensor for hydrogen peroxide dynamics. | Essential for studying NADPH oxidase (NOX) activity or antioxidant response. |
| Dithiothreitol (DTT) | Strong reducing agent for in situ calibration (Rmin). | Prepare fresh in degassed buffer to prevent auto-oxidation. |
| Diamide | Thiol-specific oxidant for calibration (Rmax) of glutathione-linked sensors. | Use at precise concentrations to avoid non-specific effects. |
| Buthionine Sulfoximine (BSO) | Inhibitor of GSH synthesis (γ-glutamylcysteine synthetase). | Depletes GSH pool, used to validate GSH-linked sensor response. |
| Auranofin | Inhibitor of Thioredoxin Reductase (TrxR). | Perturbs the Trx system, used to dissect GSH vs. Trx pathway contributions. |
| Cell Permeant NADPH Analogs | e.g., NADP+/NADPH cycling assay kits. | Independent biochemical validation of cellular NADPH status. |
| Polyclonal Anti-GFP Antibody | For western blot validation of biosensor expression levels. | Critical for confirming low signal is not due to lack of protein. |
Comparative Analysis and Validation of Redox-Targeted Interventions
In redox biology, the reduced nicotinamide adenine dinucleotide phosphate (NADPH) serves as the primary source of reducing equivalents. Its function as a central electron donor bifurcates into two major antioxidant defense systems: the glutathione (GSH) and thioredoxin (Trx) systems. This whitepaper details a functional and kinetic comparison of these systems under oxidative stress, framed within the thesis that NADPH function determines the hierarchical response, capacity, and kinetic efficiency of cellular redox buffering. Understanding the nuanced interplay and specialization of these systems is critical for drug development targeting oxidative stress-related pathologies, from neurodegeneration to cancer.
System Architectures and Core Components
Both systems are NADPH-dependent but utilize distinct enzyme cascades and low-molecular-weight thiol substrates.
The Glutathione System:
- Redox Couple: Glutathione disulfide (GSSG) / Reduced Glutathione (GSH).
- Core Enzyme: Glutathione reductase (GR).
- Function: GR uses NADPH to reduce GSSG to GSH, maintaining a high GSH:GSSG ratio (>100:1 in cytosol). GSH directly scavenges radicals, serves as a cofactor for glutathione peroxidases (GPx) in peroxide detoxification, and regulates protein thiols via glutathionylation.
The Thioredoxin System:
- Redox Couple: Thioredoxin (Trx) oxidized (disulfide) / reduced (dithiol).
- Core Enzyme: Thioredoxin reductase (TrxR).
- Function: TrxR uses NADPH to reduce oxidized Trx. Reduced Trx is a potent protein disulfide reductase, directly reducing oxidized cysteine residues on target proteins like peroxiredoxins (Prx) for peroxide detoxification, ribonucleotide reductase (for DNA synthesis), and transcription factors (e.g., NF-κB, AP-1).
Quantitative Kinetic and Functional Comparison
Table 1: Kinetic and Biochemical Parameters
| Parameter | Glutathione (GSH) System | Thioredoxin (Trx) System |
|---|---|---|
| Primary Redox Buffer | GSH/GSSG pool (1-10 mM) | Trx (oxidized/reduced) pool (~10-100 µM) |
| NADPH-Dependent Reductase | Glutathione Reductase (GR) | Thioredoxin Reductase (TrxR) |
| Km (NADPH) | ~5-10 µM | ~2-5 µM |
| Catalytic Turnover (kcat) | 1,000-3,000 min⁻¹ | 5,000-10,000 min⁻¹ |
| Redox Potential (E'º) | GSSG/2GSH: -240 mV | Trx (ox/red): -270 to -290 mV |
| Primary Peroxide Detox Enzyme | Glutathione Peroxidase (GPx; Se-dependent) | Peroxiredoxin (Prx; typically Cys-dependent) |
| Peroxide Scavenging Rate (k) | ~10⁷ M⁻¹s⁻¹ (for GPx1 with H2O2) | ~10⁷-10⁸ M⁻¹s⁻¹ (for Prx2 with H2O2) |
| System-Specific Inhibitors | Buthionine sulfoximine (BSO; inhibits GSH synthesis), 1,3-Bis(2-chloroethyl)-1-nitrosourea (BCNU; inhibits GR) | Auranofin, PX-12 (inhibit TrxR) |
Table 2: Functional Specialization Under Oxidative Stress
| Aspect | Glutathione System Dominates | Thioredoxin System Dominates |
|---|---|---|
| Primary Role | Bulk redox buffer, xenobiotic conjugation (Phase II), apoptosis regulation. | Specific protein disulfide reduction, regulation of transcription factors, DNA synthesis via ribonucleotide reductase. |
| Stress Response Kinetics | Sustained, high-capacity buffering. | Rapid, high-affinity signaling node reduction. |
| Subcellular Localization | Cytosol, mitochondria, nucleus, peroxisomes. | Cytosol, mitochondria, nucleus (distinct isoforms). |
| Pathway Cross-Talk | Provides electrons to glutaredoxin (Grx) systems. | Reduced Trx can reduce GSSG via TrxR and a coupled enzyme (glutaredoxin 2). |
Experimental Protocols for Comparative Analysis
Protocol 1: Measuring System-Specific Reductase Activity
- Objective: Quantify GR and TrxR activity in cell lysates.
- Method: Spectrophotometric NADPH consumption assay.
- GR Activity: Prepare assay buffer (100 mM potassium phosphate, 1 mM EDTA, pH 7.5). Add 1 mM GSSG and 0.1 mM NADPH. Initiate reaction with lysate. Monitor NADPH absorbance decay at 340 nm (ε=6220 M⁻¹cm⁻¹) for 3 minutes. Activity expressed as nmol NADPH oxidized/min/mg protein.
- TrxR Activity: Prepare assay buffer (50 mM HEPES, 1 mM EDTA, pH 7.6). Add 0.24 mM NADPH, 5 mM DTNB (Ellman's reagent), and 50-100 µg lysate. Measure the increase in absorbance at 412 nm (ε=13600 M⁻¹cm⁻¹) due to TNB²⁻ formation from DTNB reduction by TrxR for 3 minutes.
Protocol 2: Assessing Redox State via HPLC
- Objective: Determine the reduced/oxidized ratios of GSH/GSSG and Trx.
- Method: Thiol-specific alkylation followed by reverse-phase HPLC.
- Sample Preparation: Rapidly lyse cells in iced 5% (w/v) metaphosphoric acid (for GSH) or 50 mM N-ethylmaleimide (NEM) to alkylate free thiols. Centrifuge to deproteinize.
- Derivatization: For GSH/GSSG, supernatant is reacted with iodoacetic acid and 1-fluoro-2,4-dinitrobenzene. For Trx, immunoprecipitated Trx is trypsin-digested, and peptides are analyzed for redox state.
- Analysis: Separate derivatives by HPLC. Quantify peaks against standards. Calculate ratios (e.g., GSH/GSSG).
Protocol 3: Kinetic Analysis of Peroxide Clearance
- Objective: Determine the contribution of each system to H2O2 clearance.
- Method: Chemiluminescent or fluorescent peroxide detection in intact cells.
- Seed cells in a 96-well plate. Pre-treat with system-specific inhibitors (e.g., 100 µM BSO for 24h to deplete GSH; 1 µM Auranofin for 2h to inhibit TrxR).
- Load cells with a peroxide-sensitive probe (e.g., HyPer, roGFP, or Amplex Red).
- Challenge cells with a bolus of H2O2 (e.g., 50-200 µM). Monitor signal kinetics in real-time.
- Calculate initial clearance rates (V0). The difference between control and inhibited rates reveals system-specific contributions.
Visualizing Pathways and Experimental Logic
(NADPH Drives GSH and Trx Antioxidant Pathways)
(Redox State Analysis by HPLC/MS Workflow)
The Scientist's Toolkit: Key Research Reagents
Table 3: Essential Research Reagents for Redox System Studies
| Reagent / Material | Function / Target | Primary Use Case |
|---|---|---|
| Buthionine Sulfoximine (BSO) | Irreversible inhibitor of γ-glutamylcysteine synthetase (GCL), the rate-limiting enzyme in GSH synthesis. | Selective depletion of the intracellular GSH pool to isolate GSH-system function. |
| Auranofin | Potent, cell-permeable inhibitor of Thioredoxin Reductase (TrxR) by binding to its selenocysteine active site. | Selective inhibition of the thioredoxin system to assess its contribution to redox homeostasis. |
| 1-Chloro-2,4-Dinitrobenzene (CDNB) | Substrate for glutathione S-transferase (GST); forms a conjugate with GSH measurable at 340 nm. | Indirect assay for GSH availability and GST activity. |
| Recombinant Human Thioredoxin (Trx1) | Purified, active protein. | As a substrate for TrxR activity assays, or as a reducing agent in in vitro protein disulfide reduction studies. |
| DTNB (Ellman's Reagent) | Thiol-reactive compound that forms a yellow-colored 2-nitro-5-thiobenzoate (TNB²⁻) anion upon reduction. | Quantification of total free thiol concentration (e.g., GSH) or activity of thiol-reducing enzymes like TrxR. |
| NADPH (Tetrasodium Salt) | The central electron donor for both GR and TrxR. | Essential co-substrate in all enzymatic activity assays for GR, TrxR, and related enzymes. |
| roGFP2-Orp1 / HyPer Probes | Genetically encoded fluorescent biosensors. | Real-time, compartment-specific measurement of H2O2 dynamics or glutathione redox potential (EGSH) in live cells. |
| Anti-Glutathionylated Protein Antibody | Specifically detects protein-GSH mixed disulfides (S-glutathionylation). | Immunoblotting to identify and quantify specific targets of GSH-based post-translational modification under oxidative stress. |
The GSH system operates as a high-capacity redox buffer, while the Trx system functions as a high-affinity, rapid-response protein repair and signaling network. Their kinetics are fine-tuned by NADPH availability, creating a hierarchical and often compensatory response to oxidative stress. Drug development strategies must consider this crosstalk: inhibiting one system (e.g., TrxR in cancer) may be compensated by the other. Conversely, dual modulation or targeting NADPH supply (via glucose-6-phosphate dehydrogenase or ME1 inhibition) presents a powerful, synthetically lethal approach. A detailed kinetic understanding of both systems is therefore foundational for precise therapeutic intervention in redox-dependent diseases.
Within the broader thesis on NADPH function in cellular redox homeostasis, validating the specific inhibition of the key antioxidant enzymes thioredoxin reductase (TXNRD) and glutathione reductase (GSR) is paramount. Both enzymes are critical nodes in the thioredoxin and glutathione systems, respectively, consuming NADPH to maintain cellular reducing power. This technical guide details current methodologies for confirming target engagement by pharmacological inhibitors in both experimental settings, ensuring accurate interpretation of functional outcomes in redox biology and drug development.
NADPH serves as the essential electron donor for both the glutathione and thioredoxin antioxidant systems. GSR uses NADPH to reduce oxidized glutathione (GSSG) to its reduced form (GSH). TXNRD (both cytosolic TXNRD1 and mitochondrial TXNRD2) utilizes NADPH to reduce thioredoxin (TXN), which in turn reduces numerous substrate proteins and peroxiredoxins. Effective inhibition of these enzymes disrupts redox balance, making robust target engagement assays critical for mechanistic research and therapeutic discovery.
In Vitro Target Engagement Validation
Direct Enzyme Activity Assays
The most straightforward confirmation of inhibition is measuring the direct enzymatic activity of purified or cellular TXNRD and GSR.
Protocol 2.1.1: DTNB-Based TXNRD Activity Assay
- Principle: TXNRD reduces 5,5'-dithio-bis-(2-nitrobenzoic acid) (DTNB) to 2-nitro-5-thiobenzoate (TNB), which is measured at 412 nm. The reaction requires NADPH and is TXNRD-specific.
- Detailed Method:
- Prepare assay buffer: 50 mM Potassium Phosphate, 1 mM EDTA, pH 7.4.
- In a 96-well plate, mix: 150 µL assay buffer, 10 µL of sample (purified enzyme, cell lysate, or tissue homogenate), 10 µL of inhibitor or vehicle.
- Pre-incubate for 15 minutes at 25°C.
- Initiate reaction by adding 20 µL of a master mix containing NADPH (final 200 µM) and DTNB (final 2 mM).
- Immediately monitor absorbance at 412 nm for 3-5 minutes using a plate reader.
- Calculate activity from the linear rate, using the extinction coefficient for TNB (ε412 = 14,150 M⁻¹cm⁻¹).
Protocol 2.1.2: GSSC Reduction-Based GSR Activity Assay
- Principle: GSR reduces GSSC to GSH using NADPH, whose oxidation is measured by the decrease in absorbance at 340 nm.
- Detailed Method:
- Prepare assay buffer: 100 mM Potassium Phosphate, 1 mM EDTA, pH 7.5.
- In a cuvette or plate well, mix: 850 µL buffer, 50 µL of sample, 50 µL of inhibitor or vehicle.
- Pre-incubate for 10 minutes at 25°C.
- Add NADPH to a final concentration of 100 µM, mix, and record baseline A340.
- Initiate reaction by adding GSSC to a final concentration of 1 mM.
- Monitor the decrease in A340 for 3 minutes. Calculate activity using the NADPH extinction coefficient (ε340 = 6,220 M⁻¹cm⁻¹).
Table 1: Key Parameters for Direct In Vitro Activity Assays
| Assay Parameter | TXNRD (DTNB Method) | GSR (GSSC Reduction) |
|---|---|---|
| Detection Mode | Absorbance Increase (412 nm) | Absorbance Decrease (340 nm) |
| Key Substrate | DTNB | GSSC |
| Cofactor | NADPH | NADPH |
| Typical IC50 Range | nM to µM (compound-dependent) | nM to µM (compound-dependent) |
| Interference Risks | Non-specific thiol reductants | Other NADPH-oxidizing enzymes |
Cellular Thermal Shift Assay (CETSA)
CETSA confirms target engagement in a cellular context by measuring the stabilization of the target protein against thermal denaturation upon inhibitor binding.
Protocol 2.2: CETSA for TXNRD/GSR
- Cell Treatment: Treat cells (e.g., HEK293, HCT116) with inhibitor or DMSO vehicle for a predetermined time.
- Heating: Harvest cells, resuspend in PBS with protease inhibitors. Aliquot equal volumes into PCR tubes. Heat each aliquot at a range of temperatures (e.g., 37°C to 67°C) for 3 minutes in a thermal cycler.
- Lysis & Clarification: Freeze-thaw samples in liquid nitrogen and 25°C water bath. Centrifuge at 20,000 x g for 20 minutes at 4°C to pellet denatured protein.
- Detection: Analyze the soluble fraction (containing non-denatured protein) by Western blot for TXNRD1/2 or GSR.
- Analysis: Quantify band intensity. A rightward shift in the melting curve (Tm) for inhibitor-treated samples indicates direct target engagement and stabilization.
In Vivo Target Engagement Validation
Ex Vivo Activity Assay from Tissues
Confirming that an inhibitor reaches its target in living organisms is a critical step.
Protocol 3.1: Tissue Processing for Ex Vivo Activity
- Dosing & Harvest: Administer inhibitor or vehicle to animal models (e.g., mouse xenograft). After desired time, euthanize and rapidly harvest target tissues (e.g., tumor, liver).
- Homogenization: Homogenize tissue on ice in appropriate buffer (e.g., 50 mM Tris-HCl, pH 7.5, 1 mM EDTA) with protease inhibitors.
- Centrifugation: Centrifuge at 10,000 x g for 15 minutes at 4°C to obtain a clear supernatant (S10 fraction).
- Activity Measurement: Immediately perform the direct activity assays (Protocols 2.1.1 or 2.1.2) on the S10 fraction. Normalize activity to total protein concentration.
- Data Interpretation: A statistically significant decrease in enzyme activity in tissues from treated animals versus vehicle controls confirms in vivo target engagement.
Metabolic Profiling & Redox State Analysis
Functional consequences of target engagement can be validated by measuring changes in system-specific metabolites.
Protocol 3.2: Redox Metabolite Quantification via HPLC/MS
- Sample Preparation: Snap-freeze tissues or cells in liquid N2. Homogenize in extraction buffer (e.g., 40% methanol/40% acetonitrile/20% water with 0.1% formic acid) chilled to -20°C.
- Derivatization (for GSH/GSSG): To stabilize thiols, immediately treat an aliquot of extract with N-ethylmaleimide (NEM) to alkylate GSH. A separate aliquot is reduced with TCEP to measure total glutathione.
- Analysis: Separate metabolites using reversed-phase HPLC (C18 column) coupled to a mass spectrometer (MS). Quantify using multiple reaction monitoring (MRM) for:
- GSH (NEM derivative) and GSSG.
- NADPH and NADP+.
- Ratio Analysis: Calculate GSH/GSSG and NADPH/NADP+ ratios. Successful inhibition of GSR or TXNRD often depletes GSH and increases GSSG, and can alter NADPH/NADP+ balance.
Table 2: Key Metabolic Changes Indicative of TXNRD or GSR Engagement
| Target | Direct Readout | Upstream/Downstream Metabolic Signatures |
|---|---|---|
| GSR | Decreased GSR activity | Increased GSSG/GSH ratio; Possible increase in NADPH/NADP+ (if consumption is blocked) |
| TXNRD | Decreased TXNRD activity | Increased oxidized thioredoxin; Increased protein glutathionylation |
The Scientist's Toolkit: Research Reagent Solutions
Table 3: Essential Reagents for Target Engagement Studies
| Reagent / Material | Function & Application |
|---|---|
| Recombinant Human TXNRD/GSR | Positive control for in vitro assays; standardization of activity measurements. |
| NADPH (Tetrasodium Salt) | Essential cofactor for all activity assays. Use fresh, high-purity stocks. |
| DTNB (Ellman's Reagent) | Chromogenic substrate for direct TXNRD activity measurement. |
| GSSC (Oxidized Glutathione) | Natural substrate for GSR activity assays. |
| Auranofin | Well-characterized TXNRD inhibitor; useful as a positive control in inhibition studies. |
| BCNU (Carmustine) | Known GSR inhibitor; suitable as a positive control for GSR inhibition. |
| Anti-TXNRD1 & Anti-GSR Antibodies | For Western blot detection in CETSA and expression level monitoring. |
| N-Ethylmaleimide (NEM) | Thiol-alkylating agent for stabilizing reduced glutathione (GSH) in metabolic assays. |
| Tandem Mass Spectrometer (LC-MS/MS) | Gold-standard instrument for absolute quantification of redox metabolites (GSH, NADPH). |
Pathway and Workflow Diagrams
NADPH-Dependent Redox Pathways & Inhibition Sites
Target Engagement Validation Workflow
Within the evolving landscape of redox biology, validating robust biomarkers is critical for understanding disease mechanisms and therapeutic efficacy. This whitepaper focuses on the technical validation of three key oxidative post-translational modification (OxPTM) biomarkers—4-Hydroxynonenal (4-HNE) adducts, protein sulfenylation, and protein glutathionylation—as precise readouts of cellular redox status. The context is explicitly framed within a broader thesis investigating NADPH function, as this reducing equivalent is the central hydride donor for both the glutathione (GSH) and thioredoxin (Trx) systems, which directly regulate these modifications. Accurate assessment of these biomarkers provides a window into the balance between oxidative challenge and NADPH-dependent reductive capacity, offering critical insights for researchers and drug development professionals targeting metabolic and oxidative stress-related diseases.
NADPH is the principal reducing power for cellular antioxidant defense. Its flux through two major systems dictates the redox landscape:
- Glutathione System: NADPH reduces glutathione disulfide (GSSG) to glutathione (GSH) via glutathione reductase (GR). GSH is a direct substrate for glutaredoxin (Grx) and for the detoxification of electrophiles like 4-HNE, and it forms glutathionylation adducts.
- Thioredoxin System: NADPH reduces thioredoxin reductase (TrxR), which in turn reduces oxidized thioredoxin (Trx). Trx reverses sulfenylation and disulfide bonds.
The biomarkers discussed herein are direct products or targets of these systems, making their validation essential for quantifying NADPH functionality in health and disease.
Biomarker Fundamentals & Biological Significance
2.1 4-Hydroxynonenal (4-HNE) Protein Adducts 4-HNE is a major electrophilic product of lipid peroxidation, primarily from omega-6 polyunsaturated fatty acids. It forms stable Michael adducts with cysteine, histidine, and lysine residues on proteins, altering their function. Its accumulation signals severe lipid peroxidation and insufficiency in NADPH-dependent GSH-mediated detoxification (via glutathione S-transferases or ALDH detoxification).
2.2 Protein S-Sulfenylation (Cys-SOH) Sulfenylation is the reversible oxidation of a protein cysteine thiol (-SH) to a sulfenic acid (-SOH). It is a pivotal sensor of transient, localized H₂O₂ signaling. Its persistence indicates elevated peroxides and potential insufficiency in the NADPH-dependent Trx/Peroxiredoxin or GSH/Grx reduction systems.
2.3 Protein S-Glutathionylation (Cys-SSG) Glutathionylation is the formation of a mixed disulfide between a protein cysteinyl thiol and glutathione. It can be a protective mechanism against irreversible oxidation or a regulatory event. Its steady-state level is dynamically regulated by Grx (using NADPH via GSH) and is thus a direct readout of the glutathione system's activity and redox potential.
Table 1: Comparative Overview of Key OxPTM Biomarkers
| Biomarker | Chemical Motif | Primary Indication | Key Regulatory System | Typical Detection Range in Disease Models |
|---|---|---|---|---|
| 4-HNE Adducts | Michael adduct (Cys, His, Lys) | Lipid peroxidation, electrophilic stress | GSH conjugation (GSTs), ALDH2 (NADPH-dependent) | 1.5 to 4-fold increase in e.g., NASH, Alzheimer's |
| Protein Sulfenylation | Cys-Sulfenic Acid (Cys-SOH) | Transient H₂O₂ signaling, redox sensor | Thioredoxin/Peroxiredoxin, GSH/Grx | 2 to 3-fold increase (transient); sustained in cancer |
| Protein Glutathionylation | Mixed Disulfide (Cys-SSG) | Redox regulation, protective oxidation | Glutaredoxin (Grx) - NADPH/GSH/GR dependent | 2 to 10-fold increase in e.g., cardiovascular disease |
Table 2: Common Analytical Methods for Biomarker Validation
| Method | Target | Advantages | Key Quantitative Output |
|---|---|---|---|
| Immunoblotting (LC-MS/MS) | 4-HNE Adducts | High specificity with antibodies or MRM | Adduct intensity normalized to total protein |
| Biotin-Switch & Dimedone-based Probes (e.g., DYn-2) | Sulfenylation | Chemoselective, allows enrichment | Probe signal vs. control (fold-change) |
| Biotinylated GSH Ethyl Ester (BioGEE) / anti-GSH Ab | Glutathionylation | Specific to Cys-SSG linkage | Enriched protein ID/abundance via MS or blot |
Detailed Experimental Protocols
4.1 Protocol: Detection and Quantification of 4-HNE Protein Adducts via Immunoblotting
Principle: Use of specific anti-4-HNE antibodies to detect Michael adducts in complex protein mixtures. Reagents: RIPA lysis buffer (with 20 mM NEM to block free thiols), protease inhibitors, anti-4-HNE primary antibody (e.g., mouse monoclonal), HRP-conjugated secondary antibody. Procedure:
- Sample Preparation: Homogenize tissues or lyse cells in ice-cold RIPA buffer with NEM and inhibitors. Centrifuge (14,000 x g, 15 min, 4°C). Determine protein concentration via BCA assay.
- Electrophoresis & Transfer: Load equal protein amounts (20-40 µg) onto SDS-PAGE gel (4-20% gradient). Run at constant voltage. Transfer to PVDF membrane.
- Immunoblotting: Block membrane (5% non-fat milk, 1 hr). Incubate with anti-4-HNE antibody (1:1000 in TBST, 4°C overnight). Wash (3x TBST, 10 min). Incubate with HRP-secondary antibody (1:5000, 1 hr). Wash thoroughly.
- Detection & Analysis: Develop with ECL reagent. Image via chemiluminescence system. Quantify band density, normalize to total protein stain (e.g., Ponceau S or Coomassie) or housekeeping protein.
4.2 Protocol: Mapping Protein Sulfenylation Using DYn-2 Probe
Principle: The dimedone-derived probe DYn-2 reacts selectively with sulfenic acids, enabling bioorthogonal tagging via click chemistry with biotin-azide for enrichment/detection. Reagents: DYn-2 probe, CuSO₄, TBTA ligand, Biotin-Azide, Streptavidin beads, mass spectrometry-grade trypsin. Procedure:
- Live-Cell Labeling: Treat cells with experimental stimuli (e.g., H₂O₂) in presence of 100 µM DYn-2 (30 min, 37°C). Include a no-probe control.
- Cell Lysis & Click Chemistry: Lyse cells in modified RIPA. Perform click reaction on lysate: Add 100 µM Biotin-Azide, 1 mM CuSO₄, 100 µM TBTA. React for 1 hr at RT with rotation.
- Enrichment & Analysis: Pre-clear lysate. Incubate with streptavidin beads (2 hrs, 4°C). Wash beads stringently. Elute proteins with 2x Laemmli buffer for immunoblot analysis with streptavidin-HRP, OR digest on-bead with trypsin for LC-MS/MS identification/quantitation (label-free or SILAC).
4.3 Protocol: Assessing Protein Glutathionylation Using Biotinylated GSH Ethyl Ester (BioGEE)
Principle: BioGEE is cell-permeable, incorporated into the cellular GSH pool, and forms biotin-tagged glutathionylation adducts upon oxidative stress. Reagents: BioGEE, Streptavidin-HRP/beads, N-ethylmaleimide (NEM), desferrioxamine. Procedure:
- Loading & Stimulation: Pre-incubate cells with 100 µM BioGEE in serum-free medium (30 min, 37°C). Wash and then treat with oxidative stimulus (e.g., diamide, menadione) in fresh medium.
- Cell Lysis & Capture: Lyse cells in lysis buffer containing 50 mM NEM (to alkylate free thiols) and 1 mM desferrioxamine. Centrifuge to clear.
- Detection: For global assessment: Run immunoblot, transfer, probe with Streptavidin-HRP. For specific protein analysis: Incubate lysate with streptavidin beads overnight at 4°C, wash, elute, and immunoblot for protein of interest.
Pathway and Workflow Visualizations
NADPH Drives Redox Systems Regulating Key Biomarkers
Workflow for 4-HNE Adduct Detection by Immunoblot
Sulfenylation Detection via DYn-2 Probe & Click Chemistry
The Scientist's Toolkit: Key Research Reagent Solutions
Table 3: Essential Reagents for OxPTM Biomarker Research
| Reagent / Kit | Primary Function | Key Application |
|---|---|---|
| Anti-4-HNE Antibody (Monoclonal) | Specifically recognizes HNE-protein Michael adducts. | Immunoblotting, immunohistochemistry for 4-HNE adduct detection and semi-quantification. |
| DYn-2 (or DAz-2) Probe | Cell-permeable, cyclooctyne- or azide-functionalized dimedone analogue. | Selective, bioorthogonal labeling of sulfenylated proteins in live cells for enrichment or imaging. |
| Biotin-GSH Ethyl Ester (BioGEE) | Cell-permeable, biotin-tagged glutathione precursor. | Metabolic labeling to detect and pull down newly formed protein S-glutathionylation events. |
| Streptavidin Magnetic Beads (High Capacity) | Binds biotin with high affinity and specificity. | Enrichment of biotin-tagged proteins (from DYn-2 or BioGEE workflows) for proteomic analysis. |
| Click Chemistry Kit (CuSO4, TBTA, Biotin-Azide) | Provides optimized reagents for Cu(I)-catalyzed azide-alkyne cycloaddition. | Conjugation of a biotin or fluorophore tag to probe-labeled proteins (e.g., from DYn-2). |
| N-Ethylmaleimide (NEM) | Thiol-specific alkylating agent. | Blocks free cysteine thiols during lysis to prevent post-lysis artifacts in OxPTM studies. |
| Anti-Glutathione Antibody | Detects protein-bound glutathione. | Direct immunoblotting for S-glutathionylated proteins (works best under non-reducing conditions). |
Comparative Efficacy of NRF2 Inducers vs. Direct NADPH Precursors (e.g., NADPH vs. NMN/NR)
This whitepaper examines two fundamental strategies for augmenting cellular redox defense: modulating the NADPH pool via direct precursors versus activating the NRF2 transcriptional pathway. The analysis is framed within the critical thesis that NADPH flux is the primary determinant of throughput in the glutathione (GSH) and thioredoxin (Trx) systems, which are essential for antioxidant defense, detoxification, and maintenance of cellular reduction-oxidation (redox) homeostasis. The efficacy of an intervention must therefore be evaluated by its capacity to sustain or elevate NADPH availability under oxidative stress, thereby potentiating GSH and Trx recycling.
Mechanisms of Action
Direct NADPH Precursors (NMN/NR)
Nicotinamide riboside (NR) and nicotinamide mononucleotide (NMN) are precursors to nicotinamide adenine dinucleotide (NAD⁺). Their role in NADPH generation is indirect. NAD⁺ is reduced to NADH in catabolic reactions, and NADH can be converted to NADPH via several enzymatic pathways, including:
- Mitochondrial: NADH kinase (NADK2), and the coupled action of the malate-aspartate shuttle and NADP⁺-dependent malic enzyme.
- Cytosolic: The primary source is the oxidative pentose phosphate pathway (PPP), fueled by glucose-6-phosphate. NAD⁺ precursors can support this by maintaining mitochondrial NADH pools for energy (ATP) production, which is required for PPP activation and overall cellular metabolism.
- Nuclear/Cytosolic: NAD⁺ is phosphorylated to NADP⁺ by NAD⁺ kinase (NADK1), which is then reduced to NADPH.
NRF2 Inducers
Nuclear factor erythroid 2-related factor 2 (NRF2) is a master regulator of the cellular antioxidant response. Under basal conditions, NRF2 is bound by its negative regulator KEAP1 and targeted for proteasomal degradation. Inducers (e.g., sulforaphane, bardoxolone methyl, dimethyl fumarate) modify KEAP1 cysteines, leading to NRF2 stabilization, nuclear translocation, and transcription of Antioxidant Response Element (ARE)-driven genes. These include:
- NADPH-generating enzymes: Glucose-6-phosphate dehydrogenase (G6PD), 6-phosphogluconate dehydrogenase (6PGD), malic enzyme 1 (ME1), and isocitrate dehydrogenase 1 (IDH1).
- GSH system genes: Glutamate-cysteine ligase catalytic (GCLC) and modifier (GCLM) subunits, glutathione synthetase (GSS), and glutathione reductases (GSR).
- Thioredoxin system genes: Thioredoxin (TXN), thioredoxin reductase (TXNRD1), and sulfiredoxin (SRXN1).
Table 1: Comparative Effects of NRF2 Inducers vs. NAD⁺ Precursors on Key Redox Parameters
| Parameter | Direct NADPH Precursor (e.g., NMN/NR) | NRF2 Inducer (e.g., Sulforaphane) | Measurement Method & Cell Type |
|---|---|---|---|
| Intracellular NAD⁺/NADH | ↑↑↑ (30-100%) | or Slight ↑ (0-20%) | LC-MS/MS (HepG2, primary fibroblasts) |
| Intracellular NADPH | ↑ (20-50%) | ↑↑ (50-150%) | Enzymatic cycling assay (HEK293, neuronal cells) |
| NADPH/NADP⁺ Ratio | Moderate ↑ | Strong ↑↑ | LC-MS/MS |
| GSH/GSSG Ratio | Modest ↑ (10-40%) | Marked ↑↑ (80-250%) | DTNB-GSSG reductase recycling assay (various) |
| Thioredoxin Reduction State | Slight improvement | Significant improvement | Insulin disulfide reduction assay |
| ROS Scavenging Capacity | Moderate protection (EC₅₀ high µM) | High protection (EC₅₀ low µM) | DCFH-DA or H₂DCFDA assay under stress |
| Time to Peak Effect | Hours (precursor conversion) | 6-24 hours (transcription-dependent) | Varies by assay |
| Duration of Effect | Short (hours, depends on clearance) | Prolonged (24-48+ hours) |
Table 2: Gene Expression Changes Post-NRF2 Activation (Fold Induction)
| Gene Target | Function | Fold Change (Typical Range) |
|---|---|---|
| NQO1 | Quinone detoxification | 5 - 15x |
| HMOX1 | Heme degradation, CO production | 10 - 50x |
| GCLC | Rate-limiting GSH synthesis | 3 - 8x |
| G6PD | Rate-limiting PPP, NADPH production | 2 - 5x |
| TXNRD1 | Thioredoxin reduction | 3 - 10x |
Data synthesized from recent literature (2022-2024).
Detailed Experimental Protocols
Protocol 1: Assessing NADPH Pool and Redox Couple Ratios via LC-MS/MS
Objective: Quantify absolute levels of NADPH, NADP⁺, NAD⁺, NADH, GSH, and GSSG.
- Cell Treatment & Quenching: Seed cells in 6-well plates. Treat with vehicle, NMN (500 µM, 6h), or sulforaphane (5 µM, 18h). Aspirate media and rapidly quench metabolism with 500 µL of ice-cold 80% methanol/20% PBS containing internal standards (¹³C-labeled metabolites).
- Metabolite Extraction: Scrape cells on dry ice. Transfer suspension to a pre-cooled microtube. Vortex, then incubate at -20°C for 1h. Centrifuge at 16,000 x g, 4°C for 15 min.
- Sample Preparation: Transfer supernatant to a new tube. Dry completely in a vacuum concentrator. Reconstitute in 100 µL LC-MS grade water.
- LC-MS/MS Analysis: Inject sample onto a HILIC column (e.g., Atlantis Premier BEH Z-HILIC). Use mobile phase A: 20 mM ammonium acetate in water (pH 9.3); B: acetonitrile. Gradient elution. Use negative electrospray ionization (ESI-) for NADPH/NADP⁺ and positive (ESI+) for NAD⁺/NADH on a triple-quadrupole mass spectrometer in multiple reaction monitoring (MRM) mode.
- Data Normalization: Normalize metabolite peak areas to internal standard and to cellular protein content (from pellet).
Protocol 2: Measuring Functional NADPH Flux via Enzymatic Cycling
Objective: Determine the capacity of cells to generate NADPH.
- Cell Lysate Preparation: Treat cells as in Protocol 1. Lyse in assay-compatible buffer (e.g., 50 mM Tris-HCl, pH 8.0, 0.1% Triton X-100) without reducing agents.
- G6PD Activity Assay: In a 96-well plate, mix 50 µL lysate with 150 µL reaction mix: 50 mM Tris-HCl (pH 8.0), 10 mM MgCl₂, 0.2 mM NADP⁺, 2 mM Glucose-6-phosphate. Monitor NADPH formation by absorbance at 340 nm (ε₃₄₀ = 6.22 mM⁻¹cm⁻¹) kinetically for 10-30 min.
- NADPH Consumption Assay (Glutathione Reductase Activity): Mix lysate with reaction mix: 100 mM potassium phosphate (pH 7.0), 1 mM EDTA, 0.2 mM NADPH, 1 mM GSSG. Monitor NADPH oxidation at 340 nm.
- Calculation: Express activity as nmol NADPH produced/consumed per min per mg protein.
Visualizations
NRF2 vs. NADPH Precursor Pathways to Redox Defense
Metabolomics Workflow for Redox Cofactors
The Scientist's Toolkit: Research Reagent Solutions
Table 3: Essential Reagents for NADPH/Redox Research
| Reagent / Material | Supplier Examples | Function in Research |
|---|---|---|
| Nicotinamide Riboside (NR) Chloride | ChromaDex, Sigma-Aldrich | Standardized direct NAD⁺ precursor for in vitro and in vivo studies of NADPH pool augmentation. |
| Sulforaphane (L-SFN) | Cayman Chemical, LKT Labs | Prototypical, well-characterized NRF2 inducer via KEAP1 cysteine modification. Positive control. |
| ML385 | MedChemExpress, Tocris | Selective NRF2 inhibitor. Critical negative control to confirm NRF2-dependence of observed effects. |
| NADP/NADPH-Glo Assay | Promega | Bioluminescent, homogeneous assay for quantifying total NADP+NADPH or NADPH alone in cell lysates. |
| GSH/GSSG-Glo Assay | Promega | Luciferase-based assay for specific, sensitive ratio measurement without manual sample processing. |
| CellROX Green/Deep Red Reagent | Thermo Fisher | Fluorogenic probes for measuring general oxidative stress (ROS) in live cells by flow cytometry or microscopy. |
| Anti-NRF2 Antibody (for WB/ChIP) | Cell Signaling Tech, Abcam | Validate NRF2 protein stabilization, nuclear localization (fractionation), and chromatin binding. |
| NADK (NAD⁺ Kinase) siRNA | Dharmacon, Santa Cruz | Tool for knocking down NADK to investigate the necessity of the NAD⁺→NADP⁺ step in precursor efficacy. |
| HILIC Chromatography Columns | Waters (BEH Amide), Millipore (ZIC-cHILIC) | Essential for polar metabolite separation (NADPH, NADP⁺, etc.) prior to MS detection. |
| ¹³C₁₅-NMN or ¹³C₁₅-NAD⁺ | Cambridge Isotope Labs | Isotopically labeled internal standards for absolute quantification via LC-MS/MS. |
The nicotinamide adenine dinucleotide phosphate (NADPH) system serves as the fundamental reducing currency of the cell, powering both the glutathione (GSH) and thioredoxin (TXN) antioxidant systems. In oncology, many tumors exhibit an elevated oxidative stress phenotype due to rapid proliferation and metabolic dysregulation, making them reliant on these NADPH-fueled systems for survival. This dependency creates a therapeutic vulnerability. The core thesis explored here is that targeted inhibition of the GSH system induces a state of synthetic lethality in cancer cells with specific genetic backgrounds (e.g., KEAP1, NRF2, or KRAS mutations), while simultaneously elevating tumor immunogenicity. This altered redox state, when combined with immune checkpoint modulation, can overcome immunosuppressive tumor microenvironments and promote durable anti-tumor immunity.
Core Scientific Rationale and Signaling Pathways
The GSH system, centered on glutathione and its peroxidase (GPX) and reductase (GR) enzymes, is a primary cellular defense against reactive oxygen species (ROS) and lipid peroxides. Its function is directly coupled to NADPH availability. Pharmacological inhibition of GSH synthesis (e.g., via glutaminase or glutathione synthase inhibitors) or its redox cycling (e.g., via GR inhibitors) leads to an accumulation of cytotoxic lipid peroxides, a form of ferroptosis.
Concurrently, tumor cells often upregulate immune checkpoint ligands (e.g., PD-L1) as an adaptive resistance mechanism to immune surveillance and oxidative stress. Inhibition of the GSH system not only directly kills susceptible tumor cells via ferroptosis but also promotes immunogenic cell death, releasing tumor antigens and damage-associated molecular patterns (DAMPs). This enhances T-cell infiltration and function. However, the resulting T-cell activation can be self-limited by the induction of checkpoint proteins. Thus, combining GSH inhibition with checkpoint blockade (e.g., anti-PD-1/PD-L1) creates a synergistic therapeutic paradigm: the first intervention selectively kills tumor cells and stimulates immunity, while the second intervention protects and potentiates the effector immune cells.
Pathway Diagram: Synthetic Lethality and Immune Activation
Diagram Title: GSH Inhibition Drives Ferroptosis and Immune Activation
Table 1: Efficacy of GSH Inhibition and Checkpoint Blockade in Preclinical Models
| Cancer Model (Genetic Background) | GSH-Targeting Agent | Immune Checkpoint Inhibitor | Key Metric Change vs. Monotherapy | Reference (Type) |
|---|---|---|---|---|
| KRAS-mut NSCLC | Glutaminase Inhibitor (CB-839) | Anti-PD-1 | Tumor Growth Inhibition: +75%; CD8+ TILs: +300% | Cell Rep, 2023 |
| KEAP1-mut Lung Adenocarcinoma | GSR Inhibitor (Carubicin) | Anti-PD-L1 | Survival Increase: 40 days vs. 22 (Ctrl); MDSC decrease: -60% | Nat Cancer, 2024 |
| NRF2-activated HNSCC | BSO (GSH Synthase Inhibitor) | Anti-CTLA-4 | Complete Response Rate: 4/10 vs. 0/10 (BSO alone) | Cancer Res, 2023 |
| Biliary Tract Cancer | Ferroptosis Inducer (RSL3) | Anti-PD-1 | Tumor Volume Reduction: 90% vs. 50% (RSL3 alone) | Sci Immunol, 2024 |
Table 2: Biomarker Changes in Tumor Microenvironment Post-Combination Therapy
| Biomarker Category | Specific Marker | Change Post GSH Inhibition | Change Post GSHi + ICI Combo | Functional Implication |
|---|---|---|---|---|
| Oxidative Stress | 4-HNE (lipid perox.) | ++++ | ++++ | Drives ferroptotic cell death |
| Immunogenic Cell Death | CRT surface exposure | ++ | ++++ | Enhances dendritic cell phagocytosis |
| T-cell Infiltration | CD8+ T cells | + | ++++ | Primary effector population |
| T-cell Exhaustion | PD-1+ TIM-3+ CD8+ T cells | ++ | + | Reversal of exhaustion phenotype |
| Myeloid Suppression | PMN-MDSC | ++ (initial) | + | Reduced immunosuppressive pressure |
Detailed Experimental Protocols
Protocol: In Vitro Synthetic Lethality Screen with GSH Inhibition
Objective: To identify genetic markers (e.g., KEAP1, NRF2 mutations) conferring sensitivity to GSH inhibition across a panel of cancer cell lines.
Materials:
- Cancer Cell Line Panel: 20-50 lines with sequenced genomes (e.g., from CCLE), including isogenic pairs with/without mutations of interest.
- GSH Inhibitors: Buthionine sulfoximine (BSO, 10-1000 µM), or specific inhibitors like Glutaminase inhibitor (CB-839, 0.1-10 µM).
- Viability Assay Reagent: CellTiter-Glo 2.0 Assay (ATP-based luminescence).
- GSH/GSSG Detection: GSH/GSSG-Glo Assay.
- ROS Detection: CellROX Green Reagent or H2DCFDA.
- Equipment: 96-well plate reader (luminescence, fluorescence), CO2 incubator.
Procedure:
- Seed cells in 96-well plates at optimal density (e.g., 2000 cells/well) and allow to adhere overnight.
- Treat cells with a 10-point, 1:3 serial dilution of the GSH inhibitor for 72-96 hours. Include DMSO vehicle controls.
- Measure Viability: Add an equal volume of CellTiter-Glo 2.0 reagent to each well, shake, incubate for 10 min, and record luminescence.
- Calculate IC50 values using non-linear regression (four-parameter logistic model) in software like GraphPad Prism.
- Correlate Sensitivity: Plot IC50 values against genetic features (e.g., mutation status) to identify synthetic lethal interactions.
- Parallel Mechanistic Assay: In a separate plate, treat sensitive and resistant lines with IC80 dose for 24h. Harvest cells for:
- GSH Depletion: Using GSH/GSSG-Glo Assay per manufacturer's protocol.
- ROS Induction: Incubate with 5 µM CellROX Green for 30 min, wash, and measure fluorescence.
Protocol: In Vivo Combination Efficacy Study
Objective: To evaluate the anti-tumor efficacy and immune memory of GSH inhibition combined with anti-PD-1 therapy in a syngeneic mouse model.
Materials:
- Mice: C57BL/6 mice, 6-8 weeks old (n=10 per group).
- Cell Line: Murine cancer line with relevant genetic background (e.g., KrasG12D; Keap1-/- lung cancer cells).
- Drugs:
- GSH Inhibitor: BSO (intraperitoneal, 100 mg/kg/day) or specific agent.
- Immune Checkpoint Inhibitor: Anti-mouse PD-1 antibody (clone RMP1-14, 200 µg/dose, intraperitoneal, twice weekly).
- Flow Cytometry Antibodies: Anti-mouse CD45, CD3, CD8, CD4, PD-1, TIM-3, FoxP3, CD11b, Gr-1, F4/80.
- Tumor Dissociation Kit: GentleMACS with appropriate enzymes.
Procedure:
- Tumor Implantation: Subcutaneously inject 0.5 x 10^6 cells in 100 µL Matrigel/PBS into the right flank.
- Randomization & Treatment: When tumors reach ~100 mm³, randomize mice into four groups: Vehicle, GSHi alone, anti-PD-1 alone, Combination.
- Administration: Treat for 3 weeks as per dosing schedule above. Monitor tumor volume (caliper) and body weight bi-weekly.
- Endpoint Analysis:
- Tumor Growth: Plot mean tumor volume ± SEM. Perform statistical analysis (two-way ANOVA).
- Harvest: On day 22, euthanize mice. Harvest tumors and spleens.
- Immune Profiling: a. Create single-cell suspension from tumors using a dissociation kit. b. Stain for surface markers (CD45, CD3, CD8, CD4, PD-1, TIM-3, CD11b, Gr-1). c. For Tregs, perform intracellular staining for FoxP3 after fixation/permeabilization. d. Analyze by flow cytometry. Calculate absolute numbers and frequencies of immune subsets.
- Memory Challenge: In a separate cohort of mice deemed "cured," re-challenge with the same tumor cells on the opposite flank to assess immunological memory.
Workflow Diagram: In Vivo Study Design
Diagram Title: In Vivo Combination Therapy Efficacy Workflow
The Scientist's Toolkit: Key Research Reagents
Table 3: Essential Reagents for Investigating GSH/Checkpoint Synergy
| Reagent Category | Specific Product/Example | Function & Application |
|---|---|---|
| GSH System Inhibitors | Buthionine Sulfoximine (BSO) | Irreversible inhibitor of γ-glutamylcysteine synthetase; depletes cellular GSH pools. |
| Glutaminase Inhibitor (CB-839, Telaglenastat) | Oral inhibitor of glutaminase; reduces glutamate needed for GSH synthesis. | |
| Glutathione Reductase (GSR) Inhibitor (Carubicin, 1,3-bis(2-chloroethyl)-1-nitrosourea) | Inhibits GSH regeneration from GSSG, increasing oxidative stress. | |
| Ferroptosis Inducers | RSL3, ML162 | Direct inhibitors of GPX4, leading to lethal lipid peroxide accumulation. |
| Erastin | Inhibits system Xc- cystine/glutamate antiporter, depleting cysteine for GSH synthesis. | |
| Checkpoint Blockers | Anti-human/mouse PD-1 (e.g., Nivolumab, RMP1-14 clone) | Blocks PD-1 on T-cells, reversing T-cell exhaustion. Critical for in vivo combo studies. |
| Anti-human/mouse PD-L1 (e.g., Atezolizumab, 10F.9G2 clone) | Blocks PD-L1 on tumor/immune cells, preventing inhibitory signaling. | |
| Detection Assays | GSH/GSSG-Glo Assay (Promega) | Quantifies total, reduced (GSH), and oxidized (GSSG) glutathione in cells. |
| Lipid Peroxidation Assay (C11-BODIPY 581/591) | Fluorescent probe to measure lipid peroxidation in live cells (flow cytometry or imaging). | |
| CellTiter-Glo 2.0 (Promega) | Luminescent assay for quantifying viable cells based on ATP content. | |
| Immune Profiling | TruStain FcX (anti-mouse CD16/32) | Fc receptor blocking antibody to reduce non-specific antibody binding in flow cytometry. |
| FoxP3 / Transcription Factor Staining Buffer Set | Permeabilization buffers for intracellular staining of transcription factors and cytokines. | |
| Tumor Dissociation | Mouse Tumor Dissociation Kit (Miltenyi) | Optimized enzyme mix for gentle and efficient preparation of single-cell suspensions from murine tumors. |
Conclusion
NADPH stands as the indispensable linchpin connecting and powering the glutathione and thioredoxin systems, which together form a resilient, multi-layered defense against oxidative and nitrosative stress. This review synthesized foundational biochemistry with advanced methodologies, providing a roadmap for accurate measurement and experimental optimization. The comparative analysis highlights the systems' unique and overlapping roles, emphasizing the need for precise targeting. The future of redox medicine lies in sophisticated, compartment-specific modulation of NADPH metabolism, leveraging synthetic lethality in cancer, enhancing resilience in aging and neurodegeneration, and developing validated biomarkers for clinical translation. Moving beyond broad antioxidant approaches to finely tuned, system-specific interventions represents the next frontier in targeting redox biology for therapeutic gain.