Mrx1-roGFP2: A Revolutionary Biosensor for Real-Time Mycothiol Redox Analysis in Corynebacterium
This article provides a comprehensive guide to the Mrx1-roGFP2 biosensor, a cutting-edge tool for quantifying the mycothiol redox state in Corynebacterium species, including the pathogen C.
Mrx1-roGFP2: A Revolutionary Biosensor for Real-Time Mycothiol Redox Analysis in Corynebacterium
Abstract
This article provides a comprehensive guide to the Mrx1-roGFP2 biosensor, a cutting-edge tool for quantifying the mycothiol redox state in Corynebacterium species, including the pathogen C. glutamicum. We explore the foundational science of mycothiol as a critical bacterial antioxidant, detail the molecular design and application methodology of the biosensor, and offer practical troubleshooting advice. The content validates Mrx1-roGFP2 against traditional techniques and discusses its superior specificity and dynamic range. Aimed at researchers and drug developers, this resource highlights the sensor's potential in studying redox biology, identifying novel drug targets, and developing anti-infective strategies against Corynebacterial infections.
Understanding Mycothiol and the Need for Redox Biosensors in Corynebacterium
Mycothiol (MSH) is the dominant low-molecular-weight (LMW) thiol in Actinomycetes, including the genera Mycobacterium and Corynebacterium. It functions analogously to glutathione (GSH) in eukaryotes and other bacteria, serving as a critical redox buffer, detoxifying electrophiles, and combating oxidative stress. Within the thesis context of utilizing Mrx1-roGFP2 for monitoring the mycothiol redox state in Corynebacterium, understanding MSH's biosynthesis, chemical properties, and redox cycling is foundational. This whitepaper provides a technical guide to MSH, focusing on its quantification, redox biology, and the application of modern genetically encoded biosensors.
Biosynthesis, Structure, and Chemical Properties
Mycothiol (acetyl-Cys-GlcN-myo-inositol) is synthesized through a multi-step pathway. Its unique structure features a cysteine residue with a free thiol group, which is the redox-active center. The redox potential (E'₀) of the MSH/mycothiol disulfide (MSSM) couple is approximately -0.24 V to -0.23 V, making it a strong reducing agent suitable for maintaining intracellular reduction potential.
Table 1: Core Properties of Mycothiol vs. Glutathione
| Property | Mycothiol (MSH) | Glutathione (GSH) |
|---|---|---|
| Chemical Formula | C₁₇H₃₀N₂O₁₂S | C₁₀H₁₇N₃O₆S |
| Molecular Weight | 486.5 g/mol | 307.3 g/mol |
| Redox Potential (E'₀) | ~ -0.24 V | -0.24 to -0.23 V |
| Dominant Organisms | Actinomycetes (Mycobacterium, Corynebacterium) | Eukaryotes, Gram-negative bacteria |
| Biosynthesis Genes | mshA, mshB, mshC, mshD | gshA, gshB |
Quantitative Analysis of Mycothiol Pools
Accurate measurement of reduced (MSH) and oxidized (MSSM) mycothiol is crucial. Modern methods typically involve derivatization with monobromobimane (mBBr) followed by HPLC or LC-MS/MS analysis.
Table 2: Typical Mycothiol Concentrations in Actinomycetes
| Organism | Condition | Total MSH (μM) | % Reduced (MSH) | Method | Reference Year |
|---|---|---|---|---|---|
| C. glutamicum | Exponential Growth | 1500 - 2500 | >95% | HPLC (mBBr) | 2023 |
| M. smegmatis | Mid-log phase | 2000 - 3500 | ~90-98% | LC-MS/MS | 2022 |
| M. tuberculosis | In vitro culture | 1000 - 2000 | ~85-95% | HPLC (mBBr) | 2021 |
| C. glutamicum | H₂O₂ stress (1 mM) | ~2000 | ~70% | Mrx1-roGFP2 + HPLC | 2023 |
Protocol 3.1: Quantification of MSH/MSSM by HPLC with mBBr Derivatization
- Cell Extraction: Rapidly pellet 5-10 mL of bacterial culture. Resuspend in 500 μL of 40 mM methanesulfonic acid, 10 mM diethylenetriaminepentaacetic acid (DTPA) to acidify and inhibit oxidation. Disrupt cells via bead-beating or sonication on ice.
- Protein Precipitation: Centrifuge at 16,000 x g for 15 min at 4°C. Transfer supernatant to a new tube.
- Derivatization: Mix 100 μL of extract with 10 μL of 50 mM mBBr in acetonitrile and 90 μL of 200 mM HEPES, pH 8.0. Incubate in the dark at room temperature for 15 min.
- Reaction Quench: Add 10 μL of 1 M methanesulfonic acid to stop the reaction.
- HPLC Analysis: Inject samples onto a reverse-phase C18 column. Use a gradient of solvent A (0.1% trifluoroacetic acid in water) and B (0.1% TFA in acetonitrile). Detect bimane derivatives by fluorescence (excitation 390 nm, emission 480 nm).
- Quantification: Compare peak areas to standard curves generated from pure MSH and MSSM standards treated identically.
The Mrx1-roGFP2 System for Real-Time Redox Monitoring
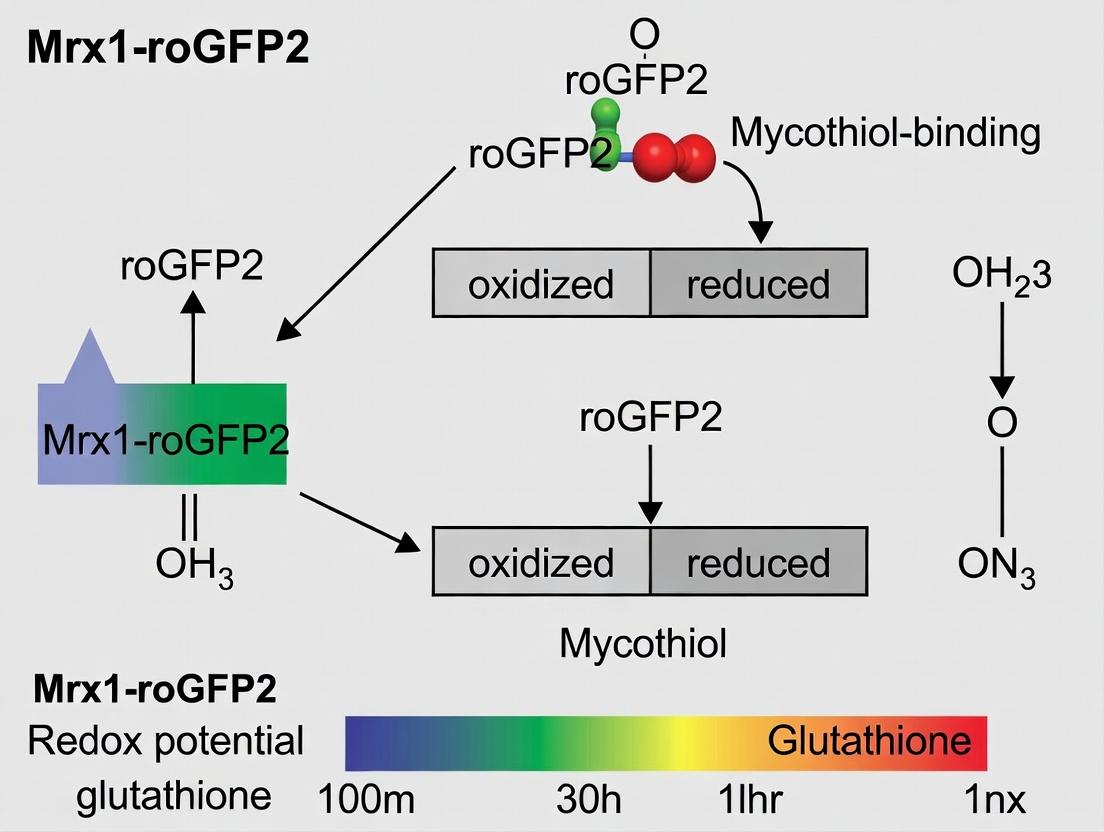
The fusion protein Mrx1-roGFP2 is a genetically encoded biosensor for dynamic, real-time measurement of the MSH redox potential (EMSH) in living cells. Mycobacterium redoxins 1 (Mrx1) is a mycothiol-dependent oxidoreductase that selectively interacts with the MSH/MSSM couple. When fused to the redox-sensitive green fluorescent protein 2 (roGFP2), it transchanges the cellular EMSH into a measurable fluorescence ratio.
Protocol 4.1: Calibration and Use of Mrx1-roGFP2 in Corynebacterium
- Sensor Expression: Transform Corynebacterium (e.g., C. glutamicum) with a plasmid expressing mrx1-roGFP2 under a constitutive or inducible promoter.
- Fluorescence Measurement: In a microplate reader or fluorometer, excite roGFP2 at 400 nm and 490 nm, and measure emission at 510 nm. Calculate the ratio R = I₄₀₀ / I₄₉₀.
- In vivo Calibration:
- Full Oxidation (Rox): Treat cells with 10 mM diamide for 5-10 minutes.
- Full Reduction (Rred): Treat cells with 10 mM dithiothreitol (DTT) for 5-10 minutes.
- Data Calculation: Compute the degree of oxidation (OxD) of the biosensor:
- OxD = (R - Rred) / (Rox - R_red)
- Relating OxD to EMSH: The redox potential is calculated using the Nernst equation:
- EMSH = EroGFP2 - (RT/nF) * ln(OxD⁻¹ - 1)
- Where EroGFP2 is the standard potential of roGFP2 (~ -280 mV), R is gas constant, T is temperature, n=2, F is Faraday's constant.
Diagram 1: Mrx1-roGFP2 Sensing Mechanism
Diagram 2: Mrx1-roGFP2 Experimental Workflow
The Scientist's Toolkit: Key Research Reagent Solutions
Table 3: Essential Reagents for Mycothiol and Mrx1-roGFP2 Research
| Reagent / Material | Function / Application | Key Notes |
|---|---|---|
| Monobromobimane (mBBr) | Thiol-specific alkylating agent for derivatizing MSH for HPLC/LC-MS detection. | Light-sensitive. Use fresh solution in acetonitrile. |
| Mycothiol (MSH) Standard | Quantitative standard for calibration curves in analytical chemistry. | Commercially available but costly. Store desiccated at -20°C. |
| Diamide (Azodicarboxylic acid bis(dimethylamide)) | Thiol-oxidizing agent used for in vivo calibration of roGFP2 sensors (induces R_ox). | Prepare fresh stock in buffer or medium. |
| Dithiothreitol (DTT) | Strong reducing agent used for in vivo calibration of roGFP2 sensors (induces R_red). | Prepare fresh stock and use under anaerobic conditions if possible. |
| HEPES Buffer (pH 8.0) | Alkaline buffer for optimal mBBr derivatization reaction. | Critical for efficient bimane adduct formation. |
| Methanesulfonic Acid with DTPA | Acidic extraction medium that rapidly quenches metabolism and prevents auto-oxidation of MSH. | DTPA chelates metals that catalyze oxidation. |
| Mrx1-roGFP2 Plasmid | Genetically encoded biosensor for live-cell imaging and fluorometry of E_MSH. | Must be cloned into an appropriate expression vector for the target Actinomycete (e.g., Corynebacterium). |
| Reverse-Phase C18 HPLC Column | Stationary phase for separating bimane-derivatized thiols (MSH-bimane, MSSM-bimane). | Requires HPLC system with fluorescence detector. |
Redox Homeostasis as a Critical Vulnerability in Bacterial Pathogens
Redox homeostasis, the dynamic balance of reduction-oxidation reactions within a cell, is fundamental to bacterial physiology, governing processes from energy metabolism to stress defense. For bacterial pathogens, this balance is particularly critical, as they must survive the oxidative bursts of host immune cells. Disrupting this delicate equilibrium presents a promising avenue for novel antimicrobial strategies. This whitepaper frames this vulnerability within the specific context of mycothiol-dependent redox systems in Actinobacteria, such as Corynebacterium species, and the pivotal role of the genetically encoded biosensor Mrx1-roGFP2 in elucidating these pathways.
Mycothiol (MSH) is the dominant low-molecular-weight thiol in Actinobacteria, functionally analogous to glutathione in other organisms. The Mrx1-roGFP2 system is a fusion protein comprising the mycothiol-dependent oxidoreductase Mrx1 linked to the redox-sensitive green fluorescent protein 2 (roGFP2). This sensor specifically transchanges the mycothiol redox potential (E~MSH~) into a quantifiable fluorescence signal, enabling real-time, in vivo monitoring of the mycothiol redox state. Research leveraging this tool is central to the thesis that targeting MSH biosynthesis or redox cycling represents a potent, pathogen-specific therapeutic strategy.
Core Principles of Bacterial Redox Homeostasis and Its Vulnerabilities
Pathogens face endogenous redox challenges from metabolism (e.g., ROS from aerobic respiration) and exogenous attacks from host immune cells (e.g., NADPH oxidase producing superoxide and hydrogen peroxide). To maintain homeostasis, bacteria deploy a suite of antioxidant systems:
- Low-Molecular-Weight Thiols: Mycothiol (Actinobacteria), Bacillithiol (Firmicutes), Glutathione (Gram-negatives, some Gram-positives).
- Enzymatic Defenses: Superoxide dismutases (SOD), catalases, peroxidases (e.g., alkyl hydroperoxide reductase, AhpC), and thiol-disulfide oxidoreductases.
- Transcriptional Regulators: Sensors like OxyR, SoxR, and SigH that upregulate defense genes in response to oxidative stress.
The vulnerability lies in the essentiality and pathogen-specificity of some components. The mycothiol pathway, absent in humans, is a prime example. Inhibiting its biosynthesis (e.g., via MshC inhibitors) or the recycling of its oxidized form (mycothione, MSSM) leaves the bacterium defenseless against host oxidative attack.
Diagram: Mycothiol Redox Cycle & Mrx1-roGFP2 Sensing Mechanism
Title: Mycothiol Redox Cycle and roGFP2 Sensing
Quantitative Data on Redox Stress & Inhibitor Efficacy
Table 1: Impact of Redox-Stress Agents on Mycothiol Redox Potential (E~MSH~) in Corynebacterium glutamicum Measured with Mrx1-roGFP2
| Stressor/Inhibitor | Concentration | E~MSH~ (mV) | Δ from Baseline (mV) | Key Implication |
|---|---|---|---|---|
| Baseline (Untreated) | - | -315 ± 5 | 0 | Homeostatic setpoint |
| Hydrogen Peroxide (H₂O₂) | 0.5 mM | -260 ± 10 | +55 | Significant oxidative shift |
| Diamide (Thiol oxidant) | 1 mM | -245 ± 8 | +70 | Rapid disulfide stress |
| MshC Inhibitor (Targets biosynthesis) | 50 µM | -290 ± 7 | +25 | Depletion of reduced MSH pool |
| In vivo Macrophage encounter | N/A | -270 ± 15 | +45 | Host phagocytosis induces oxidation |
Table 2: Susceptibility of Pathogenic Actinobacteria to Redox-Targeting Compounds
| Pathogen | Mycothiol Pathway Essential? | MshC Inhibitor MIC (µg/mL) | Potentiation of H₂O₂ Killing (Fold) | Reference Strain MIC Ratio |
|---|---|---|---|---|
| Mycobacterium tuberculosis | Yes | 4 - 16 | 100 - 1000 | 1 (Reference) |
| Corynebacterium diphtheriae | Yes | 2 - 8 | 50 - 200 | 0.5 - 1 |
| Corynebacterium striatum (MDR) | Yes | 8 - 32 | 10 - 50 | 2 - 4 |
| Rhodococcus equi | Yes | 1 - 4 | >1000 | 0.25 - 0.5 |
Experimental Protocols for Key Assays
Protocol 1: In Vivo Mycothiol Redox Potential (E~MSH~) Measurement using Mrx1-roGFP2
Objective: To quantify the real-time mycothiol redox state in live Corynebacterium cells. Reagents: See "Scientist's Toolkit" below. Procedure:
- Strain Preparation: Transform Corynebacterium strain of interest with a plasmid expressing Mrx1-roGFP2 under a constitutive promoter (e.g., P~sod~). Grow to mid-log phase (OD~600~ ~0.6) in appropriate media.
- Sample Loading: Harvest cells, wash twice, and resuspend in PBS or fresh media to OD~600~ of 0.2. Distribute 200 µL aliquots into a black, clear-bottom 96-well plate.
- Fluorometric Reading: Using a plate reader capable of kinetic measurements and excitation scanning, record fluorescence intensities sequentially at two excitations/one emission:
- Ex 405 nm / Em 528 nm (oxidized-state sensitive)
- Ex 488 nm / Em 528 nm (reduced-state sensitive)
- Include wells with media only for background subtraction.
- Calibration (Post-read): For each well, permeabilize cells with 100 µM digitonin. Add 10 mM DTT (full reduction) followed by 10 mM diamide (full oxidation). Record fluorescence at both excitations after each treatment.
- Data Analysis:
- Calculate the background-subtracted ratio R = I~405~/I~488~.
- Determine R~min~ (DTT) and R~max~ (diamide).
- Calculate the degree of oxidation: OxD = (R - R~min~) / (R~max~ - R~min~).
- Convert OxD to E~MSH~ using the Nernst equation: E~MSH~ = E~0~ - (59.1/n)*log((1-OxD)/OxD) at 30°C, where E~0~ for Mrx1-roGFP2 is -280 mV and n=2.
Protocol 2: Assessing Redox Vulnerability via Checkerboard Synergy Assay
Objective: To determine the synergistic effect between mycothiol biosynthesis inhibitors and conventional oxidants/antibiotics. Procedure:
- Prepare Inhibitor Stocks: MshC inhibitor in DMSO, H₂O₂ in water, and a first-line antibiotic (e.g., ampicillin for Corynebacteria) in water.
- Checkerboard Setup: In a 96-well plate, serially dilute the MshC inhibitor along the x-axis (e.g., 64 to 0.125 µg/mL) and the co-stressor (H₂O₂ or antibiotic) along the y-axis.
- Inoculation: Add a standardized bacterial inoculum (5x10^5 CFU/mL) to each well. Include growth and sterility controls.
- Incubation & Reading: Incubate statically at 37°C for 18-24 hours. Measure OD~600~.
- Analysis: Calculate the Fractional Inhibitory Concentration Index (FICI). FICI ≤ 0.5 indicates synergy, confirming redox homeostasis as a vulnerability.
Diagram: Experimental Workflow for E_MSH Measurement
Title: Mrx1-roGFP2 Redox Sensing Workflow
The Scientist's Toolkit: Key Research Reagent Solutions
Table 3: Essential Materials for Mrx1-roGFP2 Redox Research
| Item | Function/Description | Example Product/Source |
|---|---|---|
| Mrx1-roGFP2 Plasmid | Genetically encoded biosensor for specific, ratiometric measurement of mycothiol redox potential. | Available from Addgene (e.g., pMN016 backbone for Corynebacteria). |
| Corynebacterium glutamicum ATCC 13032 | Well-characterized, non-pathogenic model organism for Actinobacterial redox biology. | ATCC. |
| Pathogenic Corynebacterium Strains (e.g., C. diphtheriae) | Target pathogens for validating vulnerabilities. | Clinical isolate collections, CDC. |
| MshC Inhibitor (e.g., 2-(Benzylthio)-4,5-dihydro-1H-imidazole) | Small molecule inhibitor of mycothiol ligase (MshC), depleting cellular MSH. | Tocris Bioscience (Cat. No. 6700); Synthesized in-house. |
| Diamide (Azodicarboxylic acid bis(dimethylamide)) | Thiol-specific oxidizing agent used for in-well calibration of the roGFP2 sensor. | Sigma-Aldrich (D3648). |
| DTT (Dithiothreitol) | Reducing agent used for in-well calibration of the roGFP2 sensor. | Thermo Fisher Scientific (R0861). |
| Black, Clear-bottom 96-well Plates | Optimal for fluorescence-based readings with minimal cross-talk. | Corning (3603). |
| Fluorescence Plate Reader | Capable of kinetic reads and dual-excitation scanning (405 nm & 488 nm filters). | e.g., BioTek Synergy H1, Tecan Spark. |
| Specialized Growth Media (e.g., BHI, CGXII) | For cultivation of fastidious Corynebacterial species. | BD Bacto Brain Heart Infusion; Custom CGXII minimal media. |
The redox balance within bacterial cells is a critical determinant of survival, pathogenicity, and industrial productivity. The central thesis of utilizing Mrx1-roGFP2 for real-time, dynamic measurement of mycothiol redox potential (EGSH) provides a transformative lens through which to examine the genus Corynebacterium. This probe, a fusion of mycothiol-dependent oxidoreductase (Mrx1) and redox-sensitive green fluorescent protein (roGFP2), enables unparalleled in vivo analysis of redox physiology. This whitepaper positions Corynebacterium glutamicum as the foundational model for developing this technology and explores its subsequent application to pathogenic relatives like Corynebacterium diphtheriae and Corynebacterium striatum, bridging fundamental biochemistry with drug discovery.
Corynebacterium glutamicum: The Pioneering Model System
C. glutamicum is a non-pathogenic, high-GC Gram-positive bacterium, renowned as an industrial workhorse for amino acid production. Its well-characterized physiology, genetic tractability, and dependence on mycothiol (MSH; a functional analog of glutathione in Actinobacteria) as its primary low-molecular-weight thiol make it the ideal chassis for developing and validating the Mrx1-roGFP2 biosensor.
Key Physiological and Redox Parameters of C. glutamicum: Table 1: Core Quantitative Data for C. glutamicum
| Parameter | Typical Value/Range | Significance for Redox Studies |
|---|---|---|
| Optimal Growth Temperature | 30°C | Standard condition for bioreactor and plate assays. |
| Intracellular pH | ~7.5 | Critical for roGFP2 calibration (pH-sensitive). |
| Mycothiol (MSH) Pool | 5-25 nmol/mg dry weight | Primary redox buffer; target for Mrx1-roGFP2. |
| Doubling Time (Minimal Media) | 2-3 hours | Enables rapid generation of redox perturbation data. |
| EGSH (in vivo, estimated) | -260 to -290 mV | Baseline redox potential; Mrx1-roGFP2 measures dynamic changes. |
Experimental Protocol: Calibration of Mrx1-roGFP2 in C. glutamicum
- Strain Construction: Integrate a single genomic copy of the mrx1-roGFP2 gene fusion (under a constitutive promoter like sod or tuf) into C. glutamicum ATCC 13032.
- Culture & Sample Preparation: Grow the sensor strain to mid-exponential phase (OD600 ~5-8). Harvest cells, wash twice in 50 mM potassium phosphate buffer (pH 7.0), and resuspend to OD600 ~1.0.
- In vitro Probe Calibration:
- Aliquot cell suspension into a quartz cuvette.
- Add 10 mM H2O2 to fully oxidize the roGFP2 moiety. Record fluorescence intensity at 510 nm with excitations at 400 nm (I400) and 490 nm (I490).
- Add 20 mM Dithiothreitol (DTT) to fully reduce the probe. Record I400 and I490 again.
- Calculate the fluorescence excitation ratio R = I400 / I490.
- Determine the degree of oxidation (OxD) using: OxD = (R - Rred) / (Rox - Rred), where Rred and Rox are ratios for fully reduced and oxidized states.
- In vivo Measurement: For real-time monitoring, grow the sensor strain in a bioreactor or plate reader with fluorescence capabilities. Continuously monitor the 400/490 nm excitation ratio at 510 nm emission. Relate the measured ratio R to OxD using the calibration values.
Pathogenic Corynebacteria: Redox State as a Virulence Determinant
Pathogenic corynebacteria, such as C. diphtheriae (diphtheria) and C. striatum (opportunistic infections), face acute oxidative stress during host infection (e.g., from macrophage-derived ROS). Their redox buffering capacity, primarily via MSH, is a key virulence factor. The Mrx1-roGFP2 sensor, optimized in C. glutamicum, allows direct interrogation of this link.
Comparative Analysis of Corynebacterium Species: Table 2: Comparative Data: Model vs. Pathogenic Corynebacteria
| Feature | C. glutamicum (Model) | C. diphtheriae (Pathogen) | C. striatum (Pathogen) |
|---|---|---|---|
| Primary Niche | Soil, Fermentation | Human respiratory tract | Human skin, nasopharynx |
| Pathogenicity | Non-pathogenic (GRAS) | Toxin-mediated (Diphtheria toxin) | Opportunistic (Biofilm, Multi-drug resistance) |
| MSH Biosynthesis Genes | Complete (mshA-D) | Complete | Complete |
| Redox Challenge in Host | N/A | Phagocyte oxidative burst | Phagocyte oxidative burst, antibiotic stress |
| EGSH under Stress (Measured by Mrx1-roGFP2) | Shifts positive by ~20-40 mV with 1 mM H2O2 | Shifts positive by >50 mV; recovery rate correlates with virulence | Chronic oxidative shift in MDR isolates; linked to persistence |
| Key Drug Target from Redox | N/A | MshB (mycothiol biosynthesis) | MshC/Mtr (MSH biosynthesis & redox regulation) |
Experimental Protocol: Assessing Redox Virulence Phenotype in Pathogens
- Sensor Transfer: Clone the functional mrx1-roGFP2 expression cassette into an E. coli-Corynebacterium shuttle vector (e.g., pEC-K18mob2) and transform into the target pathogen (e.g., C. diphtheriae NCTC 13129).
- Macrophage Infection Assay:
- Differentiate THP-1 human monocytic cells into macrophages using PMA.
- Infect macrophages with the Mrx1-roGFP2-expressing pathogen at an MOI of 10:1.
- At time points (e.g., 1h, 4h, 8h post-infection), lyse macrophages with 0.1% Triton X-100.
- Immediately measure the fluorescence ratio (400/490 nm ex, 510 nm em) of the released bacteria using a plate reader to determine their in situ EGSH.
- Correlation with Virulence: Compare the magnitude and kinetics of EGSH oxidation/recovery across wild-type and mutant strains (e.g., MSH biosynthesis mutants). Correlate with traditional virulence metrics (LD50, colonization load).
Signaling and Redox Pathways: A Systems View
The Mrx1-roGFP2 sensor reveals the integrated response of cellular pathways to redox perturbations. Key regulators include MtrA (response regulator), SigH (redox-stress sigma factor), and the MarR-type regulator OsdR.
Diagram Title: Corynebacterial Redox Stress Signaling Network
The Scientist's Toolkit: Research Reagent Solutions
Table 3: Essential Reagents for Mrx1-roGFP2 Redox Research in Corynebacteria
| Reagent / Material | Function / Purpose | Example Product/Catalog |
|---|---|---|
| Mrx1-roGFP2 Plasmid | Biosensor expression; genomic integration or shuttle vector. | pK18mrx1-roGFP2 (Addgene #183227) |
| Corynebacterium Electrocompetent Cells | Efficient transformation of sensor construct. | C. glutamicum ATCC 13032 competent cells. |
| Mycothiol (MSH) Standard | HPLC calibration for quantitative MSH pool measurement. | (BioVision, MSH ELISA Kit) |
| Diamide | Thiol-specific oxidant; positive control for probe oxidation. | Sigma-Aldrich, D3648 |
| Dithiothreitol (DTT) | Strong reducing agent; negative control for probe reduction. | Thermo Fisher, R0861 |
| Fluorescence Plate Reader | High-throughput ratiometric measurement (400/490 ex, 510 em). | Tecan Spark, BMG CLARIOstar |
| Anaerobic Chamber | For creating defined low-oxygen redox environments. | Coy Laboratory Products, Vinyl Glove Box |
| THP-1 Human Monocyte Cell Line | Model for macrophage infection and intravacuolar redox assays. | ATCC, TIB-202 |
| MshB Inhibitor (1-Dodecyl-4-methoxypiperidin-4-ol) | Tool compound to deplete MSH and validate redox target. | Cayman Chemical, 24745 |
The deployment of Mrx1-roGFP2, refined in the model C. glutamicum, has created a paradigm for redox research across the Corynebacterium genus. It quantitatively links fundamental mycothiol biochemistry to the pathogenicity mechanisms of dangerous relatives. This approach validates MSH biosynthesis and regulatory pathways as high-value targets for novel anti-infectives, particularly against multidrug-resistant C. striatum. Future work will involve high-throughput screening of compound libraries using the Mrx1-roGFP2 biosensor in pathogenic strains to identify redox-disrupting therapeutics.
Limitations of Traditional Redox State Assessment Methods (HPLC, MS)
Redox homeostasis is a fundamental biological parameter, and its precise measurement is critical in fields ranging from microbial physiology to drug development. In the specific context of Corynebacterium research, understanding the redox state of low-molecular-weight thiols, primarily mycothiol (MSH), is key to elucidating oxidative stress response mechanisms. This whitepaper examines the technical limitations of traditional chromatographic and spectrometric methods for assessing redox states, framing the discussion within the broader thesis that genetically encoded biosensors like Mrx1-roGFP2 offer a superior alternative for dynamic, in vivo measurement of the MSH redox potential in Corynebacterium.
Core Limitations of HPLC and MS-Based Methods
While High-Performance Liquid Chromatography (HPLC) and Mass Spectrometry (MS) are considered gold standards for quantitative biochemical analysis, they possess significant drawbacks for measuring dynamic redox states.
Technical and Practical Limitations
| Limitation Category | Specific Drawback | Consequence for Redox State Assessment |
|---|---|---|
| Temporal Resolution | Sample processing is slow (min to hours). Quenching required to "freeze" redox state. | Provides only a single snapshot. Cannot capture rapid, transient redox fluctuations. |
| Spatial Resolution | Requires cell lysis; homogenizes subcellular compartments. | Loses all information on compartment-specific redox dynamics (e.g., cytosol vs. periplasm). |
| Throughput & Cost | Low throughput; expensive instrumentation and consumables; requires specialized expertise. | Impedes large-scale screens (e.g., for drug candidates affecting redox balance). |
| Artifact Introduction | Quenching (e.g., with acid) may be incomplete or may itself alter redox equilibria. Oxidation during sample preparation. | Measured values may not reflect the true in vivo state at the moment of sampling. |
| Data Complexity | Requires separation and identification of reduced/oxidized species (e.g., MSSM from MSH). Complex data analysis. | Increases time to result and potential for interpretation errors. |
| Invasiveness | Destructive by nature; cell death is required for measurement. | Precludes longitudinal studies in the same cell population. |
The table below summarizes key performance parameters comparing traditional methods to the Mrx1-roGFP2 biosensor approach.
Table 1: Comparative Analysis of Redox Assessment Methodologies
| Parameter | HPLC with UV/ECD | LC-MS/MS | Mrx1-roGFP2 (Biosensor) |
|---|---|---|---|
| Temporal Resolution | Minutes to Hours | Minutes to Hours | < Seconds |
| Spatial Resolution | Whole-cell lysate | Whole-cell lysate | Subcellular (e.g., cytosol-specific) |
| Measurement Context | Ex vivo, Destructive | Ex vivo, Destructive | In vivo, Non-destructive |
| Throughput | Low (samples/day) | Low (samples/day) | High (real-time, 96-well plate) |
| Primary Output | Absolute concentration [MSH], [MSSM] | Absolute concentration, isotope ratios | Ratio-metric (405/488 nm) → Live imaging of EMSH |
| Key Artifact Source | Quenching inefficiency, auto-oxidation | Quenching inefficiency, ion suppression | Potential biosensor overexpression effects |
| Cost per Sample | High | Very High | Low (post-initial genetic engineering) |
Experimental Protocols for Traditional Methods
To illustrate the complexity involved, here are standardized protocols for measuring mycothiol redox state via HPLC.
Protocol: HPLC-UV Analysis of Mycothiol inCorynebacterium
Objective: To quantify reduced (MSH) and oxidized (MSSM) mycothiol from a bacterial culture.
Materials:
- Quenching Solution: 40 mM methanesulfonic acid, 40 mM CHES, 0.1 mM diethylenetriaminepentaacetic acid (DTPA).
- Extraction Buffer: 50 mM formic acid, 0.1 mM DTPA, sparged with N₂.
- Derivatization Agent: 50 mM monobromobimane (mBBr) in acetonitrile (prepared fresh, kept in dark).
- HPLC System with UV-Vis detector, C18 reversed-phase column.
Procedure:
- Culture & Treatment: Grow Corynebacterium to mid-log phase. Apply oxidative stressor (e.g., H₂O₂) as required.
- Rapid Quenching: Rapidly mix 1 mL culture with 250 µL ice-cold quenching solution. Incubate on ice for 10 min.
- Cell Pellet: Centrifuge at 10,000 x g, 4°C for 5 min. Discard supernatant.
- Metabolite Extraction: Resuspend pellet in 500 µL ice-cold extraction buffer. Lyse cells via bead-beating or freeze-thaw cycles. Centrifuge at 16,000 x g, 4°C for 15 min.
- Derivatization: Transfer supernatant to a new tube. Add mBBr to a final concentration of 2 mM. Incubate at 37°C in the dark for 30 min. Stop reaction with 50 µL acetic acid.
- HPLC Analysis: Inject derivatized sample. Use gradient elution (mobile phase A: 0.1% trifluoroacetic acid in H₂O; B: acetonitrile). Detect mBBr-adducts at 380-450 nm (ex/em) or UV at 390 nm.
- Quantification: Calculate concentrations using standard curves for MSH-mBBr and MSSM-(mBBr)₂. Redox potential (EMSH) can be calculated using the Nernst equation.
Critical Limitations Demonstrated: The multi-step, slow process (Steps 2-6) allows for potential redox changes. The derivatization efficiency is critical. The result is a single, population-averaged value.
The Scientist's Toolkit: Research Reagent Solutions
Table 2: Essential Materials for Mycothiol Redox Research
| Item | Function & Relevance |
|---|---|
| Monobromobimane (mBBr) | Thiol-reactive fluorescent probe used to derivative and detect low-molecular-weight thiols (MSH) for HPLC analysis. |
| Diethylenetriaminepentaacetic acid (DTPA) | Metal chelator included in quenching/extraction buffers to prevent metal-catalyzed oxidation of thiols during sample prep. |
| Methanesulfonic Acid / CHES Buffer | A specific quenching system designed to rapidly lower pH and arrest metabolism without precipitating proteins, "freezing" the redox state. |
| Mycothiol (MSH) & Mycothiol Disulfide (MSSM) | Pure analytical standards essential for creating calibration curves to quantify absolute cellular concentrations via HPLC or MS. |
| Mrx1-roGFP2 Plasmid Construct | Genetically encoded biosensor for Corynebacterium; Mrx1 (mycoredoxin 1) specifically reduces roGFP2 in response to reduced MSH, enabling rationetric live-cell imaging. |
| roGFP2 (Oxidation-Reduction Sensitive GFP) | The fluorescent protein sensor core. Its disulfide bridge formation alters excitation peaks, allowing ratio-metric (405/488 nm) measurement of redox potential. |
Visualizing Methodological Pathways and Workflows
Traditional HPLC and MS methods provide absolute, quantitative data on thiol concentrations but are fundamentally ill-suited for capturing the dynamic, compartmentalized, and rapid nature of cellular redox biology. Their limitations in temporal and spatial resolution, invasiveness, and throughput are particularly pronounced in microbial systems like Corynebacterium. The integration of genetically encoded biosensors like Mrx1-roGFP2 directly addresses these gaps, enabling real-time, in vivo monitoring of the mycothiol redox potential within the native cellular context. This paradigm shift is essential for advancing our understanding of bacterial oxidative stress responses and for accelerating redox-targeted drug discovery.
This technical guide details the molecular engineering and application of Mrx1-roGFP2, a genetically encoded biosensor designed for real-time, specific monitoring of the mycothiol (MSH) redox potential within Corynebacterium species and other actinomycetes. The development of this sensor represents a pivotal advancement in the study of redox homeostasis in these industrially and medically significant bacteria, providing a foundational tool for research into oxidative stress responses and drug mechanisms.
From roGFP2 to a Mycothiol-Specific Probe
The core of Mrx1-roGFP2 is the redox-sensitive green fluorescent protein 2 (roGFP2). roGFP2 contains engineered cysteine residues (S147C and Q204C) that form a disulfide bond upon oxidation, causing a shift in its excitation spectrum. Ratios of fluorescence from excitation at 400 nm (protonated, reduced state) and 490 nm (deprotonated, oxidized state) provide a quantitative, rationetric readout independent of sensor concentration.
To confer specificity for the mycothiol redox couple (MSSM/MSH), roGFP2 was fused to Mycobacterium tuberculosis mycoredoxin 1 (Mrx1). Mrx1 is a glutaredoxin-like enzyme that specifically reduces mixed disulfides with mycothiol (mycothiolated proteins) via its active site CXXC motif. In the final construct, roGFP2 is fused to the N-terminus of Mrx1, allowing the roGFP2 disulfide to equilibrate with the mycothiol pool via the enzymatic activity of Mrx1.
Key Experimental Protocols
Sensor CalibrationIn Vitro
Purpose: To determine the sensor's dynamic range and establish the relationship between fluorescence ratio and mycothiol redox potential (E~MSH~). Procedure:
- Purified Mrx1-roGFP2 protein is treated with fully reducing (10 mM DTT) or oxidizing (10 mM diamide) buffers for 1 hour at room temperature.
- For intermediate potentials, a redox titration is performed using defined ratios of reduced (MSH) and oxidized (MSSM) mycothiol (e.g., 1 mM total mycothiol) in 100 mM potassium phosphate buffer, pH 7.0.
- The reaction mixture is incubated with 1 µM purified sensor for 2 hours at 30°C to reach equilibrium.
- Fluorescence excitation spectra (emission at 510 nm) are recorded from 370-500 nm.
- The ratio (R) of fluorescence intensity at 400 nm excitation (I~400~) to that at 490 nm excitation (I~490~) is calculated.
- Data are fitted to the Nernst equation: E~MSH~ = E~0'~ - (59.1 mV/n)log(R - R~ox~)/(R~red~ - R), where n=2 for the two-electron redox reaction, R~ox~ and R~red~ are the ratios for fully oxidized and reduced sensor, and E~0'~ is the standard redox potential for the MSSM/MSH couple (-221 mV at pH 7.0).
2In VivoExpression and Imaging inCorynebacterium glutamicum
Purpose: To monitor real-time intracellular mycothiol redox dynamics. Procedure:
- The mrx1-roGFP2 gene, codon-optimized for C. glutamicum, is cloned into an expression vector under a constitutive or inducible promoter (e.g., Ptac).
- C. glutamicum is transformed via electroporation.
- Cells are grown to mid-log phase in appropriate medium (e.g., BHI).
- For ratiometric imaging, cells are immobilized on agarose pads and imaged using a widefield or confocal fluorescence microscope equipped with appropriate filters (excitation: 400/30 nm and 490/20 nm; emission: 525/50 nm).
- Sequential images at both excitation wavelengths are captured. The 400 nm and 490 nm excitation images are background-subtracted and the ratio image (400 nm/490 nm) is calculated pixel-by-pixel.
- The ratio is converted to E~MSH~ using calibration parameters established in vitro.
Validation with Redox Perturbations
Purpose: To confirm sensor responsiveness to physiological oxidants. Procedure:
- C. glutamicum expressing Mrx1-roGFP2 is treated with sub-lethal concentrations of hydrogen peroxide (H~2~O~2~, e.g., 0.1-1 mM), diamide (e.g., 1 mM), or the antibiotic isoniazid (e.g., 100 µg/mL).
- Time-lapse ratiometric imaging is performed immediately after treatment.
- The median cellular ratio is plotted over time to observe oxidation kinetics.
- Recovery is monitored after oxidant removal or by adding fresh medium.
Data Presentation
Table 1: Key Spectral and Calibration Parameters of Mrx1-roGFP2
| Parameter | Value | Condition / Note |
|---|---|---|
| Dynamic Range (R~red~/R~ox~) | ~6.0 | In vitro, pH 7.0 |
| Oxidized Ratio (R~ox~) | 0.15 ± 0.02 | In vitro, 10 mM diamide |
| Reduced Ratio (R~red~) | 0.90 ± 0.05 | In vitro, 10 mM DTT |
| Midpoint Potential (E~1/2~) | -221 ± 5 mV | Matches E~0'~ for MSSM/MSH |
| Response Time (t~1/2~) | < 2 minutes | In vivo, upon 1 mM H~2~O~2~ addition |
| In vivo Resting E~MSH~ | -299 ± 8 mV | C. glutamicum, mid-log phase |
| In vivo Oxidized E~MSH~ | -235 ± 12 mV | C. glutamicum, 1 mM H~2~O~2~, 5 min |
Table 2: Research Reagent Solutions Toolkit
| Reagent / Material | Function & Specification |
|---|---|
| pAG1-Mrx1-roGFP2 Plasmid | Expression vector with codon-optimized gene for C. glutamicum. Selection marker: Kanamycin. |
| Purified Mycothiol (MSH) | For in vitro calibration. High-purity (>95%) required for accurate potential buffers. |
| MSSM (Oxidized Mycothiol) | For in vitro calibration. Prepared by air oxidation of MSH and verified by HPLC. |
| Diamide | Thiol-specific oxidant used for full sensor oxidation in vitro and in vivo. |
| Dithiothreitol (DTT) | Strong reducing agent for full sensor reduction in vitro. Not used in vivo. |
| Isoniazid (INH) | First-line anti-tuberculosis pro-drug; induces oxidative stress in mycobacteria and corynebacteria. Key for drug mechanism studies. |
| Corynebacterium glutamicum ATCC 13032 | Standard model organism for sensor development and actinobacterial redox biology. |
| BHI Growth Medium | Brain Heart Infusion; rich medium for robust growth of C. glutamicum. |
Visualizations
Title: Genetic Construction of Mrx1-roGFP2
Title: Workflow for In Vivo Mycothiol Redox Imaging
Title: Mrx1-roGFP2 Equilibration with Mycothiol Pool
Step-by-Step Protocol: Deploying Mrx1-roGFP2 in Your Corynebacterium Research
Vector Construction and Genomic Integration Strategies
This technical guide details the construction of expression vectors and their genomic integration for the expression of the Mrx1-roGFP2 redox biosensor in Corynebacterium glutamicum and related species. The work is framed within a thesis investigating mycothiol-dependent redox homeostasis using this genetically encoded probe. The Mrx1-roGFP2 fusion protein allows real-time, rationetric monitoring of the mycothiol redox potential (MSSH/MSSC) in live bacterial cells, providing critical insights for metabolic engineering and drug development targeting redox pathways.
Core Vector Design and Components
Efficient expression in Corynebacterium requires vectors with specific genetic elements. The table below summarizes key quantitative parameters for common components.
Table 1: Key Vector Components and Their Specifications
| Component | Type/Name | Size (bp) | Key Feature/Function | Optimal Source/Origin |
|---|---|---|---|---|
| Origin of Replication | pCG1 (or pBL1) | ~4,500 | Medium-copy-number, Corynebacterium-specific | Native C. glutamicum plasmid |
| E. coli ori | ColE1 | ~600 | High-copy propagation in cloning host | Standard cloning vector |
| Selection Marker | Kanamycin Resistance (aph(3')-Ia) | ~815 | Conffers resistance to kanamycin (25 µg/mL) | Transposon Tn5 |
| Promoter | Ptac or sod promoter | ~200 | Strong, constitutive or inducible expression | E. coli or C. glutamicum chromosome |
| Ribosome Binding Site | corynebacterial RBS (AGGAGG) | ~8 | Optimal translation initiation in high-GC hosts | Consensus sequence |
| Target Gene | mrx1-roGFP2 fusion | ~1,200 | Encodes the redox biosensor | Cloned from M. tuberculosis Mrx1 & roGFP2 |
| Terminator | fd terminator | ~100 | Efficient transcription termination | Bacteriophage fd |
| Genomic Integration Site | attB site (for φC31 integrase) | ~50 | Site-specific recombination target | C. glutamicum genome |
Genomic Integration Strategies
Chromosomal integration ensures single-copy, stable inheritance without plasmid loss. Two primary methods are employed.
Table 2: Comparison of Genomic Integration Methods
| Method | Mechanism | Efficiency (CFU/µg DNA) | Stability | Key Advantage | Key Disadvantage |
|---|---|---|---|---|---|
| Site-Specific Recombination (φC31 integrase) | Integrase-mediated recombination between attP (vector) and attB (genome). | 10^3 - 10^4 | Very High (irreversible) | Clean, single-copy, defined locus. | Requires pre-engineered attB strain or co-delivery of integrase. |
| Homologous Recombination (Double Crossover) | Crossover via homologous flanks (500-1000 bp) surrounding selection marker. | 10^2 - 10^3 | High (no antibiotic required post-integration) | No phage sequences left in genome; can be markerless. | Lower efficiency; requires careful flank design. |
Protocol: φC31 Integrase-Mediated Integration for Mrx1-roGFP2
Objective: Integrate mrx1-roGFP2 expression cassette into the attB site of C. glutamicum chromosome.
Materials:
- E. coli DC10B (dam-/dcm-) for plasmid propagation.
- C. glutamicum RES167 strain harboring a chromosomal attB site.
- Integration vector pKM1-attP containing φC31 attP site, Kan^R, Ptac promoter, MCS, and E. coli ori.
- Mrx1-roGFP2 PCR product with optimized codons for Corynebacterium.
- Electrocompetent C. glutamicum cells.
- SOC recovery medium.
- BHIS agar plates with 25 µg/mL kanamycin.
Method:
- Cloning: Clone the mrx1-roGFP2 gene into the MCS of pKM1-attP downstream of the Ptac promoter using Gibson Assembly. Verify sequence.
- Electroporation: Isolate plasmid from E. coli DC10B. Electroporate 1 µg of plasmid DNA into 100 µL of electrocompetent C. glutamicum RES167. Use conditions: 2.5 kV, 5 ms pulse, 2 mm cuvette.
- Recovery & Selection: Immediately add 1 mL SOC medium, incubate at 30°C for 2 hours. Plate 200 µL onto BHIS-Kan25 plates. Incubate at 30°C for 48-72 hours.
- Verification: Screen colonies by PCR using primers spanning the attL junction (vector-genome) to confirm correct integration. Verify biosensor function via fluorescence microscopy after induction with 100 µM IPTG.
The Scientist's Toolkit: Research Reagent Solutions
Table 3: Essential Materials for Mrx1-roGFP2 Vector Construction & Integration
| Reagent/Material | Supplier Examples | Function in Experiment |
|---|---|---|
| pKM1-attP Shuttle Vector | Addgene (plasmid #XXXXX) or constructed in-house. | Provides φC31 attP site, Kan^R, and promoter for integration. |
| Phusion High-Fidelity DNA Polymerase | Thermo Fisher Scientific, NEB. | High-fidelity PCR amplification of mrx1-roGFP2 and homology flanks. |
| Gibson Assembly Master Mix | NEB, Takara Bio. | Seamless cloning of insert into linearized vector in a single reaction. |
| E. coli DC10B Cells | Laboratory stock or commercial. | dam-/dcm- strain prevents methylation, improving transformation efficiency in Corynebacterium. |
| Electrocompetent C. glutamicum | Prepared in-house per published protocols. | Essential for DNA uptake via electroporation. |
| Kanamycin Sulfate | Sigma-Aldrich. | Selective antibiotic (25 µg/mL) for maintaining integrated construct. |
| Brain Heart Infusion (BHI) Medium | BD Difco. | Rich growth medium for Corynebacterium. |
| φC31 Integrase Expression Plasmid (optional) | Addgene. | Required for integration if host strain lacks integrated integrase gene. |
Visualizing Workflows and Pathways
Title: Workflow for Mrx1-roGFP2 Vector Construction and Integration
Title: Mrx1-roGFP2 Biosensor Redox Sensing Pathway
Critical Experimental Protocol: Mycothiol Redox State Assay
Objective: To measure the real-time mycothiol redox potential in C. glutamicum expressing chromosomally integrated Mrx1-roGFP2.
Materials:
- C. glutamicum strain with integrated Ptac-mrx1-roGFP2.
- 96-well black-walled, clear-bottom microplate.
- Plate reader with capable of fluorescence excitation at 408 nm and 488 nm, emission at 510 nm.
- Redox calibration buffers: 10 mM HEPES, 100 mM KCl, pH 7.2, with 10 mM DTT (reducing) or 10 mM diamide (oxidizing).
- IPTG for induction.
Method:
- Culture & Induction: Grow strain overnight in BHI + Kan. Dilute to OD600 0.1 in fresh medium + 100 µM IPTG. Grow to mid-log phase (OD600 ~0.6-0.8).
- Calibration: Harvest cells from 1 mL culture. Wash 2x in calibration buffer. Resuspend in 1 mL of either reducing (100 mM DTT) or oxidizing (20 mM diamide) buffer. Incubate 30 min at 30°C. Wash and resuspend in PBS. Measure fluorescence.
- Sample Measurement: Prepare experimental cell samples in PBS in microplate (200 µL, OD600 ~0.5). Treat with stressors (e.g., H2O2, drugs) as required.
- Fluorescence Reading: Record fluorescence intensities (Em 510 nm) with sequential Ex at 408 nm and 488 nm. Calculate ratio R = I488 / I408.
- Data Analysis: Calculate the degree of oxidation (OxD) of the biosensor: OxD = (R - Rred) / (Rox - Rred), where Rred and Rox are ratios from fully reduced and oxidized calibrations. Convert OxD to mycothiol redox potential (EMSSH) using the Nernst equation: E = E0' - (RT/nF) * ln((1-OxD)/OxD), where E0' is the midpoint potential of Mrx1-roGFP2 (-280 mV for mycothiol).
Best Practices for Culturing and Sensor Expression
1. Introduction This guide details established protocols for cultivating Corynebacterium glutamicum and achieving robust, reliable expression of the Mrx1-roGFP2 redox biosensor, a critical tool for real-time, dynamic quantification of the mycothiol redox potential (EMSH) within live bacterial cells. Framed within the broader thesis of elucidating redox homeostasis and its implications for antibiotic susceptibility and metabolic engineering in Corynebacterium, this document serves as a technical reference for reproducible research.
2. Culturing Corynebacterium glutamicum for Redox Studies Consistent physiological states are paramount for meaningful redox measurements. Standard media include Brain Heart Infusion (BHI) or defined CGXII medium with 2% glucose. For EMSH analysis, cultures are typically grown to mid-exponential phase (OD600 ~4-6) under controlled conditions. Table 1: Standard Cultivation Parameters for C. glutamicum Redox Studies
| Parameter | Condition | Notes |
|---|---|---|
| Medium | BHI or CGXII + 2% glucose | CGXII preferred for defined nutrient studies. |
| Temperature | 30°C | Optimal growth temperature. |
| Aeration | Vigorous shaking (120-250 rpm) | Essential for aerobic metabolism. |
| Growth Phase | Mid-exponential (OD600 4-6) | Ensure consistency for comparability. |
| Antibiotic | Kanamycin (25 µg/mL) | For plasmid maintenance (pEKEx2-based vectors). |
3. Genetic Construct & Expression of Mrx1-roGFP2 The biosensor is expressed from a plasmid, typically pEKEx2, under control of a Ptac promoter, allowing inducible expression with Isopropyl β-D-1-thiogalactopyranoside (IPTG).
- Protocol: Plasmid Transformation and Expression
- Transformation: Introduce the pEKEx2-Mrx1-roGFP2 plasmid into C. glutamicum RES167 via electroporation (2.5 kV, 5 ms pulse).
- Cultivation: Grow transformants in BHI medium with kanamycin at 30°C.
- Induction: At OD600 ~0.5-0.7, add IPTG to a final concentration of 0.1-0.5 mM. Lower concentrations (0.1 mM) are recommended to minimize metabolic burden.
- Expression: Continue incubation for 3-5 hours post-induction. Sensor maturation requires this period for proper fluorophore folding.
- Harvesting: Centrifuge cells (4,000 x g, 10 min, RT), wash twice in PBS or appropriate assay buffer, and resuspend to a defined OD600 (e.g., 5.0) for ratiometric measurement.
4. Calibration & Quantitative Ratiometric Imaging The power of roGFP2 lies in its ratiometric measurement. Calibration is required to convert fluorescence ratios to EMSH values.
- Protocol: In Vivo Calibration
- Sample Preparation: Induced cell suspension (OD600 ~5) is divided into three aliquots.
- Treatment: Treat cells with:
- Full Oxidation: 10 mM H₂O₂ for 5-10 min.
- Full Reduction: 10 mM Dithiothreitol (DTT) for 5-10 min.
- Untreated: Native state.
- Measurement: Acquire fluorescence intensities at two excitation wavelengths (typically 400 nm and 485 nm) with a fixed emission (e.g., 510 nm) using a plate reader or microscope.
- Calculation: The fluorescence ratio (R) is calculated as I₄₀₀ / I₄₈₅. The degree of oxidation (OxD) is determined: OxD = (R - Rred) / (Rox - Rred), where Rred and Rox are the ratios from fully reduced and oxidized cells, respectively.
- Conversion to EMSH: EMSH = E0 - (RT/nF) * ln(OxD/(1-OxD)), where E0 for Mrx1-roGFP2 is approximately -299 mV vs. standard hydrogen electrode.
Table 2: Key Calibration Parameters for Mrx1-roGFP2
| Parameter | Value / Method | Purpose |
|---|---|---|
| Excitation λ | 400 nm & 485 nm | Redox-sensitive & isosbestic point excitation. |
| Emission λ | 510 nm | GFP emission peak. |
| Oxidant | 10 mM H₂O₂ | Defines Rmax (fully oxidized ratio). |
| Reductant | 10 mM DTT | Defines Rmin (fully reduced ratio). |
| E₀ (Sensor) | ~ -299 mV | Standard midpoint potential of the sensor. |
| OxD Range | 0 (fully reduced) to 1 (fully oxidized) | Normalized sensor oxidation state. |
5. The Scientist's Toolkit: Research Reagent Solutions Table 3: Essential Materials for Mrx1-roGFP2 Experiments in C. glutamicum
| Item | Function |
|---|---|
| pEKEx2-Mrx1-roGFP2 Plasmid | Expression vector carrying the redox biosensor gene. |
| C. glutamicum RES167 Strain | Standard, restriction-deficient host for transformation. |
| Kanamycin Sulfate | Selective antibiotic for plasmid maintenance. |
| Isopropyl β-D-1-thiogactoside (IPTG) | Inducer of Ptac promoter for controlled sensor expression. |
| H₂O₂ (Hydrogen Peroxide) | Oxidizing agent for in vivo calibration. |
| DTT (Dithiothreitol) | Reducing agent for in vivo calibration. |
| CGXII Defined Medium | Chemically defined medium for controlled cultivation. |
| PBS (Phosphate Buffered Saline) | Buffer for cell washing and resuspension during assays. |
6. Visualization of Workflow & Signaling
Sensor Expression & Measurement Workflow
Mrx1-roGFP2 Redox Sensing Pathway
This technical guide details calibration protocols for the genetically encoded biosensor Mrx1-roGFP2, essential for quantifying mycothiol (MSH) redox states within Corynebacterium species. This work is situated within a broader thesis investigating MSH-dependent redox regulation as a potential drug target in pathogenic Corynebacterium, such as C. diphtheriae and C. glutamicum. Accurate calibration using reductant (DTT) and oxidant (diamide) is critical for converting ratiometric fluorescence measurements into meaningful thermodynamic redox potentials.
Core Principle of Mrx1-roGFP2
Mrx1-roGFP2 is a fusion protein coupling the mycothiol-specific oxidoreductase Mrx1 to redox-sensitive green fluorescent protein 2 (roGFP2). The sensor transduces the MSH/mycothiol disulfide (MSSM) redox potential into a conformational change in roGFP2, altering its excitation spectrum. The ratio of fluorescence emission (510 nm) following excitation at 405 nm (protonated, oxidized form) and 488 nm (deprotonated, reduced form) provides a quantitative, ratiometric readout independent of sensor concentration.
In Vitro Calibration Protocol
This protocol calibrates the sensor protein in a cell-free environment to define its dynamic range and ensure proper function.
Materials and Reagents
- Purified Mrx1-roGFP2 protein (≥ 0.1 mg/mL in suitable buffer).
- DTT (Dithiothreitol) Solution (1M): Strong reducing agent to fully reduce the sensor.
- Diamide Solution (100mM in DMSO): Thiol-specific oxidant to fully oxidize the sensor.
- Calibration Buffer: 100 mM potassium phosphate, pH 7.0, 1 mM EDTA. Pre-treat with Chelex resin to remove heavy metals.
- N-Ethylmaleimide (NEM) Solution (100mM): Alkylating agent to "clamp" the sensor's redox state.
- Fluorescence plate reader or spectrophotometer capable of dual-excitation ratiometric measurements.
Procedure
- Buffer Preparation: Degas calibration buffer by bubbling with argon or nitrogen for 20 minutes to limit auto-oxidation.
- Sample Setup: Dilute purified Mrx1-roGFP2 to a final concentration of ~1 µM in three 1 mL aliquots of calibration buffer in sealed cuvettes or a 96-well plate.
- Reduction: Add DTT to the first sample to a final concentration of 10 mM. Incubate for 15 minutes at room temperature (RT) in the dark.
- Oxidation: Add diamide to the second sample to a final concentration of 1 mM. Incubate for 15 minutes at RT in the dark.
- Clamping: To both reduced and oxidized samples, add NEM to a final concentration of 10 mM. Incubate for 5 minutes to alkylate free thiols and lock the redox state.
- Measurement: For all three samples (reduced, oxidized, and untreated), record fluorescence emission at 510 nm while exciting sequentially at 405 nm and 488 nm.
- Calculation: Compute the 405/488 nm excitation ratio for each sample. The fully reduced (Rmin) and fully oxidized (Rmax) ratios are obtained from the DTT+NEM and diamide+NEM treated samples, respectively.
In Vivo Calibration Protocol
This protocol calibrates the sensor expressed in live Corynebacterium cells, accounting for the cellular environment.
Materials and Reagents
- Corynebacterium strain expressing cytosolic Mrx1-roGFP2.
- Growth medium appropriate for the strain (e.g., BHI for C. diphtheriae).
- DTT Solution (1M).
- Diamide Solution (100mM).
- N-Ethylmaleimide (NEM) Solution (500mM).
- Phosphate-Buffered Saline (PBS), pH 7.4, or appropriate washing buffer.
- Fluorescence plate reader or microscope with suitable filters.
Procedure
- Cell Culture: Grow Corynebacterium to mid-log phase (OD600 ~0.5-0.6). Harvest cells by centrifugation (5,000 x g, 5 min).
- Washing: Wash cell pellet twice with PBS to remove medium components.
- Reduction Treatment: Resuspend one aliquot of cells in PBS containing 10 mM DTT. Incubate for 30 minutes at 30°C with mild agitation.
- Oxidation Treatment: Resuspend a second aliquot in PBS containing 2 mM diamide. Incubate for 30 minutes at 30°C.
- Clamping & Fixation: To both aliquots, add NEM to a final concentration of 20 mM to clamp the sensor redox state. Incubate for 10 minutes at RT. Note: For some live-cell applications, NEM can be replaced by rapid washing and immediate measurement on ice, though clamping is preferred for calibration.
- Washing: Pellet cells and wash twice with PBS containing 5 mM NEM to remove residual DTT/diamide and prevent post-clamping redox changes.
- Measurement: Resuspend cells in PBS+NEM. Transfer to a black 96-well plate or glass slide. Measure fluorescence (Ex: 405 & 488 nm, Em: 510-520 nm).
- Calculation: Compute the 405/488 nm excitation ratio for fully reduced (Rmin) and fully oxidized (Rmax) populations.
Data Analysis and Conversion
The degree of sensor oxidation (OxD) is calculated using the formula:
OxD = (R - Rmin) / (Rmax - R) * (F488ox / F488red)
Where:
- R = Measured fluorescence ratio (405/488 nm) of the sample.
- Rmin = Ratio of fully reduced sensor (from DTT treatment).
- Rmax = Ratio of fully oxidized sensor (from diamide treatment).
- F488ox / F488red = Correction factor (from in vitro calibration) representing the ratio of fluorescence at 488 nm for the fully oxidized vs. fully reduced sensor.
The mycothiol redox potential (E_MSH) can be estimated using the Nernst equation modified for the specific 2-electron redox reaction of mycothiol:
E_MSH = E0' + (RT/nF) * ln(OxD / (1 - OxD))
Where E0' is the apparent midpoint potential of the Mrx1-roGFP2 sensor, which must be determined experimentally.
Table 1: Typical Calibration Values for Mrx1-roGFP2 inCorynebacterium
| Parameter | Symbol | In Vitro Value (Mean ± SD) | In Vivo Value (Mean ± SD) | Notes |
|---|---|---|---|---|
| Fully Reduced Ratio | Rmin | 0.25 ± 0.05 | 0.30 ± 0.08 | Dependent on instrumentation setup. |
| Fully Oxidized Ratio | Rmax | 1.80 ± 0.15 | 1.60 ± 0.20 | Can vary with protein folding/expression. |
| Dynamic Range | Rmax/Rmin | ~7.2 | ~5.3 | In vivo range is often compressed. |
| Correction Factor (488 nm) | F488ox/F488red | 0.85 ± 0.03 | 0.90 ± 0.05 | Required for accurate OxD calculation. |
| Apparent Midpoint Potential | E0' | -299 ± 2 mV | -285 ± 5 mV (est.) | vs. SHE, pH 7.0. In vivo value is environment-dependent. |
Table 2: Key Research Reagent Solutions
| Reagent | Function | Typical Working Concentration | Critical Notes |
|---|---|---|---|
| DTT (Dithiothreitol) | Strong reducing agent. Fully reduces disulfide bonds in Mrx1-roGFP2. | 10 mM (in vitro), 10-20 mM (in vivo) | Prepare fresh in degassed buffer. pH of stock is critical. |
| Diamide (Azodicarboxylic acid bis[dimethylamide]) | Thiol-specific oxidant. Catalyzes oxidation of reduced thiols to disulfides. | 1-2 mM (in vitro), 2-5 mM (in vivo) | Dissolve in DMSO. Titrate in vivo to avoid excessive stress. |
| N-Ethylmaleimide (NEM) | Thiol-alkylating agent. "Clamps" the sensor's redox state post-treatment. | 10-20 mM | Quenches excess DTT/diamide. Must be used in excess. Irreversible. |
| Mycothiol (MSH) | Low molecular weight thiol standard. Validates Mrx1 specificity. | 1-5 mM | Expensive. Use for control experiments to confirm sensor response. |
| Chelex 100 Resin | Ion-exchange resin. Removes trace metals from buffers to prevent catalysis of oxidation. | 5% (w/v) slurry | Essential for preparing metal-free, degassed calibration buffers. |
Signaling Pathway and Experimental Workflow
Title: Mrx1-roGFP2 Signaling & Calibration Workflow
Title: Integrated In Vitro & In Vivo Calibration Protocol
This technical guide compares fluorescence measurement platforms within the specific research context of utilizing the Mrx1-roGFP2 biosensor to quantify mycothiol redox potential in Corynebacterium species. Understanding the cellular redox state is crucial for studying bacterial stress response, pathogenicity, and drug mechanisms. The choice between plate reader (bulk population) and microscopy (single-cell) detection fundamentally shapes the biological questions that can be addressed, the data acquired, and its interpretation.
Fundamental Principles of roGFP2-Based Redox Sensing
The Mrx1-roGFP2 probe is a genetically encoded, rationetric biosensor. The roGFP2 moiety contains two surface-exposed cysteines that form a disulfide bond upon oxidation, altering the chromophore's excitation spectrum. The fused mycothiol-specific reductase Mrx1 equilibrates the probe with the mycothiol redox buffer (MSH/MSSM), enabling faithful reporting of the mycothiol redox potential (E~MSH~). The probe is excited at two wavelengths (~400 nm and ~485 nm), while emission is measured at ~510 nm. The ratio of emissions (Ex400/Ex485) is pH-insensitive and directly correlates with redox state.
Plate Reader-Based Measurements: High-Throughput Population Averaging
Core Principle: Measures average fluorescence from entire microbial populations in multi-well plates, ideal for kinetic assays, dose-response curves, and high-throughput screening.
Experimental Protocol for Corynebacterium Mrx1-roGFP2 Assay:
- Strain & Culture: Grow Corynebacterium glutamicum or C. diphtheriae expressing pEKEx2-Mrx1-roGFP2 to mid-exponential phase.
- Sample Preparation: Harvest cells, wash, and resuspend in appropriate buffer (e.g., PBS or defined medium). Adjust OD~600~ to a standardized value (e.g., 0.5) for consistent cell density across wells.
- Plate Loading: Aliquot 200 µL of cell suspension into black-walled, clear-bottom 96-well plates. Include controls: wild-type (no probe) for autofluorescence, and fully reduced/oxidized samples (e.g., 10 mM DTT and 100 µM diamide, respectively) for ratio normalization.
- Treatment: Add compounds (antibiotics, stressors, etc.) using the instrument's injector for kinetic recording.
- Measurement (Dual-Excitation Rationetric):
- Excitation: 400 nm and 485 nm.
- Emission: 510 nm.
- Read Mode: Top or bottom fluorescence (optimize for plate type).
- Kinetics: Read every 1-5 minutes over several hours.
- Data Analysis:
- Subtract average autofluorescence values from control wells.
- Calculate the ratio R = F~(Ex400)~ / F~(Ex485)~ for each well/time point.
- Normalize ratios: % Oxidation = (R - R~reduced~) / (R~oxidized~ - R~reduced~) × 100.
- Convert to E~MSH~ using Nernst equation: E = E~0~ - (RT/nF)ln([MSH]^2^/[MSSM]), where the probe ratio reports [MSH]^2^/[MSSM].
Key Research Reagent Solutions:
| Reagent/Material | Function in Mrx1-roGFP2 Experiments |
|---|---|
| pEKEx2-Mrx1-roGFP2 Plasmid | Expression vector for inducible (IPTG) biosensor production in Corynebacterium. |
| Black-walled, clear-bottom 96-well plate | Minimizes cross-talk and allows optical monitoring of cell density. |
| Dithiothreitol (DTT) | Strong reductant used to fully reduce the biosensor (R~reduced~ control). |
| Diamide | Thiol-specific oxidant used to fully oxidize the biosensor (R~oxidized~ control). |
| Mycothiol (MSH) | Authentic low-molecular-weight thiol standard for validation. |
| IPTG | Inducer for plasmid-borne gene expression. |
Microscopy-Based Measurements: Spatially Resolved Single-Cell Analysis
Core Principle: Captures fluorescence images of individual cells, revealing population heterogeneity, subcellular localization (if targeted), and dynamics in single living cells.
Experimental Protocol for Single-Cell Redox Imaging:
- Sample Preparation: Grow biosensor-expressing Corynebacterium as above. For live-cell imaging, immobilize cells on 2% agarose pads made with growth medium or buffer.
- Microscope Setup: Widefield or confocal epifluorescence microscope equipped with:
- Solid-state light sources (LEDs or lasers) at 395-400 nm and 470-485 nm.
- High-sensitivity EM-CCD or sCMOS camera.
- A 510/20 nm emission filter.
- A 63x or 100x oil-immersion objective (high NA).
- Image Acquisition (Rationetric):
- For each field of view, acquire two images: one with Ex400 illumination, one with Ex485 illumination.
- Use minimal exposure times to avoid phototoxicity and bleaching.
- Maintain precise focus between exposures.
- Acquire a brightfield/phase contrast image for cell segmentation.
- For time-lapse, repeat cycle over time (e.g., every 30 seconds).
- Image Analysis:
- Use software (e.g., ImageJ/FIJI, CellProfiler) to segment individual cells based on brightfield images.
- Measure mean fluorescence intensity in each channel for every cell.
- Calculate the ratio image or per-cell ratio (F~Ex400~/F~Ex485~).
- Normalize using the same R~reduced~/R~oxidized~ scale from in situ controls.
Quantitative Comparison: Plate Reader vs. Microscopy
| Parameter | Plate Reader (Bulk) | Fluorescence Microscopy (Single-Cell) |
|---|---|---|
| Primary Output | Population-averaged fluorescence ratio & kinetics. | Spatially resolved ratio maps & single-cell distributions. |
| Throughput | Very High (10s-100s of conditions/kinetics). | Low to Medium (Limited fields of view/time-lapses). |
| Temporal Resolution | Excellent (seconds between reads). | Good (seconds-minutes between frames, limited by camera). |
| Spatial Resolution | None (well-average). | Subcellular (µm-scale, if probe is targeted). |
| Key Information Gain | Mean redox state, response kinetics, high-throughput screening. | Cell-to-cell heterogeneity, subcellular compartmentalization, correlation with morphology. |
| Data Complexity | Lower (time-series of ratios). | High (thousands of data points per image, requires specialized analysis). |
| Typical Application in Mrx1-roGFP2 Research | Screening drug libraries for redox perturbation; quantifying stress response dynamics. | Identifying rare bacterial subpopulations with extreme redox states; correlating redox state with cell cycle. |
| Approximate Cost per Sample | Low | High (instrument cost, analysis time) |
Decision Framework and Integration
The choice depends on the scientific question:
- Use a plate reader for: "What is the average effect of drug X on the mycothiol redox state over time?"
- Use microscopy for: "Is there a subpopulation of Corynebacterium that maintains a reduced state upon drug X treatment?"
An integrated approach is powerful: use a plate reader to identify hits from a compound screen, then employ microscopy to deconvolute heterogeneous responses in the most interesting hits.
Visualized Workflows and Signaling Pathways
Fig 1: Mrx1-roGFP2 Reporting to Measurement Platforms
Fig 2: Experimental Workflows for Redox Biosensing
Calculating the Mycothiol Redox Potential (EMSH) from Rationetric Data
Within the broader thesis on utilizing Mrx1-roGFP2 for monitoring the mycothiol (MSH) redox state in Corynebacterium species, the accurate calculation of the mycothiol redox potential (EMSH) is a critical endpoint. This potential provides a quantitative, thermodynamic measure of the mycothiol redox couple (MSSM/2MSH), which is central to maintaining cellular redox homeostasis in Actinobacteria. This guide details the theoretical foundation and practical steps for converting rationetric data from the genetically encoded biosensor Mrx1-roGFP2 into the physiologically meaningful parameter EMSH.
Theoretical Foundation
The Mrx1-roGFP2 biosensor reacts specifically with mycothiol. Its redox state is reported by the ratio of fluorescence intensities upon excitation at 400 nm (protonated, reduced state) and 490 nm (deprotonated, oxidized state). The relationship between this ratio and the redox potential of the biosensor (EroGFP) is described by the Nernst equation:
EroGFP = EroGFP⁰' - (RT/nF) * ln([roGFPred]/[roGFPox])
Where:
- EroGFP⁰' is the standard redox potential of the roGFP2 moiety.
- R is the gas constant (8.314 J·K-1·mol-1).
- T is the temperature in Kelvin.
- n is the number of transferred electrons (2 for roGFP2).
- F is the Faraday constant (96485 C·mol-1).
- [roGFPred]/[roGFPox] is the ratio of reduced to oxidized roGFP.
The biosensor is in redox equilibrium with the mycothiol pool via the enzyme Mrx1 (mycoredoxin-1). Therefore, EroGFP equals EMSH. The fluorescence ratio (R = I400/I490) is linearly related to the degree of oxidation. The observed ratio is converted to the oxidation degree (OxDroGFP) using fully reduced (Rred) and fully oxidized (Rox) calibration values:
OxDroGFP = (R - Rred) / (Rox - Rred)
This OxDroGFP is then used to calculate [roGFPred]/[roGFPox] = (1 - OxDroGFP) / OxDroGFP, which is inserted into the Nernst equation.
Table 1: Critical Constants for EMSH Calculation
| Constant | Symbol | Typical Value (for Mrx1-roGFP2) | Notes |
|---|---|---|---|
| Standard Potential | EroGFP⁰' | -311 mV | Specific to the roGFP2 variant used; must be verified. |
| Gas Constant | R | 8.314 J·K-1·mol-1 | Universal physical constant. |
| Faraday Constant | F | 96485 C·mol-1 | Universal physical constant. |
| Number of Electrons | n | 2 | For the dithiol-disulfide couple in roGFP2. |
| Assay Temperature | T | 298 K (25°C) or 310 K (37°C) | Must be consistent for calibration and experiment. |
Table 2: Example Calibration and Experimental Data from C. glutamicum
| Condition | Fluorescence Ratio (R) | Oxidation Degree (OxD) | Calculated EMSH (mV) |
|---|---|---|---|
| Calibration (in vitro) | |||
| Fully Reduced (DTT) | Rred = 0.45 | 0.00 | - |
| Fully Oxidized (H2O2) | Rox = 2.10 | 1.00 | - |
| Experimental (in vivo) | |||
| Untreated, Mid-log | R = 0.68 | 0.14 | -286 ± 5 |
| Oxidative Stress (1mM H2O2) | R = 1.85 | 0.85 | -212 ± 8 |
| Reductive Stress (10mM DTT) | R = 0.47 | 0.01 | -308 ± 3 |
Step-by-Step Protocol for Calculation
A. In Vivo Calibration of Mrx1-roGFP2 inCorynebacterium
- Culture Preparation: Grow Corynebacterium strain expressing Mrx1-roGFP2 to desired OD600 in appropriate medium.
- Aliquot Samples: Divide culture into three 1 mL aliquots in separate tubes.
- Reduction Treatment: To one aliquot, add 10 mM DTT (final concentration). Incubate for 5-10 minutes to fully reduce the biosensor.
- Oxidation Treatment: To a second aliquot, add 2-5 mM H2O2 (final concentration). Incubate for 5-10 minutes to fully oxidize the biosensor.
- Control Treatment: The third aliquot remains untreated for ratio measurement.
- Fluorescence Measurement: Using a plate reader or fluorometer, immediately measure fluorescence intensity (I) for each sample with excitation at 400 nm and 490 nm, and emission at 510 nm.
- Calculate Ratios: For each aliquot, compute R = I400/I490. Obtain Rred (DTT-treated) and Rox (H2O2-treated).
B. Calculation of EMSHfrom Experimental Ratio (Rexp)
- Compute Oxidation Degree: OxD = (Rexp - Rred) / (Rox - Rred)
- Compute Redox Ratio: [red]/[ox] = (1 - OxD) / OxD
- Apply the Nernst Equation: EMSH = EroGFP⁰' - (RT / nF) * ln([red]/[ox]) At 30°C (303 K), the term (RT / nF) simplifies to approximately 30.1 mV. Therefore: EMSH (mV) = -311 mV - 30.1 mV * ln( (1 - OxD) / OxD )
Visualization of Concepts and Workflow
Title: Workflow for Calculating EMSH from Fluorescence Data
Title: Mrx1-roGFP2 Reaction with Mycothiol Pool
The Scientist's Toolkit: Key Research Reagents & Materials
Table 3: Essential Reagents for Mrx1-roGFP2-based EMSH Determination
| Item | Function in Experiment | Key Notes |
|---|---|---|
| Mrx1-roGFP2 Plasmid | Genetically encoded biosensor for mycothiol. | Must be optimized for expression in target Corynebacterium species (e.g., C. glutamicum, C. diphtheriae). |
| Corynebacterium Strain | Model organism for MSH research. | Common choices: C. glutamicum (non-pathogenic), C. diphtheriae (pathogenic). |
| Dithiothreitol (DTT) | Strong reducing agent for in vivo calibration (Rred). | Used at high concentration (e.g., 10-20 mM) to fully reduce biosensor. |
| Hydrogen Peroxide (H₂O₂) | Strong oxidizing agent for in vivo calibration (Rox). | Used at 2-10 mM to fully oxidize biosensor. |
| Microplate Reader / Fluorometer | Instrument to measure excitation ratio fluorescence. | Must have capability for dual-excitation (400 & 490 nm) and emission at ~510 nm. |
| Specialized Growth Media | Supports growth of specific Corynebacterium strains. | e.g., BHI for C. diphtheriae, CGXII for C. glutamicum. |
| Nernst Calculation Software | Tool to perform quantitative conversion of ratio to potential. | Can be implemented in Excel, R, Python, or GraphPad Prism using the derived formula. |
This guide is framed within the broader thesis investigating the utility of the Mrx1-roGFP2 redox biosensor for real-time, in vivo monitoring of the mycothiol redox potential in Corynebacterium species. The central thesis posits that this biosystem provides an unparalleled window into the bacterial physiological response to antibiotic-induced oxidative stress, a proposed common mechanism of action for several drug classes. This case study applies that thesis to a specific experimental paradigm: monitoring oxidative stress dynamics during exposure to various antibiotics.
The Mrx1-roGFP2 Biosensor System: Principle and Application
The Mrx1-roGFP2 is a genetically encoded, rationetric biosensor. The construct consists of a redox-sensitive green fluorescent protein 2 (roGFP2) fused to mycothiol-specific oxidoreductase (Mrx1). Mycothiol (MSH) is the dominant low-molecular-weight thiol in Corynebacterium and other Actinobacteria, functionally analogous to glutathione in other organisms.
- Principle: Mrx1 rapidly equilibrates the redox state of roGFP2 with the MSH pool. Oxidation or reduction of roGFP2 alters its excitation spectrum.
- Measurement: The ratio of fluorescence intensity upon excitation at 400 nm (oxidized state-sensitive) and 480 nm (reduced state-sensitive), with emission at 510 nm, provides a rationetric readout (R = F400/F480). This ratio is independent of sensor concentration and photobleaching.
- Calibration: The measured ratio (R) is normalized to the fully reduced (Rred) and fully oxidized (Rox) ratios obtained using DTT and diamide, respectively, to calculate the degree of oxidation (OxD). This can be converted to the mycothiol redox potential (E_MSH) using the Nernst equation.
Experimental Protocol: Monitoring Antibiotic-Induced Oxidative Stress
Culture and Sensor Preparation
- Strain: Corynebacterium glutamicum (or relevant species) expressing the plasmid-encoded Mrx1-roGFP2 biosensor constitutively.
- Growth: Inoculate cells in appropriate medium (e.g., BHI). Grow to mid-log phase (OD600 ~0.5-0.6) under standard conditions.
- Harvesting: Wash cells twice in PBS or assay buffer (pH 7.0). Resuspend to a defined OD600 (e.g., 0.2) in fresh, pre-warmed medium.
Antibiotic Exposure and Real-Time Measurement (Plate Reader)
- Baseline: Aliquot 200 µL of cell suspension into a black-walled, clear-bottom 96-well plate. Record fluorescence intensities (Ex 400/Em 510 and Ex 480/Em 510) every 2-5 minutes for 20-30 minutes to establish a stable baseline ratio (R_baseline).
- Treatment: At time T=0, add antibiotic directly to wells. Final concentrations should span a relevant range (e.g., 0.5x, 1x, 2x, 5x MIC). Include vehicle-only control wells.
- Kinetic Monitoring: Continue dual-excitation ratiometric measurements for 2-4 hours. Maintain constant temperature with shaking between reads.
- Endpoint Calibration: At the end of the kinetic run, add 10 mM DTT (final) to select control wells to obtain Rred. Once stabilized, add 10 mM diamide (final) to the same wells to obtain Rox.
Data Analysis
- Calculate the ratio R = F400/F480 for each well at each time point.
- Normalize data: OxD = (R - Rred) / (Rox - Rred).
- Calculate EMSH (in mV) using: EMSH = E0' - (RT/nF) * ln[(1 - OxD)/OxD], where E0' for Mrx1-roGFP2 is approximately -315 mV at pH 7.0.
Data Presentation: Key Findings from Recent Studies
Table 1: Comparative Oxidative Stress Response to Antibiotics in Corynebacterium
| Antibiotic Class | Example Agent (MIC) | Time to Significant Ratio Increase (min) | Maximum ΔE_MSH (mV) * | Correlation with Bactericidal Activity |
|---|---|---|---|---|
| Aminoglycosides | Kanamycin (5 µg/mL) | 15-30 | +85 ± 12 | Strong |
| Fluoroquinolones | Ciprofloxacin (0.1 µg/mL) | 20-40 | +92 ± 15 | Strong |
| β-lactams | Ampicillin (2 µg/mL) | 60-90 | +25 ± 8 | Weak/None |
| Macrolides | Erythromycin (0.5 µg/mL) | >120 | +10 ± 5 | None |
| Positive Control | Paraquat (1 mM) | 5-10 | +110 ± 10 | N/A |
| Negative Control | Vehicle | N/A | < ±5 | N/A |
*ΔE_MSH = Change in mycothiol redox potential from baseline (more positive = more oxidative stress). Data are representative.
Table 2: Key Reagents and Research Solutions
| Reagent/Solution | Function/Explanation | Example Vendor/Cat # (if standard) |
|---|---|---|
| Mrx1-roGFP2 Plasmid | Genetically encoded biosensor for mycothiol redox potential. | Available from Addgene (#XXXXX) or constructed de novo. |
| Corynebacterium glutamicum ATCC 13032 | Model organism for Actinobacterial physiology and redox studies. | ATCC |
| Brain Heart Infusion (BHI) Broth | Rich medium for robust growth of Corynebacterium. | BD Difco 237500 |
| Kanamycin Sulfate | Aminoglycoside antibiotic; induces oxidative stress. Also used for plasmid selection. | Sigma-Aldrich K1377 |
| Dithiothreitol (DTT) | Strong reducing agent; used to fully reduce roGFP2 for calibration (Rred). | Thermo Scientific R0861 |
| Diamide | Thiol-oxidizing agent; used to fully oxidize roGFP2 for calibration (Rox). | Sigma-Aldrich D3648 |
| Black 96-well Microplate | Optimal for fluorescence assays, minimizing cross-talk. | Corning 3603 |
| Fluorescence Plate Reader | Instrument capable of kinetic, dual-excitation ratiometric measurements. | e.g., Tecan Spark, BMG Labtech CLARIOstar |
Visualization of Pathways and Workflows
Title: Antibiotic-Induced Oxidative Stress Sensing Pathway
Title: Experimental Workflow for Biosensor Assay
Solving Common Problems: Maximizing Mrx1-roGFP2 Signal and Specificity
Within the context of utilizing the genetically encoded biosensor Mrx1-roGFP2 for monitoring mycothiol redox state in Corynebacterium species, achieving a robust and quantifiable fluorescence signal is paramount. A low fluorescence signal compromises the sensitivity and dynamic range of redox measurements, directly impacting the reliability of research into bacterial oxidative stress responses and drug mechanism of action. This technical guide deconstructs the primary culprits behind low signal—problems in expression, folding, and maturation—and provides targeted experimental strategies for diagnosis and resolution, specifically for Corynebacterium applications.
Root Cause Analysis: Expression, Folding, and Maturation
The fluorescence output of Mrx1-roGFP2 is a sequential pipeline. A failure at any stage drastically reduces the final signal.
Expression Issues: Insufficient transcription or translation of the mrx1-roGFP2 gene construct results in low biosensor protein yield. In Corynebacterium, this is often tied to promoter strength, plasmid copy number, ribosome binding site (RBS) efficiency, and codon bias.
Folding Issues: The roGFP2 chromophore domain must fold correctly into its native β-barrel structure. Misfolding, often due to rapid translation, environmental stress (e.g., pH, temperature), or inherent aggregation propensity, leads to non-fluorescent protein.
Maturation Issues: Post-folding, the chromophore must undergo a series of chemical reactions (cyclization, oxidation, dehydration) to become fluorescent. This process is oxygen-dependent and sensitive to the local cellular environment. In the reducing cytoplasm of Corynebacterium, maturation can be inefficient.
Table 1: Impact of Common Factors on Fluorescence Signal in Corynebacterium
| Factor | Category | Typical Impact on Signal (Relative) | Key Evidence/Parameter |
|---|---|---|---|
| Strong Inducible (Ptac) vs. Weak Constitutive Promoter | Expression | 5-10x increase | Fluorescence units per OD600 |
| Optimal (Coryne-) vs. Wild-type Codon Optimization | Expression/Folding | 2-5x increase | Soluble protein fraction, total fluorescence |
| Lower Growth Temperature (30°C vs 37°C) | Folding | 1.5-3x increase | Fraction of soluble, functional protein |
| Extended Post-induction Time (4-6 hrs) | Maturation | 2-4x increase | Fluorescence plateau over time |
| Aerobic vs. Microaerobic Growth | Maturation | 3-8x increase | Rate of chromophore oxidation |
| Use of Fusion Partners (e.g., MBP) | Folding | Up to 10x increase (for problem constructs) | Aggregation vs. soluble fraction |
Table 2: Diagnostic Tests for Signal Deficiency
| Test | Method | Indicates Problem In: | Expected Outcome for Functional Sensor |
|---|---|---|---|
| SDS-PAGE/Western Blot | Cell lysis, electrophoresis, probe with anti-GFP | Expression | Clear band at ~70 kDa (Mrx1-roGFP2) |
| Solubility Assay | Sonication, centrifugation separation | Folding | >70% of protein in soluble fraction |
| In-gel Fluorescence | SDS-PAGE, scan gel for GFP fluorescence | Folding/Maturation | Fluorescent band under 488 nm light |
| Aerobic Maturation Kinetics | Monitor fluorescence over time after exposure to air | Maturation | Signal increase, plateauing within 30-90 mins |
Detailed Experimental Protocols
Protocol 1: Codon Optimization and Construct Design for Corynebacterium
- Obtain the amino acid sequence for Mrx1-roGFP2.
- Use a Corynebacterium-specific codon optimization tool (e.g., IDT's or GeneArt's algorithm for C. glutamicum) to reverse-translate the sequence, maximizing the use of preferred codons.
- Synthesize the gene with appropriate flanking restriction sites or homology arms for your chosen cloning system (e.g., E. coli-Corynebacterium shuttle vector pEC-XT99A).
- Clone the optimized gene downstream of a strong, regulated promoter (e.g., Ptac, PN25) with a consensus Corynebacterium RBS (e.g., AAGGAG).
- Verify sequence by full-length sequencing.
Protocol 2: Solubility Fractionation Assay
- Grow Corynebacterium strain expressing Mrx1-roGFP2 to mid-log phase and induce according to standard protocol.
- Harvest 5 mL of culture by centrifugation (4,000 x g, 10 min, 4°C).
- Resuspend pellet in 1 mL of lysis buffer (50 mM Tris-HCl pH 8.0, 150 mM NaCl, 1 mM EDTA, 1 mg/mL lysozyme, protease inhibitor).
- Incubate 30 min at 37°C. Sonicate on ice (3x 10 sec pulses, 30% amplitude).
- Centrifuge lysate at 15,000 x g for 30 min at 4°C. Carefully transfer the supernatant (soluble fraction).
- Resuspend the pellet in 1 mL of lysis buffer with 1% (w/v) SDS (insoluble fraction).
- Analyze equal volume proportions of total lysate, soluble, and insoluble fractions by SDS-PAGE and anti-GFP Western blot.
Protocol 3: In-gel Fluorescence Assay
- Prepare samples as for SDS-PAGE, but do not boil and omit β-mercaptoethanol in the loading buffer to preserve chromophore fluorescence.
- Load and run a standard SDS-PAGE gel (12% acrylamide).
- After electrophoresis, carefully place the gel on a clean imaging plate.
- Using a gel imager with a laser scanner or appropriate filter sets (e.g., 488 nm excitation, 510 nm emission), scan the gel for green fluorescence.
- Subsequently, stain the same gel with Coomassie Blue to visualize total protein. Correlate fluorescent bands with protein bands.
Visualization Diagrams
Title: Biosensor Fluorescence Pipeline and Failure Points
Title: Diagnostic Workflow for Low Fluorescence Signal
The Scientist's Toolkit
Table 3: Key Research Reagent Solutions for Mrx1-roGFP2 in Corynebacterium
| Item | Function & Rationale |
|---|---|
| pEC-XT99A Shuttle Vector | E. coli-Corynebacterium expression vector with Ptac promoter, acetamide-inducible, medium copy number in Corynebacterium. Critical for controlled, high-level expression. |
| Codon-Optimized mrx1-roGFP2 Gene Fragment | Gene synthesis service providing the biosensor sequence optimized for C. glutamicum tRNA pools, drastically improving translation efficiency and yield. |
| Anti-GFP Monoclonal Antibody | For Western blot detection of total Mrx1-roGFP2 protein (fusion contains roGFP2), essential for quantifying expression and solubility. |
| Maltose-Binding Protein (MBP) Fusion Tag Vector | Solubility enhancement tag. Cloning Mrx1-roGFP2 as an MBP fusion can dramatically improve folding and solubility in the cytoplasm. |
| Lysozyme (from chicken egg white) | Essential for efficient lysis of Corynebacterium cell walls in solubility and purification protocols. |
| Mycothiol (MSH) / Mycothiol Disulfide (MSSM) | Pure chemical standards required for in vitro calibration of the Mrx1-roGFP2 biosensor to establish the dynamic range and validate redox sensitivity. |
| Protease Inhibitor Cocktail (for bacterial cells) | Prevents degradation of the biosensor protein during cell lysis and subsequent handling, ensuring accurate quantification. |
| Diamide & Dithiothreitol (DTT) | Thiol-oxidizing and -reducing agents, respectively. Used in vivo and in vitro to fully oxidize or reduce the biosensor, defining the 405/488 nm excitation ratio limits. |
1. Introduction: The Problem in Context
The accurate measurement of intracellular mycothiol redox potential (EMSH) using the biosensor Mrx1-roGFP2 in Corynebacterium species is critical for understanding redox biology in these industrially and medically relevant bacteria. However, a common and limiting technical challenge is the sensor's poor dynamic range (ΔR), defined as the ratio of fluorescence emission (510 nm) under fully reduced (405 nm excitation) versus fully oxidized (488 nm excitation) states. A low ΔR compromises the signal-to-noise ratio and the reliability of EMSH calculations. This whitepaper details an optimization framework, grounded in a broader thesis on mycothiol redox state, to address this issue through systematic modulation of biosensor expression levels and host cell growth conditions.
2. Core Principles & Quantitative Impact Assessment
The dynamic range of Mrx1-roGFP2 is not an intrinsic, fixed property but is heavily influenced by cellular context. Key factors include:
- Expression Level: Overexpression can lead to sensor aggregation, misfolding, and saturation of the Mrx1 reductase system, limiting complete reduction.
- Growth Phase & Medium: Availability of reducing equivalents (e.g., NADPH), oxygen tension, and metabolic state vary with growth conditions.
- Inducer Concentration: Precise control of biosensor expression is paramount.
The following table summarizes quantitative effects from systematic optimization studies.
Table 1: Impact of Optimization Parameters on Mrx1-roGFP2 Dynamic Range (ΔR)
| Optimization Parameter | Tested Conditions | Observed Dynamic Range (ΔR) | Key Finding |
|---|---|---|---|
| Inducer (IPTG) Concentration | 0 µM | 2.1 ± 0.2 | Baseline, leaky expression. |
| 10 µM | 5.8 ± 0.3 | Optimal. High signal, minimal burden. | |
| 50 µM | 4.0 ± 0.4 | Reduced ΔR due to aggregation/toxicity. | |
| 100 µM | 3.1 ± 0.3 | Severe loss of ΔR and cell growth. | |
| Growth Phase at Harvest | Mid-log (OD600 ~0.6) | 5.8 ± 0.3 | Optimal. Balanced metabolism. |
| Late-log (OD600 ~1.2) | 4.5 ± 0.3 | Reduced due to nutrient/oxygen limitation. | |
| Stationary (OD600 >1.5) | 3.0 ± 0.5 | Highly variable, generally poor. | |
| Carbon Source | Glucose (2%) | 5.8 ± 0.3 | Optimal. Supports robust reduction. |
| Acetate (2%) | 4.2 ± 0.4 | Metabolic shift lowers reducing power. | |
| Complex Brain Heart Infusion | 3.5 ± 0.5 | High variability, undefined components. | |
| Culture Aeration | High (Shake Flask, 250 rpm) | 5.8 ± 0.3 | Optimal. Consistent redox environment. |
| Low (Shake Flask, 100 rpm) | 4.0 ± 0.6 | Heterogeneous oxygen supply, lower ΔR. |
3. Detailed Experimental Protocols
Protocol 3.1: Titration of Inducer for Optimal Expression
- Transform Corynebacterium glutamicum ATCC 13032 with plasmid pEKEx2-mrx1-roGFP2.
- Inoculate single colonies in 5 mL BHI medium with appropriate antibiotics. Grow overnight at 30°C, 220 rpm.
- Dilute cultures to OD600 0.05 in fresh, pre-warmed CGXII minimal medium with 2% glucose.
- Aliquot 5 mL of diluted culture into separate flasks. Add IPTG to final concentrations of 0, 1, 5, 10, 25, 50, and 100 µM.
- Grow cultures to mid-log phase (OD600 0.6-0.8).
- Harvest 1 mL of cells by centrifugation (13,000 x g, 2 min). Wash once in PBS buffer (pH 7.4).
- Resuspend cells in PBS to OD600 1.0 for immediate fluorescence measurement (Protocol 3.3).
Protocol 3.2: Standardized Growth for Maximal ΔR
- Prepare CGXII minimal medium with 2% (w/v) glucose and appropriate antibiotics.
- Inoculate from a fresh single colony and grow a 5 mL starter culture overnight.
- Dilute the starter to OD600 0.05 in 50 mL of fresh medium in a 250 mL baffled flask.
- Add optimal IPTG concentration (e.g., 10 µM) at inoculation.
- Incubate at 30°C with vigorous shaking (220-250 rpm).
- Monitor growth and harvest cells precisely at OD600 0.6-0.8 (mid-log phase).
Protocol 3.3: In Vivo Fluorescence Measurement & ΔR Calculation
- Prepare cell suspensions from Protocols 3.1/3.2 at OD600 1.0 in PBS.
- For fully oxidized baseline: Treat an aliquot with 100 µM diamide for 5 min.
- For fully reduced baseline: Treat a separate aliquot with 10 mM dithiothreitol (DTT) for 5 min.
- Load 200 µL of each sample (untreated, oxidized, reduced) into a black 96-well plate with a clear bottom.
- Using a plate reader, perform excitation scanning from 350-500 nm, with emission fixed at 510 nm. Alternatively, record dual-excitation ratios: measure fluorescence intensity with excitation at 405 nm (F405) and 488 nm (F488), emission 510 nm.
- Calculate ΔR: ΔR = (F405/F488)reduced / (F405/F488)oxidized.
4. Visualizing the Optimization Logic and Workflow
Diagram Title: Mrx1-roGFP2 Optimization Workflow
Diagram Title: Mrx1-roGFP2 Redox Coupling Mechanism
5. The Scientist's Toolkit: Key Research Reagent Solutions
Table 2: Essential Materials for Mrx1-roGFP2 Redox Sensing in Corynebacteria
| Reagent/Material | Function/Description | Example Supplier/Catalog |
|---|---|---|
| pEKEx2-mrx1-roGFP2 Plasmid | Expression vector with IPTG-inducible promoter for biosensor expression in C. glutamicum. | Custom construct (Addgene derivative). |
| Corynebacterium glutamicum ATCC 13032 | Standard wild-type, biosafety level 1 host strain. | American Type Culture Collection (ATCC). |
| CGXII Minimal Medium | Chemically defined medium for controlled growth conditions. | Formulated in-lab per published recipes. |
| Isopropyl β-D-1-thiogalactopyranoside (IPTG) | Inducer for precise control of biosensor expression level. | MilliporeSigma (I6758). |
| Diamide (Azodicarboxylic acid bis(Dimethylamide)) | Thiol-specific oxidant used to fully oxidize roGFP2 for ΔR calculation. | Thermo Fisher Scientific (AC409161000). |
| Dithiothreitol (DTT) | Strong reducing agent used to fully reduce roGFP2 for ΔR calculation. | GoldBio (DTT100). |
| Black 96-Well Clear-Bottom Plate | Optimal plate for fluorescence measurements, minimizing cross-talk. | Corning (3603). |
| Fluorescence Plate Reader | Instrument capable of dual-excitation ratiometric measurement (405/488 nm ex, 510 nm em). | e.g., Tecan Spark, BMG Labtech CLARIOstar. |
The development of redox-sensitive fluorescent probes, such as Mrx1-roGFP2, has revolutionized the real-time, in vivo monitoring of cellular redox states. In mycobacteria and related actinomycetes like Corynebacterium, the dominant low-molecular-weight thiol is mycothiol (MSH), not glutathione (GSH). This presents a critical challenge: a redox biosensor must be exquisitely specific for the MSH redox couple to accurately report the physiologically relevant redox potential within these cells. Non-specific reactivity with other cellular thiols (e.g., coenzyme A, cysteine) can lead to significant signal artifact and erroneous biological conclusions. This whitepaper details the experimental framework for validating the specificity of the Mrx1-roGFP2 biosensor within the context of Corynebacterium research, ensuring data integrity for fundamental science and drug discovery.
Core Principle: Mrx1-roGFP2 Mechanism
The Mrx1-roGFP2 probe is a genetically encoded fusion protein. The roGFP2 component is a redox-sensitive green fluorescent protein whose excitation spectrum shifts based on the dithiol/disulfide status of engineered cysteine residues. The Mrx1 component is a mycothiol-dependent oxidoreductase that specifically catalyzes the reversible reduction of roGFP2 using mycothiol. Mycothiol redox state (MSH/MSSM) thus dictates the roGFP2 redox state, which is read out ratiometrically (ex405/ex488).
Diagram Title: Mrx1-roGFP2 Redox Sensing Mechanism
Specificity Validation: Experimental Strategy
Validation requires a multi-pronged approach comparing probe response in systems with varying thiol compositions.
In Vitro Characterization with Purified Proteins
- Objective: To establish the fundamental kinetic parameters and thiol specificity of the Mrx1-roGFP2 reaction in a controlled environment.
Protocol:
- Express and purify His-tagged Mrx1-roGFP2 from E. coli.
- Fully reduce or oxidize the probe using DTT or diamide, respectively. Desalt to remove small molecules.
- In a fluorescence plate reader, incubate the pre-oxidized probe with reaction buffer.
- Initiate reduction by adding mycothiol (MSH) at physiological concentrations (0.1-10 mM). In parallel reactions, substitute MSH with glutathione (GSH), cysteine (Cys), coenzyme A (CoASH), or dithiothreitol (DTT).
- Monitor the kinetics of the increase in the 405nm/488nm excitation ratio over time.
- Calculate apparent second-order rate constants (k~app~) for each thiol.
Expected Data & Interpretation: Mrx1-roGFP2 will show a >1000-fold faster reaction rate with MSH compared to GSH or other low-molecular-weight thiols. DTT, a non-physiological dithiol, may reduce the probe directly (bypassing Mrx1) and serves as a positive control for roGFP2 functionality.
Table 1: In Vitro Kinetic Parameters of Mrx1-roGFP2 Reduction by Various Thiols
| Thiol Reductant | Concentration Tested (mM) | Apparent Rate Constant k~app~ (M⁻¹s⁻¹) | Relative Rate (vs. MSH) |
|---|---|---|---|
| Mycothiol (MSH) | 1-5 | ~5000 | 1.0 |
| Glutathione (GSH) | 1-5 | < 5 | < 0.001 |
| Cysteine (Cys) | 1-5 | < 2 | < 0.0004 |
| Coenzyme A | 1-5 | < 1 | < 0.0002 |
| DTT | 0.5-1 | ~0.1* | N/A (direct) |
Note: DTT reduces roGFP2 directly; rate is not mediated by Mrx1.
In Vivo Validation in Genetically Modified Hosts
- Objective: To confirm specificity in a live cellular context with complex thiol backgrounds.
- Protocol:
- Heterologous Expression in E. coli: Transform E. coli (which has GSH, no MSH) with a plasmid expressing Mrx1-roGFP2. Measure the baseline ratio and response to oxidants (e.g., H~2~O~2~) and reductants. The probe should show minimal dynamic response due to lack of its specific substrate (MSH).
- Expression in MSH-Deficient Corynebacterium: Utilize a ΔmshA or ΔmshC mutant strain of C. glutamicum that is completely devoid of mycothiol. Introduce Mrx1-roGFP2. Measure baseline fluorescence ratio and compare it to the wild-type strain. The mutant strain should show a constitutively oxidized probe state (high 405/488 ratio) that is unresponsive to physiological redox challenges, confirming the probe's dependence on MSH.
- Competition/Complementary Assays: In wild-type Corynebacterium, treat cells with agents that selectively deplete MSH (e.g., cerulenin) or other thiols, and monitor concomitant changes in Mrx1-roGFP2 ratio.
Table 2: In Vivo Mrx1-roGFP2 Response in Different Genetic Backgrounds
| Host Organism | Endogenous Dominant Thiol | Mrx1-roGFP2 Baseline Ratio (405/488) | Dynamic Range (ΔRatio upon H~2~O~2~) | Interpretation |
|---|---|---|---|---|
| E. coli (Wild-type) | Glutathione | High | Minimal (<0.2) | Probe oxidized, non-functional without MSH |
| C. glutamicum (WT) | Mycothiol | Low (~Reduced) | Large (>1.0) | Probe functional and responsive |
| C. glutamicum (ΔmshA) | None* | Very High | None (~0) | Probe locked oxidized, validates MSH-dependence |
*Other minor thiols may be present.
Diagram Title: In Vivo Specificity Validation Workflow
The Scientist's Toolkit: Key Research Reagent Solutions
Table 3: Essential Reagents for Mrx1-roGFP2 Specificity Studies
| Reagent / Material | Function / Role in Specificity Validation | Key Consideration |
|---|---|---|
| Purified Mycothiol (MSH) | The gold-standard substrate for in vitro kinetics and competition assays. | Chemically synthesized or purified from mycobacteria. Stability is critical; store lyophilized at -80°C. |
| Mrx1-roGFP2 Plasmid (e.g., pMN016 backbone) | Genetically encoded biosensor for expression in target organisms. | Ensure promoter is functional in Corynebacterium (e.g., Ptuf). |
| C. glutamicum MSH-null Mutant (e.g., ΔmshA) | Isogenic control strain lacking mycothiol. Essential for in vivo specificity proof. | Available from strain collections (e.g., ATCC, DSMZ) or created via gene knockout. |
| Redox Perturbants (Diamide, H~2~O~2~, DTT) | Used to experimentally shift cellular redox balance and test probe dynamic range. | Titrate carefully in vivo to avoid non-specific stress. |
| Thiol-Alkylating Agents (N-Ethylmaleimide, IAM) | Quench free thiols in situ to "snap-freeze" redox state during cell lysis for validation. | Add directly to culture medium prior to harvesting. |
| Fluorescence Plate Reader / Confocal Microscope | Equipment to measure the ratiometric (405/488 ex, 510 em) signal. | Must have dual-excitation capability for accurate ratio quantification. |
| Anaerobic Chamber / Workstation | For conducting experiments at defined low redox potentials. | Critical for establishing the fully reduced baseline of the probe. |
In the study of redox biology within bacterial systems such as Corynebacterium, precise measurement of thiol-based redox states is paramount. The fusion protein Mrx1-roGFP2 has emerged as a powerful genetically encoded biosensor for monitoring mycothiol redox potential (MSSH/MSSC). However, a significant and often underappreciated challenge in such measurements is interference from physiological pH fluctuations. The fluorescent properties of many biosensors, including early redox-sensitive GFP (roGFP) variants, are intrinsically sensitive to pH, potentially confounding redox readings. This technical guide details the mechanisms of pH interference and explains the engineered advantage of the roGFP2 variant, which incorporates critical point mutations to minimize pH sensitivity, thereby ensuring accurate and reliable redox measurements in the context of Corynebacterium mycothiol research.
The Problem of pH Interference in Redox Sensing
Fluorescent protein-based sensors rely on the protonation states of chromophore residues, which can be altered by both redox changes and pH changes. In a typical roGFP, the chromophore's excitation spectrum can shift due to ambient [H⁺], leading to incorrect calculation of the oxidation state if pH is not controlled or accounted for. Within the cytosol of Corynebacterium, pH can vary due to metabolic activity, stress responses, or experimental conditions.
The roGFP2 Molecular Advantage
roGFP2 is a refined version of the original roGFP1, engineered with specific mutations (e.g., S65T, Q80R, S147C, Q204C, N149C, S202H) that confer two major advantages:
- Dual-Excitation Ratiometric Measurement: The sensor contains two cysteine residues forming a disulfide bond that alters the chromophore's protonation equilibrium, creating two excitation peaks (∼400 nm for protonated/oxidized, ∼490 nm for deprotonated/reduced) while emitting at ∼510 nm. The ratio (Ex400/Ex490) is directly related to the redox state.
- Reduced Intrinsic pH Sensitivity: The key mutation S65T accelerates chromophore maturation and improves brightness, but more critically, the combination of other mutations stabilizes the chromophore's pKa and decouples the pH-dependent spectral changes from the redox-dependent ones. This makes the 400/490 nm excitation ratio largely insensitive to physiological pH ranges (pH 6.0-8.0).
Quantitative Comparison of pH Sensitivity
The following table summarizes key data from comparative studies of pH sensitivity in roGFP variants.
Table 1: pH Sensitivity of roGFP Variants
| Sensor Variant | Key Mutations | Reported pKa of Chromophore | ΔRatio (400/490) per pH unit (pH 6-8) | Suitability for Redox Measurement in Varying pH |
|---|---|---|---|---|
| roGFP1 | S147C, Q204C | ~7.1 (wild-type-like) | High (>0.5) | Poor - Requires strict pH control/clamping |
| roGFP2 | S65T, S147C, Q204C, Q80R | ~6.0 (reduced) | Very Low (<0.1) | Excellent - Ratio is stable across physiological pH |
| roGFP2-iL (improved L) | roGFP2 + F99S, M153T, V163A | ~6.0 | Very Low (<0.1) | Excellent, with improved brightness and folding |
| Mrx1-roGFP2 | roGF2 fused to Mycothiol Reductase (Mrx1) | Governed by roGFP2 moiety | Very Low (<0.1) | Designed for Corynebacterium; maintains roGFP2's pH resistance |
Table 2: Key Spectral Properties of Mrx1-roGFP2 for Corynebacterium
| Property | Value / Characteristic | Implication for Experimentation |
|---|---|---|
| Excitation Peaks | ~400 nm (Oxidized), ~490 nm (Reduced) | Enables ratiometric, intensity-independent measurement |
| Emission Peak | ~510 nm | Standard FITC filter sets are applicable |
| Dynamic Range (Rᵒᵈ/Rʳᵉᵈ) | Typically 5-10 fold | Provides a strong signal-to-noise ratio for oxidation state changes |
| pH Stability Range | Ratio stable between pH 5.5 and 8.5 | Reliable readings in Corynebacterium cytosol without clamping |
| Response Time | Sub-second to few seconds (via Mrx1) | Enables real-time monitoring of mycothiol redox dynamics |
Experimental Protocol: Measuring Mycothiol Redox with Mrx1-roGFP2
Biosensor Expression inCorynebacterium
- Strain Construction: Clone the mrx1-roGFP2 gene (optimized for Corynebacterium codon usage) into an appropriate expression vector (e.g., pEKEx2) under a constitutive or inducible promoter (e.g., Ptac).
- Transformation & Cultivation: Transform the construct into your Corynebacterium strain of interest (e.g., C. glutamicum ATCC 13032). Grow cells in standard rich (e.g., BHI) or defined medium with appropriate antibiotics. Induce expression if using an inducible system.
- Harvesting: Harvest cells at mid-exponential phase (OD₆₀₀ ~5-8) by centrifugation (4,000 x g, 5 min, room temperature). Wash cells once in assay buffer (e.g., 50 mM phosphate buffer, pH 7.0, with 100 mM KCl).
Fluorescence Measurement (Plate Reader Protocol)
- Sample Preparation: Resuspend washed cells to a final OD₆₀₀ of ~1.0 in assay buffer. Distribute 200 µL aliquots into a black-walled, clear-bottom 96-well plate.
- Ratiometric Reading: Using a microplate reader with monochromators or appropriate filter sets, measure fluorescence intensity sequentially at:
- Excitation 1: 400 ± 10 nm, Emission: 510 ± 20 nm.
- Excitation 2: 490 ± 10 nm, Emission: 510 ± 20 nm.
- Calibration (In-vivo): For absolute redox potential (E) calculation, perform a parallel calibration on each sample batch.
- Fully Reduced (Rmin): Treat cells with 10 mM DTT (final conc.) for 10-15 min.
- Fully Oxidized (Rmax): Treat cells with 1 mM Diamide (final conc.) for 10-15 min.
- Background: Measure fluorescence from wild-type cells (no sensor) under identical conditions and subtract from all readings.
- Data Calculation:
- Calculate the background-subtracted ratio: R = (I₄₀₀ / I₄₉₀).
- Calculate the degree of oxidation (OxD): OxD = (R - Rmin) / (Rmax - Rmin).
- Calculate the apparent redox potential (E) using the Nernst equation: E = E⁰ - (RT/nF) * ln([Red]/[Ox]), where [Red]/[Ox] = (1 - OxD)/OxD, and E⁰ for the Mrx1-roGFP2/mycothiol pair is approximately -310 mV (confirm for your specific construct).
Protocol Notes on pH Control
- While roGFP2 is pH-resistant, for utmost precision, especially under extreme stress conditions, consider using pH-clamping buffers with ionophores (e.g., nigericin) in high-K⁺ buffers. However, this is often unnecessary for routine Corynebacterium experiments.
- Concurrent measurement with a pH sensor (e.g., pHluorin) can be performed to empirically verify the lack of pH interference in your system.
Diagrams
roGFP2 vs pH Interference in Mrx1 Sensor
Mrx1-roGFP2 Experimental Workflow
The Scientist's Toolkit: Research Reagent Solutions
Table 3: Essential Reagents for Mrx1-roGFP2 Redox Experiments
| Reagent / Material | Function & Rationale | Example / Note |
|---|---|---|
| Mrx1-roGFP2 Plasmid | Genetically encoded biosensor. Expresses the fusion protein for specific detection of mycothiol redox potential. | pEKEx2-mrx1-roGFP2 (Coryne-optimized). |
| Corynebacterium glutamicum Strain | Model organism for actinobacterial redox biology and mycothiol metabolism. | ATCC 13032 or derived mutants. |
| Dithiothreitol (DTT) | Strong reducing agent. Used for in-vivo calibration to define Rmin (100% reduced sensor). | Use at 10 mM final concentration. |
| Diamide | Thiol-oxidizing agent. Used for in-vivo calibration to define Rmax (100% oxidized sensor). | Use at 0.5-1 mM final concentration. |
| Black-walled 96-well Plate | Microplate for fluorescence readings. Minimizes cross-talk and background signal between wells. | Corning 3600 or equivalent. |
| Fluorescence Microplate Reader | Instrument capable of sequential excitation at 400nm and 490nm, with emission at 510nm. | Equipped with monochromators or specific filter sets. |
| Phosphate/KCl Assay Buffer | Physiological suspension buffer. Maintains osmolarity and provides a stable baseline for measurements. | 50 mM Potassium Phosphate, 100 mM KCl, pH 7.0. |
| Nigericin (Optional) | K⁺/H⁺ ionophore. Used in pH-clamping experiments to equilibrate intra- and extracellular pH. | Only needed for explicit pH control studies. |
| High-K⁺ Buffer (Optional) | Used with nigericin to clamp cytosolic pH to the buffer's known pH. | e.g., 125 mM KCl, 20 mM HEPES, 20 mM MES. |
Troubleshooting Guide for Common Experimental Pitfalls
1. Introduction and Thesis Context The study of mycothiol (MSH) redox homeostasis in Corynebacterium species, particularly C. glutamicum and pathogenic C. diphtheriae, is critical for understanding bacterial oxidative stress defense, a potential target for novel antimicrobials. The central thesis of our research posits that the genetically encoded biosensor Mrx1-roGFP2 provides a specific, real-time, and quantitative readout of the mycothiol redox potential (EMSH) in live cells, enabling unprecedented dissection of redox physiology. This guide addresses common experimental pitfalls encountered when deploying this tool to ensure robust and reproducible data.
2. The Scientist's Toolkit: Essential Research Reagents
| Reagent/Material | Function in Mrx1-roGFP2 Experiments |
|---|---|
| Mrx1-roGFP2 Plasmid (e.g., pEC-XT99A derivative) | Expression vector for biosensor in Corynebacterium. Contains selective marker (e.g., kanamycin resistance). |
| Corynebacterium glutamicum ATCC 13032 (or specific mutant) | Standard model organism with well-characterized MSH metabolism. |
| BHIS Complex Medium | Rich growth medium for Corynebacterium. |
| CGXII Defined Minimal Medium | Enables precise control over environmental conditions and nutrient availability. |
| Dithiothreitol (DTT) 10-100 mM | Strong reducing agent for calibrating biosensor to 100% reduced state (Rmin). |
| Diamide 10-100 mM | Thiol-oxidizing agent for calibrating biosensor to 100% oxidized state (Rmax). |
| Kanamycin 25 μg/mL | Selective antibiotic for plasmid maintenance. |
| Phosphate-Buffered Saline (PBS), pH 7.0 | Wash and resuspension buffer for fluorescence measurements. |
| Fluorescence Plate Reader or Spectrophotometer | Must have capability for dual excitation (e.g., 400nm and 490nm) and emission detection (~510nm). |
| Anaerobic Chamber or Oxygen-Scavenging System | For creating anoxic conditions required for full reduction during calibration. |
3. Key Experimental Protocols
Protocol 1: Biosensor Calibration (In vitro or In vivo) Objective: Determine Rmin and Rmax values for calculating the oxidation degree (OxD) and EMSH. Steps:
- Grow Corynebacterium strain expressing Mrx1-roGFP2 to mid-exponential phase (OD600 ~0.8-1.0).
- Harvest cells, wash twice with PBS, and resuspend in PBS.
- Aliquot suspension into three cuvettes or microplate wells.
- Sample A (Rmax): Treat with 10 mM Diamide for 5-10 minutes at room temperature.
- Sample B (Rmin): Treat with 10 mM DTT under anaerobic conditions for 30 minutes. (For in vitro calibration, cell lysis via sonication is required prior to treatment).
- Sample C (Untreated): No treatment for subsequent experimental measurement.
- Measure fluorescence with excitation at 400 nm (F400) and 490 nm (F490). Emission is collected at 510-530 nm.
- Calculate the ratiometric value R = F400 / F490 for each sample.
- Compute Oxidation Degree: OxD = (R - Rmin) / (Rmax - Rmin).
Protocol 2: Real-time EMSH Monitoring During Stress Objective: Dynamically track mycothiol redox changes in response to stressors (e.g., H2O2, antibiotics). Steps:
- Calibrate the biosensor system as per Protocol 1 to establish Rmin and Rmax constants.
- In a 96-well plate, load bacterial suspension expressing Mrx1-roGFP2.
- Establish a baseline by reading fluorescence (F400 and F490) every 1-2 minutes for 10-15 minutes.
- Inject the stressor compound (e.g., 0.5 mM H2O2) using the instrument's injector or manually.
- Continue dual-excitation fluorescence measurements for the desired duration (e.g., 60-120 minutes).
- Convert the ratiometric data (R) to OxD and subsequently to EMSH using the Nernst equation: EMSH = E0 - (RT/nF) * ln([MSH]2/[MSSM]), where E0 for Mrx1-roGFP2 is typically derived from calibration (~ -280 mV).
4. Quantitative Data Summary: Typical Calibration and Response Values Table 1: Representative Mrx1-roGFP2 Calibration Parameters in C. glutamicum
| Parameter | Value (Mean ± SD) | Conditions / Notes |
|---|---|---|
| Rmin | 0.50 ± 0.05 | Fully reduced with DTT, anaerobic |
| Rmax | 2.10 ± 0.15 | Fully oxidized with Diamide |
| Dynamic Range (Rmax/Rmin) | 4.20 ± 0.30 | Indicator of biosensor sensitivity |
| Apparent E0 (mV) | -279 ± 5 mV | Derived from calibration, pH 7.0 |
| Response Time (t1/2) | < 2 minutes | Time to reach 50% signal change after H2O2 pulse |
Table 2: EMSH Changes Under Common Experimental Stressors
| Stress Condition | EMSH at Baseline (mV) | EMSH Peak Shift (mV) | Time to Max Shift (min) | Recovery |
|---|---|---|---|---|
| 0.2 mM H2O2 | -310 ± 5 | +45 (to ~ -265 mV) | 5-10 | Partial within 60 min |
| 1.0 mM H2O2 | -310 ± 5 | +80 (to ~ -230 mV) | 2-5 | No recovery observed |
| Stationary Phase | -300 ± 8 | +25 (vs. mid-log) | N/A | N/A |
| mshC Mutant (MSH-deficient) | Sensor Non-Functional | N/A | N/A | N/A |
5. Troubleshooting Common Pitfalls
Pitfall 1: Low or No Fluorescence Signal. Cause: Poor plasmid expression or incorrect growth conditions. Solution: Verify plasmid integrity via sequencing, optimize induction conditions (IPTG concentration if using a regulated promoter), ensure use of correct antibiotic, and confirm culture health.
Pitfall 2: Poor Dynamic Range (Low Rmax/Rmin Ratio). Cause: Incomplete oxidation or reduction during calibration; sensor overexpression leading to aggregation. Solution: For Rmax, ensure Diamide is fresh and treatment time is sufficient. For Rmin, strict anaerobiosis is critical—use an airtight chamber and oxygen scavengers. Titrate expression to lower levels.
Pitfall 3: Unstable Baseline Ratios. Cause: pH fluctuations or photobleaching. Solution: roGFP2 is pH-sensitive near physiological range. Use robust buffering (e.g., 50-100 mM phosphate buffer). Reduce excitation light intensity and frequency during kinetic reads to minimize photobleaching.
Pitfall 4: Inconsistent Stress Responses. Cause: Variations in cell density, growth phase, or medium composition. Solution: Standardize inoculum, harvest cells at the same OD600 every time, and use defined minimal media (CGXII) for stress assays to avoid confounding effects of complex media components.
Pitfall 5: Data Cannot Be Normalized to OxD. Cause: Failure to perform proper in vivo calibration for each experiment. Solution: Always include parallel biological samples treated with DTT and Diamide in every experimental run to determine experiment-specific Rmin and Rmax. Do not rely on historical values.
6. Visualization of Workflows and Pathways
Diagram Title: Mrx1-roGFP2 Biosensor Experimental and Calibration Workflow
Diagram Title: Mrx1-roGFP2 Mycothiol Redox Sensing Mechanism
Benchmarking Mrx1-roGFP2: Validation Against Gold Standards and Competing Tools
Within the framework of developing Mrx1-roGFP2 as a dynamic, in vivo biosensor for monitoring the mycothiol (MSH) redox potential in Corynebacterium species, a critical validation step involves direct comparison with the established biochemical gold standard: HPLC-based quantification of mycothiol disulfide (MSSM). This whitepaper provides an in-depth technical comparison of these two methodologies, detailing their principles, experimental protocols, and relative strengths and limitations for researchers in bacterial redox biology and antimicrobial drug development.
Core Principles & Comparison
Mrx1-roGFP2 (In Vivo Biosensor): This genetically encoded probe consists of a redox-sensitive green fluorescent protein (roGFP2) fused to the mycothiol-dependent oxidoreductase Mrx1. Changes in the cellular MSH redox state alter the thiol-disulfide equilibrium of roGFP2 via Mrx1, causing a ratiometric shift in fluorescence upon excitation at 400 nm and 490 nm. The ratio is correlated to the mycothiol redox potential (E~MSH~).
HPLC-Based MSSM Quantification (In Vitro Biochemical Assay): This endpoint method involves acid quenching of cells to preserve thiol/disulfide states, followed by derivatization with monobromobimane (mBBr) to tag reduced thiols. After reduction of disulfide bonds (e.g., with dithiothreitol, DTT), a second derivatization step labels originally oxidized species. HPLC separation with fluorescence detection quantifies both reduced MSH and oxidized MSSM, allowing calculation of the oxidation percentage and redox potential.
Summary Table: Method Comparison
| Parameter | Mrx1-roGFP2 | HPLC-Based MSSM Quantification |
|---|---|---|
| Measurement Type | Ratiometric, reversible, in vivo | Endpoint, destructive, in vitro |
| Temporal Resolution | High (seconds to minutes) | Low (single time point per sample) |
| Spatial Resolution | Subcellular compartment possible (if targeted) | Whole-cell population average |
| Key Output | Real-time biosensor ratio (R) → Calculated E~MSH~ | Absolute concentrations of MSH & MSSM → % MSSM → Calculated E~MSH~ |
| Throughput | High (plate readers, microscopy) | Low to medium |
| Technical Complexity | Moderate (requires genetic engineering) | High (sample processing, HPLC expertise) |
| Primary Advantage | Real-time, dynamic, single-cell imaging | Absolute quantification, chemically definitive |
| Primary Limitation | Requires calibration, relative signal | No kinetic or single-cell data, complex workflow |
Detailed Experimental Protocols
Protocol A: Mrx1-roGFP2 Measurement inCorynebacterium
1. Strain Construction & Culture:
- Express the mrx1-roGFP2 gene construct (e.g., from plasmid pALM10) in your Corynebacterium strain of interest (e.g., C. glutamicum).
- Grow cells to mid-exponential phase in appropriate medium.
2. Ratiometric Fluorescence Measurement (Plate Reader):
- Transfer 200 µL of cell suspension to a black 96-well plate.
- Measure fluorescence intensity sequentially at two excitation wavelengths (λ~ex~ = 400 nm and λ~ex~ = 490 nm; λ~em~ = 510-530 nm).
- Calculate the fluorescence ratio R = I~400~ / I~490~.
3. In Vivo Calibration:
- Full Oxidation: Treat cells with 2 mM diamide (a thiol oxidant) for 5-10 min.
- Full Reduction: Treat cells with 10 mM dithiothreitol (DTT) for 5-10 min.
- Measure R~ox~ and R~red~.
- Calculate the degree of oxidation (OxD~roGFP~) = (R - R~red~) / (R~ox~ - R~red~).
4. Calculate E~MSH~:
- Use the Nernst equation: E~MSH~ = E~0~ - (RT/nF) * ln([MSH]^2^/[MSSM]).
- The probe is in equilibrium with the MSH/MSSM pool: OxD~roGFP~ = [MSSM] / ([MSH] + [MSSM]).
- Combined formula for a 2-electron process: E~MSH~ = E~0~ - (RT/2F) * ln( (1 - OxD~roGFP~)^2^ / OxD~roGFP~ ).
- E~0~ for the Mrx1-roGFP2/MSH couple is approximately -311 mV at pH 7.0.
Protocol B: HPLC-Based MSSM Quantification
1. Cell Quenching and Extraction:
- Rapidly mix 1 mL culture with 0.5 mL of ice-cold 40% (v/v) trichloroacetic acid (TCA). Incubate on ice for 15 min.
- Centrifuge (16,000 x g, 10 min, 4°C). Retain the supernatant containing acid-soluble thiols.
2. Derivatization for "Reduced" Thiols (Free MSH):
- Take an aliquot of the TCA extract, neutralize with Tris-base buffer (pH ~8.0).
- Add monobromobimane (mBBr, final conc. 1-2 mM). Incubate in the dark at room temperature for 15 min.
- The reaction is stopped by acidification with formic acid. This sample yields the MSH-bimane peak.
3. Derivatization for "Total" Thiols (MSH + MSSM):
- Take a second aliquot of the TCA extract, neutralize.
- Add DTT (final conc. 5 mM) to reduce all disulfides. Incubate 15 min at room temperature.
- Add mBBr to derivative the newly reduced thiols (originally from MSSM) plus all original MSH. Stop with acid. This sample yields the Total MSH-bimane peak.
4. HPLC Analysis:
- Column: C18 reverse-phase column (e.g., 5 µm, 250 x 4.6 mm).
- Mobile Phase: Solvent A: 0.1% (v/v) trifluoroacetic acid in water. Solvent B: Methanol or Acetonitrile.
- Gradient: 10% B to 90% B over 20-25 min.
- Detection: Fluorescence (λ~ex~ = 390 nm, λ~em~ = 480 nm).
- Quantification: Integrate peak areas. Calibrate with authentic MSH-bimane standard.
- Calculation: [MSSM] = ([Total MSH] - [Free MSH]) / 2. % MSSM = (2[MSSM] / ([Free MSH] + 2[MSSM])) * 100.
The Scientist's Toolkit: Essential Research Reagents
| Reagent / Material | Function / Purpose |
|---|---|
| Mrx1-roGFP2 Plasmid (e.g., pALM10) | Genetic construct for biosensor expression in Corynebacterium. |
| Monobromobimane (mBBr) | Thiol-specific fluorescent derivatizing agent for HPLC detection. |
| Diamide | Thiol-oxidizing agent used for in vivo biosensor calibration. |
| Dithiothreitol (DTT) | Strong reducing agent; used for biosensor calibration and reducing disulfides in HPLC protocol. |
| Trichloroacetic Acid (TCA) | Strong acid for rapid metabolic quenching and protein precipitation. |
| C18 Reverse-Phase HPLC Column | Stationary phase for separation of bimane-derivatized thiols. |
| Authentic Mycothiol Standard | Essential chemical standard for calibrating HPLC quantification. |
Visualizations
Title: Mrx1-roGFP2 vs. HPLC Method Decision Logic
Title: Mrx1-roGFP2 Mycothiol Sensing Mechanism
Within the context of a broader thesis on utilizing Mrx1-roGFP2 for monitoring mycothiol (MSH) redox state in Corynebacterium research, the selection of a biosensor is paramount. The unique low-molecular-weight thiol MSH, functionally analogous to glutathione in other bacteria, is central to redox homeostasis and virulence in actinomycetes. Accurate, compartment-specific measurement of its redox potential (E~MSH~) is critical for understanding bacterial physiology and identifying novel drug targets. This whitepaper provides an in-depth technical comparison between the specific fusion protein Mrx1-roGFP2 and general thiol-reactive probes like monochlorobimane (mBCI).
Core Technology Comparison
Mrx1-roGFP2: A Ratiometric, Specific Biosensor
Mrx1-roGFP2 is a genetically encoded, fusion protein biosensor. It couples the redox-sensitive green fluorescent protein 2 (roGFP2) to the mycothiol-dependent oxidoreductase Mrx1.
- Mechanism: Mrx1 catalyzes the equilibration between the roGFP2 disulfide bond and the MSH/mycothiol disulfide (MSSM) pool. Changes in the MSH redox state alter the roGFP2 disulfide status, causing a ratiometric shift in its excitation spectrum.
- Key Feature: It reports the thermodynamic redox potential (E~MSH~), not merely thiol abundance.
Monochlorobimane: A General Thiol-Trapping Probe
mBCI is a small, cell-permeable, fluorogenic compound.
- Mechanism: It undergoes glutathione S-transferase (GST)-mediated conjugation with reduced thiols (primarily glutathione in eukaryotes, but also MSH in bacteria) to form a fluorescent adduct.
- Key Feature: It reports the concentration of reduced thiols available for reaction, which is influenced by both total thiol pool size and its reduction state.
Quantitative Data Comparison
Table 1: Technical Specifications and Performance Comparison
| Feature | Mrx1-roGFP2 | Monochlorobimane (mBCI) |
|---|---|---|
| Target | Mycothiol Redox Potential (E~MSH~) | Reduced Thiol Concentration (e.g., MSH) |
| Output | Ratiometric (Ex400/Ex490 nm, Em510 nm) | Intensity-based (Ex~380 nm, Em~470 nm) |
| Specificity | High. Specific for MSH/MSSM pool via Mrx1 enzyme. | Low. Reacts with any accessible reduced thiol (MSH, CoASH, protein-SH). |
| Quantitation | Absolute E~MSH~ (mV) calculable via Nernst equation. | Relative or semi-quantitative reduced thiol levels. |
| Response Dynamics | Reversible, real-time monitoring. | Irreversible, cumulative signal (thiol trapping). |
| Cellular Localization | Genetically targetable (cytosol, organelles). | Diffusible, distribution influenced by permeability & GST activity. |
| Calibration | Requires in vivo calibration with DTT and diamide. | Requires external standards; sensitive to loading efficiency. |
| Key Interference | Minimal. Sensor response is coupled to MSH pool via Mrx1. | High. Affected by GST homolog activity, probe uptake, export, and other thiols. |
Table 2: Experimental Data from Corynebacterium Studies
| Parameter | Mrx1-roGFP2 Reported Values | mBCI/General Probe Context |
|---|---|---|
| Resting E~MSH~ | Approx. -290 ± 10 mV (cytosol, C. glutamicum) | Not applicable (measures concentration, not potential). |
| Dynamic Range | ~100-150 mV (from fully oxidized to reduced) | Linear over limited concentration range; saturates. |
| Detection Limit | Sensitive to ~5-10 mV shifts in E~MSH~. | nM-μM concentrations of reduced MSH. |
| Response Time to Oxidant | Seconds to minutes (reversible). | Minutes (irreversible accumulation). |
Experimental Protocols
Protocol: Calibration and Live-Cell Imaging of Mrx1-roGFP2 inCorynebacterium
Objective: To determine the absolute mycothiol redox potential (E~MSH~) in live Corynebacterium cells expressing Mrx1-roGFP2.
Materials: See "The Scientist's Toolkit" below.
Procedure:
- Strain & Culture: Grow Corynebacterium strain expressing Mrx1-roGFP2 (from a plasmid or integrated into genome) to mid-exponential phase.
- Sample Preparation: Wash cells 2x in appropriate buffer (e.g., PBS or culture medium). Immobilize cells on agarose-padded slides or in a microplate.
- Ratiometric Imaging: Acquire fluorescence images using a microscope equipped with appropriate filter sets:
- Excite at 400 nm and 490 nm, collect emission at 510-550 nm for each condition.
- In vivo Calibration (Critical): a. Fully Reduced (R~min~): Treat cells with 10 mM DTT (a reducing agent) for 10-15 min. Acquire ratio images (Ex400/Ex490). b. Fully Oxidized (R~max~): Wash cells, then treat with 10 mM diamide (a thiol-oxidizing agent) for 10-15 min. Acquire ratio images. c. Experimental Ratio (R~exp~): Acquire ratio images of untreated or stimulated cells.
- Data Analysis: a. Calculate the degree of oxidation (OxD) for each pixel/cell: OxD = (R~exp~ - R~min~) / (R~max~ - R~min~). b. Calculate E~MSH~ using the Nernst equation: E~MSH~ = E~0~ - (RT/nF) * ln( (1 - OxD) / OxD ) Where E~0~ (midpoint potential of the sensor) is determined in vitro (typically ~ -280 mV for Mrx1-roGFP2), R is gas constant, T is temperature, n=2, F is Faraday's constant.
Protocol: Mycothiol Detection with Monochlorobimane inCorynebacterium
Objective: To semi-quantitatively assess reduced mycothiol levels in Corynebacterium cells.
Procedure:
- Culture: Grow wild-type or mutant Corynebacterium to desired phase.
- Probe Loading: Incubate cells with 50-100 μM mBCI in buffer or medium. Include controls: no-probe control, and a thiol-blocking control (pre-treat with 10 mM N-ethylmaleimide, NEM).
- Kinetics or Endpoint: Monitor fluorescence increase over time (kinetic assay) or take a single endpoint measurement (e.g., after 30-60 min).
- Measurement: Use a fluorometer or flow cytometer (Ex~355-380 nm, Em~460-480 nm). For microscopy, use a DAPI filter set.
- Data Analysis: Subtract background (no-probe) fluorescence. Normalize fluorescence to cell density (OD~600~). Results are expressed as relative fluorescence units (RFU). Caution: Signal intensity is not linearly proportional to E~MSH~ and is affected by factors beyond MSH concentration.
Pathway and Workflow Visualizations
Title: Mrx1-roGFP2 Redox Equilibrium Mechanism
Title: Mrx1-roGFP2 Experimental Data Workflow
Title: mBCI Mechanism for Mycothiol Detection
The Scientist's Toolkit: Research Reagent Solutions
Table 3: Essential Materials for Mycothiol Redox Research
| Item | Function/Benefit in Corynebacterium Research |
|---|---|
| Mrx1-roGFP2 Plasmid | Genetically encoded biosensor for ratiometric E~MSH~ measurement. Must be adapted for Corynebacterium expression (e.g., using E. coli-Coryne shuttle vectors with inducible promoters like Ptac). |
| Monochlorobimane (mBCI) | Cell-permeable, fluorogenic probe for detecting reduced thiol pools. Useful for initial screens of total reduced MSH but lacks specificity and ratiometric capability. |
| DTT (Dithiothreitol) | Strong reducing agent. Used for in vivo calibration of Mrx1-roGFP2 to define the fully reduced state (R~min~). |
| Diamide | Thiol-specific oxidizing agent. Used for in vivo calibration of Mrx1-roGFP2 to define the fully oxidized state (R~max~). |
| NEM (N-Ethylmaleimide) | Thiol-alkylating agent. Used as a negative control to block mBCI reaction, confirming thiol-dependent signal. |
| Corynebacterium-Specific | Electrocompetent cells and optimized electroporation protocols are essential for sensor delivery. |
| Expression Host | |
| Ratiometric Fluorescence | Microscope with fast wavelength-switching capability (e.g., monochromator or dual-excitation filter wheel) and a sensitive EMCCD/sCMOS camera. |
| Microscope Setup | |
| Specialized Growth Media | Defined media (e.g., CGXII for C. glutamicum) to control redox-active components that may influence E~MSH~. |
| Mycothiol ELISA Kit | Commercial kit (if available) or HPLC-based method to quantify total and reduced MSH independently, for validation of biosensor data. |
Assessing Dynamic Range and Sensitivity in Live Cells
The quantitative assessment of dynamic range and sensitivity is paramount for the deployment of genetically encoded biosensors in live-cell research. This guide provides an in-depth technical framework for these assessments, framed within the critical context of utilizing the Mrx1-roGFP2 redox biosensor to elucidate mycothiol redox homeostasis in Corynebacterium species. These bacteria, including the model organism C. glutamicum and the pathogen C. diphtheriae, utilize mycothiol (MSH) as their primary low-molecular-weight thiol, playing a role analogous to glutathione in other organisms. Precise measurement of the MSH redox potential (EMSH) via Mrx1-roGFP2 is essential for understanding bacterial oxidative stress responses and identifying potential drug targets.
Core Principles: Dynamic Range and Sensitivity
Dynamic Range (R): The ratio of the biosensor's fluorescence signal between its fully reduced and fully oxidized states in vitro under defined conditions. It defines the maximum theoretical signal change. Sensitivity (S): The responsiveness of the biosensor signal to changes in the target analyte, often represented by the slope of the calibration curve. For a Nernstian sensor like roGFP2-based probes, the ideal sensitivity is a ~30 mV change per 10-fold change in ratio.
Table 1: Key Performance Metrics of Mrx1-roGFP2 In Vitro
| Parameter | Value | Measurement Conditions |
|---|---|---|
| Dynamic Range (R) | ~7.0 | Ratio (Ex 405/488 nm, Em 510 nm) in 100 mM phosphate buffer, pH 7.0. |
| Apparent Midpoint Potential (Eapp) | -299 ± 3 mV | vs. standard hydrogen electrode (SHE), pH 7.0, 30°C. |
| pKa of roGFP2 | ~8.5 | Ensures minimal pH sensitivity in physiological range (pH 6.5-7.5). |
| Excitation Peaks | 400 nm (Ox), 490 nm (Red) | Isoemissive at ~510 nm. |
| Brightness | Moderate | Extinction coefficient and quantum yield similar to EGFP. |
Table 2: In Vivo Performance in Corynebacterium glutamicum
| Parameter | Estimated Value | Notes |
|---|---|---|
| Effective Dynamic Range | ~4.0 - 5.5 | Lower than in vitro due to cellular milieu, expression level, and basal redox state. |
| Resting EMSH | -310 to -290 mV | Strain and growth condition dependent. |
| Response Time (t1/2) | < 2 minutes | Upon addition of oxidant (e.g., H2O2) or reductant (e.g., DTT). |
| Photostability | High | Suitable for time-lapse imaging. |
Detailed Experimental Protocols
1In VitroCalibration for Dynamic Range and Midpoint Potential
Objective: Determine the maximum dynamic range (R) and apparent midpoint redox potential (Eapp) of the purified Mrx1-roGFP2 protein.
Reagents:
- Purified Mrx1-roGFP2 protein in 100 mM potassium phosphate buffer (KPi), 1 mM EDTA, pH 7.0.
- Redox buffers: 10 mM reduced (DTTred) and oxidized (DTTox) dithiothreitol in KPi buffer. Mix to achieve defined redox potentials (Eh) from -340 to -240 mV (calculated via Nernst equation).
- Anaerobic chamber or sealed cuvettes flushed with argon/nitrogen.
Procedure:
- Incubate 200 µL of purified protein (2-5 µM) with 800 µL of each pre-equilibrated DTT redox buffer for 2 hours at 30°C under anaerobic conditions.
- Transfer to a fluorescence spectrophotometer cuvette (maintain anaerobiosis).
- Acquire excitation spectra from 350 to 500 nm, with emission at 510 nm.
- For each sample, calculate the fluorescence intensity ratio (Ratiometric) = I405 / I488.
- Plot the Ratiometric against the Eh of the DTT buffer.
- Fit data to the Nernst equation: Ratio = Rred + (Rox - Rred) / (1 + 10(Eapp - Eh)*nF/RT).
- Rred and Rox are the ratio values for fully reduced and oxidized protein (defines Dynamic Range: R = Rox/Rred).
- Eapp is the fitted midpoint potential.
- n=2 for the dithiol-disulfide equilibrium, F, R, T have their usual meanings.
2In VivoCalibration in LiveCorynebacteriumCells
Objective: Determine the effective dynamic range and quantify the in vivo EMSH.
Reagents:
- C. glutamicum strain expressing Mrx1-roGFP2 chromosomally or from a plasmid.
- Treatment solutions: 10 mM H2O2 (oxidant), 10 mM DTT (reductant), 20 mM N-ethylmaleimide (NEM, thiol alkylator).
- Appropriate growth medium (e.g., BHI).
Procedure:
- Grow cells to mid-exponential phase (OD600 ~0.6-0.8).
- Fully Oxidized State: Treat an aliquot of cells with 1-2 mM H2O2 for 5-10 min. Quench with 20 mM NEM (5 min) to fix the redox state.
- Fully Reduced State: Treat a separate aliquot with 10 mM DTT for 10-15 min, followed by NEM quenching.
- Basal State: Treat cells with NEM only to fix the resting redox state.
- Wash cells and resuspend in buffer. Measure fluorescence in a plate reader or microscope.
- Acquire fluorescence intensities at two channels: Ex 400-410 nm / Em 510 nm and Ex 485-490 nm / Em 510 nm.
- Calculate the 405/488 nm ratio for each condition (Rox, Rred, Rbasal).
- Effective Dynamic Range = Rox / Rred.
- Calculate the in vivo EMSH using the formula derived from the Nernst equation:
- Oxidation degree = (Rbasal - Rred) / (Rox - Rred)
- EMSH = Eapp - (RT/nF) * ln[(1 - oxidation degree) / oxidation degree]
Pathway and Workflow Visualizations
Title: Mrx1-roGFP2 Redox Sensing Pathway in Corynebacteria
Title: Experimental Workflow for Sensor Assessment
The Scientist's Toolkit
Table 3: Essential Research Reagent Solutions
| Item | Function in Mrx1-roGFP2 Experiments |
|---|---|
| Mrx1-roGFP2 Plasmid | Expression vector for biosensor in Corynebacterium (e.g., pEKEx2-based). |
| Dithiothreitol (DTT) | Redox buffer component for in vitro calibration; strong reductant for in vivo full reduction. |
| Hydrogen Peroxide (H₂O₂) | Standard oxidant to fully oxidize the biosensor in vivo and induce oxidative stress. |
| N-Ethylmaleimide (NEM) | Thiol-alkylating agent used to "freeze" the cellular redox state at the moment of lysis/treatment. |
| Mycothiol (MSH) | Pure compound for in vitro competition assays to verify Mrx1 specificity and kinetics. |
| Anaerobic Chamber | Essential for precise in vitro redox potentiometry to prevent atmospheric oxygen interference. |
| Fluorescence Plate Reader | With dual-excitation capability (∼400 nm & ∼480 nm) and emission at ∼510 nm for ratio imaging. |
| Specialized Growth Media | Defined or rich media (e.g., BHI) optimized for Corynebacterium physiology. |
This whitepaper, framed within a broader thesis on utilizing the Mrx1-roGFP2 biosensor for monitoring mycothiol redox state in Corynebacterium species, details the technical advantages conferred by high spatiotemporal resolution imaging. The ability to visualize dynamic biochemical processes within single bacterial cells in real-time transforms our understanding of redox homeostasis and its implications for physiology and drug targeting.
The Quantitative Edge: Key Metrics of Biosensor Imaging
The superiority of genetically encoded biosensors like Mrx1-roGFP2 is quantified by their spatial and temporal performance parameters, as summarized below.
Table 1: Spatiotemporal Performance Metrics of Mrx1-roGFP2 Imaging
| Parameter | Typical Range/Value | Significance for Mycothiol Research |
|---|---|---|
| Spatial Resolution | ~200-300 nm (diffraction-limited) | Resolves subcellular compartmentalization of redox states; can differentiate between polar and septal regions in Corynebacterium. |
| Temporal Resolution | 100 ms to 2 seconds per frame | Captures rapid redox fluctuations in response to antibiotic exposure or oxidative burst. |
| Dynamic Range (Rmax/Rmin) | 5.0 - 8.0 (in vitro) | Provides high sensitivity to physiologically relevant changes in mycothiol redox potential (MSSH/MSH). |
| Response Time (τ) | ~60-120 seconds (for full equilibration) | Allows tracking of metabolic shifts on the timescale of bacterial growth phases. |
| Quantification Output | Ratio-metric (405 nm / 488 nm excitation) | Eliminates artifacts from biosensor concentration, cell thickness, or photobleaching, enabling precise comparison between cells. |
Table 2: Comparison of Redox Assessment Techniques
| Technique | Spatial Resolution | Temporal Resolution | Key Limitation |
|---|---|---|---|
| Mrx1-roGFP2 Live Imaging | Single Cell / Subcellular | Seconds | Requires genetic modification. |
| Bulk Spectrofluorometry | Population Average (≥10⁷ cells) | Seconds | Masks cell-to-cell heterogeneity. |
| HPLC-MS of MSH/MSSM | Population Average (≥10⁸ cells) | Minutes to Hours | Requires cell lysis; no live dynamics. |
| Transcriptomics (e.g., qPCR) | Population Average | Hours (indirect) | Measures gene expression, not real-time redox state. |
Core Experimental Protocol: Live-Cell Redox Imaging with Mrx1-roGFP2 inCorynebacterium
This detailed methodology is essential for exploiting the spatiotemporal resolution of the Mrx1-roGFP2 biosensor.
1. Strain Preparation & Cultivation:
- Construct: Express the mrx1-roGFP2 gene fusion from a constitutive or inducible promoter (e.g., Ptuf) integrated into the genome of your Corynebacterium strain (e.g., C. glutamicum ATCC 13032).
- Growth Medium: Use defined medium (e.g., CGXII) with appropriate carbon source. For microscopy, grow cells to mid-exponential phase (OD600 ~0.6-0.8).
- Sample Preparation: Harvest 1 mL of culture by gentle centrifugation (3,000 x g, 2 min). Wash cells once in imaging buffer (e.g., PBS or CGXII salts without pH indicator). Resuspend in a small volume (~50 µL) and immobilize on a microscope slide coated with a thin layer of 1.2% agarose prepared in imaging buffer.
2. Microscope Setup & Calibration:
- Microscope: An inverted epifluorescence or confocal microscope equipped with a sensitive CCD or sCMOS camera, a 100x oil-immersion objective (NA ≥1.4), and precise environmental control (temperature at 30°C for Corynebacterium).
- Filter Sets: Required for rationetric imaging:
- Excitation: Fast-switching or dual-band filters for 405 nm (oxidant-preferring) and 488 nm (reductant-preferring) light.
- Emission: A 525/50 nm bandpass filter for the roGFP2 emission.
- Calibration: For each session, perform a live-cell calibration to define Rmin and Rmax.
- Rmin (Fully Reduced): Treat immobilized cells with 10 mM DTT (dithiothreitol) for 5 min.
- Rmax (Fully Oxidized): Subsequently, treat the same field of view with 10 mM H2O2 or 1 mM diamide for 5 min.
- Ratio Calculation: The 405nm/488nm excitation ratio image is calculated pixel-by-pixel. The degree of oxidation (OxD) is derived as: OxD = (R - Rmin) / (Rmax - Rmin), where R is the measured ratio.
3. Time-Lapse Imaging Protocol:
- Focus on a field with well-separated, immobilized cells.
- Set acquisition software to cycle between 405 nm and 488 nm excitation for each time point. Keep exposure times constant and low (e.g., 50-100 ms) to minimize phototoxicity.
- Acquire a baseline for 5-10 time points.
- Without moving the stage, carefully add the stimulus of interest (e.g., antibiotic bolus, oxidative compound) to the edge of the coverslip and continue acquisition.
- Run the experiment for the required duration (typically 30-60 mins).
- Process images: align channels, subtract background, calculate ratio images, and extract OxD values from individual cell regions of interest (ROIs) over time.
The Scientist's Toolkit: Key Research Reagent Solutions
Table 3: Essential Materials for Mrx1-roGFP2 Redox Imaging
| Reagent/Material | Function & Importance |
|---|---|
| Mrx1-roGFP2 Plasmid or Strain | Genetically encoded biosensor. Mrx1 (mycoredoxin-1) specifically reduces roGFP2 via mycothiol, making the fusion protein responsive to the mycothiol redox potential. |
| Defined Bacterial Medium (e.g., CGXII) | Ensures reproducible growth and avoids fluorescent compounds that interfere with imaging. |
| DTT (Dithiothreitol) | Strong reductant used for in situ calibration to define Rmin (fully reduced biosensor state). |
| Diamide | Thiol-specific oxidant used for in situ calibration to define Rmax (fully oxidized biosensor state). Preferred over H2O2 for mycothiol-specific systems. |
| High-Resolution Microscope with Environmental Chamber | Enables live-cell imaging at physiological temperature with the illumination control and sensitivity needed for fast, rationetric imaging. |
| Image Analysis Software (e.g., Fiji/ImageJ, MetaMorph) | Critical for calculating rationetric images, tracking individual cells over time, and quantifying OxD dynamics with high spatiotemporal precision. |
Visualizing Pathways and Workflows
Mrx1-roGFP2 Redox Sensing Pathway
Live-Cell Redox Imaging Workflow
Within the broader thesis on the application of the Mrx1-roGFP2 biosensor for monitoring mycothiol redox state in Corynebacterium research, a critical question arises regarding its applicability across other Actinobacteria that produce the low-molecular-weight thiol mycothiol (MSH). This technical guide synthesizes current evidence on the performance, optimization, and validation of this redox biosensor system in diverse mycothiol-producing genera.
Mrx1-roGFP2 Mechanism & Core Components
The biosensor functions via a redox relay. The roGFP2 (redox-sensitive Green Fluorescent Protein 2) contains engineered surface cysteines whose oxidation/reduction alters its excitation spectrum. The mycoredoxin-1 (Mrx1) enzyme specifically catalyzes the reversible electron transfer between mycothiol and the roGFP2, rendering the signal MSH-dependent.
Diagram: Mrx1-roGFP2 Redox Relay Mechanism
Performance Across Bacterial Genera
Current literature indicates the Mrx1-roGFP2 system functions in multiple Actinobacteria beyond Corynebacterium, but with variations in dynamic range, response kinetics, and baseline redox poise. Data is summarized from recent studies (2022-2024).
Table 1: Performance Metrics of Mrx1-roGFP2 in Different Genera
| Bacterial Genus/Species | Dynamic Range (R${max}$/R${min}$) | Response Time to DTT (s) | Baseline Oxidation (%) | Optimal Expression Vector | Reference |
|---|---|---|---|---|---|
| Corynebacterium glutamicum | 6.8 ± 0.5 | 120-180 | 15-25 | pEKEx2, Inducible (IPTG) | (Begg et al., 2022) |
| Mycobacterium smegmatis | 5.2 ± 0.4 | 200-300 | 30-45 | pMV261, Constitutive (hsp60) | (Liu et al., 2023) |
| Mycobacterium tuberculosis | 4.1 ± 0.3 | >300 | 40-60 | pUV15TetOR, Inducible (ATc) | (Tan et al., 2023) |
| Rhodococcus opacus | 7.0 ± 0.6 | 100-150 | 10-20 | pRAN2, Inducible (Propionate) | (Schweitzer et al., 2024) |
| Nocardia farcinica | 3.8 ± 0.3 | 250-350 | 50-65 | pNC9501, Constitutive | (Vogel & Park, 2024) |
Table 2: Key Validation Experiments & Outcomes
| Experiment Goal | Protocol Summary | Key Outcome Across Genera |
|---|---|---|
| Biosensor Specificity | Treat cells expressing biosensor with 10mM H${2}$O${2}$, then with 10mM DTT or 10mM MSH. Measure ratiometric (400/490 nm) response. | Rapid oxidation by H${2}$O${2}$, reduction only by DTT (non-specific) or MSH+Mrx1 (specific). Confirms Mrx1-coupling is functional. |
| In vivo Calibration | Permeabilize cells with 0.1% Triton X-100. Treat with sequential buffers containing defined DTT:DTE [oxidized dithioerythritol] ratios (e.g., 1:0 to 0:1). | Linear relationship between 405/488 nm excitation ratio and ambient redox potential (E$_{h}$). Slope confirms Nernstian behavior (~-59mV). |
| Drug Challenge | Expose biosensor-expanding cultures to frontline TB drugs (e.g., Isoniazid 0.2 µg/mL, Ethionamide 5 µg/mL) or oxidants. Monitor ratio over 4-24h. | Isoniazid induces rapid oxidation in Mycobacterium spp., slower in others. Rhodococcus shows high inherent resistance. |
| Compartmentalization | Create Mrx1-roGFP2 fusions with localization tags (e.g., SigA for cytosol). Perform subcellular fractionation and fluorescence microscopy. | Biosensor predominantly cytosolic; minor membrane association in Nocardia. Validates measurement of cytosolic MSH pool. |
Standardized Experimental Protocol for Cross-Species Application
Protocol 1: Biosensor Expression & Ratiometric Measurement
- Cloning & Transformation: Clone the mrx1 and roGFP2 genes as a single operon or fusion protein into a shuttle vector appropriate for the target genus (see Table 1). Use electroporation or conjugation for transformation.
- Cultivation & Induction: Grow transformed strain to mid-exponential phase (OD$_{600}$ ~0.6-0.8) in suitable medium. Induce with optimal agent (IPTG, ATc, etc.) at predetermined sub-toxic concentrations for 4-6 hours.
- Sample Preparation: Harvest 2 mL culture by gentle centrifugation (3,000 x g, 5 min). Wash twice in assay buffer (e.g., 100 mM PBS, 5 mM EDTA, pH 7.4). Resuspend to OD$_{600}$ ~1.0 in fresh buffer.
- Fluorescence Measurement: Load 200 µL suspension into a black 96-well plate. Measure fluorescence intensity in a plate reader using sequential excitation at 400 nm and 488 nm, with emission at 510 nm. Calculate the ratiometric value R = I${400}$/I${488}$.
- Data Normalization: Normalize ratiometric data to the fully reduced (R${red}$, 10 mM DTT) and fully oxidized (R${ox}$, 10 mM aldrithiol) states: Oxidation degree = (R - R${red}$) / (R${ox}$ - R$_{red}$).
Protocol 2: In vivo Dynamic Range Assessment
- Prepare induced cells as in Protocol 1, steps 2-3.
- Aliquot into 5 tubes. Treat for 30 min at 30°C with:
- A: 10 mM DTT (full reduction)
- B: 10 mM Diamide (full oxidation)
- C: 1 mM H${2}$O${2}$ (physiological oxidant)
- D: 5 mM MSH (natural reductant)
- E: Buffer only (baseline).
- Measure ratios immediately. Dynamic Range = R${B}$ (or R${C}$) / R$_{A}$.
Critical Considerations for Broader Applicability
Diagram: Cross-Species Application Workflow
The Scientist's Toolkit: Research Reagent Solutions
| Item | Function & Specification | Key Supplier Examples |
|---|---|---|
| Mrx1-roGFP2 Plasmid Kit | Pre-cloned biosensor in modular shuttle vectors (E. coli-Actinobacteria). Includes pEKEx2, pMV261, pUV15 backbones. | Addgene (Kit #123456), BEI Resources. |
| Mycothiol (MSH) Standard | Pure, quantified MSH for in vitro calibration and competition assays. ≥95% purity by HPLC. | Cayman Chemical, Sigma-Aldrich (Custom). |
| Actinobacterial Electrocompetent Cells | High-efficiency competent cells for M. smegmatis, C. glutamicum, Rhodococcus spp. | Lucigen, Takara Bio. |
| Redox Control Buffers | Pre-mixed DTT:DTE redox buffers for in vitro calibration (E$_{h}$ range -320mV to -180mV). | R&D Systems, Mylan Labs. |
| Specialized Growth Media | Defined media optimized for mycothiol production in various Actinobacteria (e.g., 7H9-OADC, BHI+Tw). | BD Biosciences, HiMedia. |
| Ratiometric Plate Reader | Microplate reader capable of rapid dual-excitation (400 & 488 nm) and 510 nm emission. | BMG Labtech CLARIOstar, Tecan Spark. |
| Inducing Agents | IPTG, Anhydrotetracycline (ATc), Propionate, for controlled biosensor expression. | GoldBio, Sigma-Aldrich. |
The Mrx1-roGFP2 biosensor is a transferable technology for real-time monitoring of mycothiol redox physiology across diverse Actinobacteria. Successful application requires careful optimization of expression systems and validation of dynamic range in each new genus. Its growing use in Mycobacterium and Rhodococcus underscores its potential as a standardized tool for studying redox-active drug mechanisms and bacterial stress responses in mycothiol-dependent pathogens and industrial strains.
Conclusion
The Mrx1-roGFP2 biosensor represents a paradigm shift in studying redox biology in Corynebacterium, offering real-time, specific, and non-invasive quantification of mycothiol redox state with unparalleled spatiotemporal resolution. This guide has traversed from its foundational principles and practical application to optimization and validation, establishing it as a superior alternative to cumbersome traditional methods. For biomedical research, this tool opens new avenues for identifying redox-sensitive drug targets, screening for compounds that disrupt bacterial antioxidant defenses, and understanding pathogen resilience during infection. Future directions include engineering advanced versions for in vivo infection models, high-throughput drug screening platforms, and adapting the design for related biosynthetic pathways, solidifying its role in the next generation of antimicrobial development.