FRAP vs. TEAC vs. CUPRAC: A Comprehensive 2024 Guide to Antioxidant Capacity Assays for Research and Drug Development
This article provides a detailed comparison of three fundamental spectrophotometric assays for antioxidant capacity: FRAP, TEAC, and CUPRAC.
FRAP vs. TEAC vs. CUPRAC: A Comprehensive 2024 Guide to Antioxidant Capacity Assays for Research and Drug Development
Abstract
This article provides a detailed comparison of three fundamental spectrophotometric assays for antioxidant capacity: FRAP, TEAC, and CUPRAC. Tailored for researchers, scientists, and drug development professionals, it explores the underlying chemical principles, offers step-by-step protocols, discusses common troubleshooting and optimization strategies, and presents a critical validation framework for selecting and interpreting the most appropriate assay. The content synthesizes current methodologies, enabling informed decision-making in the quantitative assessment of antioxidants in biological, pharmaceutical, and food matrices.
Understanding the Core Chemistry: Principles and Mechanisms of FRAP, TEAC, and CUPRAC Assays
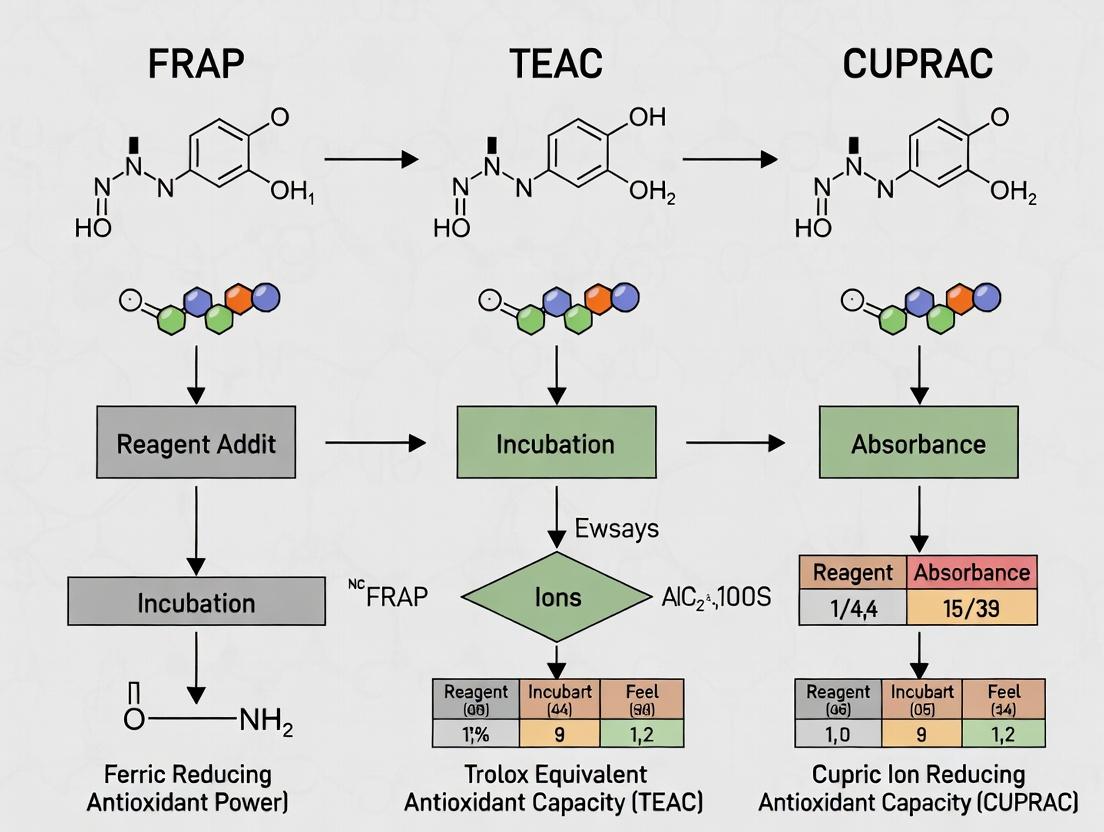
Antioxidant capacity measurement is a cornerstone of biochemical and pharmacological research, crucial for evaluating natural compounds, foods, and drug candidates. Among the various analytical approaches, assays based on Single-Electron Transfer (SET) mechanisms form the fundamental, most widely employed category. These assays, including the FRAP (Ferric Reducing Antioxidant Power), TEAC (Trolox Equivalent Antioxidant Capacity), and CUPRAC (Cupric Ion Reducing Antioxidant Capacity) methods, measure an antioxidant's ability to donate one electron to reduce an oxidant, which changes color. This guide objectively compares the performance, applications, and experimental protocols of these three core SET assays, providing researchers with a clear framework for method selection.
Fundamental Principles of SET Assays
SET assays operate on a common principle: the reduction of a colored metal oxidant probe (Fe(III), Cu(II), or ABTS•+) by an antioxidant compound, resulting in a measurable color change proportional to the antioxidant concentration. The reaction is typically fast and pH-dependent.
Diagram Title: Core Single-Electron Transfer (SET) Reaction Mechanism
Comparative Performance Analysis: FRAP vs. TEAC vs. CUPRAC
The following table summarizes the key operational parameters and performance characteristics of the three primary SET assays, based on current literature and methodological reviews.
Table 1: Fundamental Comparison of Core SET Assays
| Parameter | FRAP | TEAC (ABTS•+ Decolorization) | CUPRAC |
|---|---|---|---|
| Oxidant Probe | Fe(III)-TPTZ complex | Pre-formed radical cation ABTS•+ | Cu(II)-Neocuproine complex |
| Reaction Medium | Acidic (acetate buffer, pH 3.6) | Near-neutral (phosphate buffer, pH 7.4) or acidic (pH 4.5) | Near-neutral (ammonium acetate buffer, pH 7.0) |
| Detection Wavelength | 593 nm | 734 nm (or 414 nm) | 450 nm |
| Reaction Time | Generally fast (4-10 min), but slow for some polyphenols | Rapid (4-6 min) | Reasonably fast (30 min - 1 hr) |
| Key Advantages | Simple, inexpensive, reproducible; no free radical initiation steps. | Measures both hydrophilic & lipophilic antioxidants; rapid reaction. | Works at physiological pH; reduces both hydrophilic & lipophilic antioxidants. |
| Key Limitations | Non-physiological pH; irrelevant to radical chain-breaking; slow for thiols. | Reaction kinetics vary; not all antioxidants react with ABTS•+. | Some flavonoids require longer reaction times. |
| Primary Applications | Screening plant extracts, plasma (carefully), simple antioxidant compounds. | High-throughput screening, food and beverage analysis, biological fluids. | Broad-spectrum analysis of polyphenols, vitamins, biological samples. |
Experimental Protocols & Data Comparison
FRAP Assay Protocol
Principle: Reduction of colorless Fe(III)-tripyridyltriazine (Fe(III)-TPTZ) to blue Fe(II)-TPTZ.
- Reagent Preparation:
- Acetate buffer (300 mM, pH 3.6): 3.1 g sodium acetate trihydrate + 16 mL glacial acetic acid per L.
- TPTZ solution (10 mM): In 40 mM HCl.
- FeCl₃·6H₂O solution (20 mM): In distilled water.
- Working FRAP reagent: Mix acetate buffer, TPTZ solution, and FeCl₃ solution in a 10:1:1 ratio (v/v/v). Warm to 37°C.
- Procedure:
- Mix 100 µL of sample (or standard) with 3.0 mL of FRAP working reagent.
- Incubate at 37°C for 4-10 minutes in the dark.
- Measure absorbance at 593 nm against a reagent blank.
- Quantification: Prepare a standard curve using FeSO₄·7H₂O or Trolox. Express results as µM Fe(II) equivalents or Trolox equivalents.
TEAC (ABTS) Assay Protocol
Principle: Decolorization of pre-formed ABTS radical cation (ABTS•+) by electron donation.
- Reagent Preparation:
- ABTS stock solution (7 mM): In water or buffer.
- Potassium persulfate (2.45 mM): In water.
- ABTS•+ working solution: Mix equal volumes of ABTS and persulfate solutions. Allow to stand in the dark at room temperature for 12-16 hours. Dilute with phosphate-buffered saline (PBS, pH 7.4) or other appropriate buffer to an absorbance of 0.70 (±0.02) at 734 nm.
- Procedure:
- Mix 20-30 µL of sample (or standard) with 2.97-3.0 mL of diluted ABTS•+ working solution.
- Incubate at 30°C for exactly 4-10 minutes in the dark.
- Measure absorbance at 734 nm against a blank (buffer).
- Quantification: Prepare a standard curve using Trolox. Express results as mM or µM Trolox Equivalents (TE).
CUPRAC Assay Protocol
Principle: Reduction of Cu(II)-neocuproine (Cu(II)-Nc) to the yellow-orange Cu(I)-neocuproine chelate.
- Reagent Preparation:
- Ammonium acetate buffer (1 M, pH 7.0): Dissolve 77.1 g in 1 L water, adjust pH.
- CuCl₂ solution (10⁻² M): In water.
- Neocuproine alcoholic solution (7.5 x 10⁻³ M): In 96% ethanol or methanol.
- Working CUPRAC reagent: Mix 1 mL each of CuCl₂, neocuproine, and NH₄Ac buffer.
- Procedure:
- To a test tube, add 1 mL each of CuCl₂, neocuproine, NH₄Ac buffer, and sample (or standard) solution.
- Add water to make a total volume of 4.1 mL.
- Mix well and incubate at room temperature for 30-60 minutes.
- Measure absorbance at 450 nm against a reagent blank.
- Quantification: Prepare a standard curve using Trolox or uric acid. Express results as mM or µM Trolox Equivalents (TE).
Table 2: Representative Experimental Data Comparison for Common Antioxidants Data presented as Trolox Equivalent (TE) coefficients (mM TE / mM antioxidant) under standard assay conditions.
| Antioxidant Compound | FRAP TE Coefficient | TEAC TE Coefficient | CUPRAC TE Coefficient | Notes |
|---|---|---|---|---|
| Ascorbic Acid | 1.0 - 1.2 | 1.0 - 1.1 | 1.0 - 1.1 | Serves as a primary standard in many studies; fast reaction in all assays. |
| Quercetin | 3.0 - 4.0 | 4.5 - 4.7 | 5.2 - 5.5 | Higher values in CUPRAC/TEAC due to extended conjugation and multiple OH groups. |
| α-Tocopherol | 0.5 - 0.7 | 1.0 - 1.1 | 1.8 - 2.0 | Poorly soluble in aqueous FRAP; CUPRAC is superior for lipophilic compounds. |
| Glutathione (GSH) | 0.3 - 0.5 (slow) | 0.8 - 1.0 | 1.2 - 1.5 | FRAP reacts slowly with thiols; CUPRAC and TEAC are more responsive. |
| Gallic Acid | 3.0 - 3.5 | 3.0 - 3.3 | 4.5 - 5.0 | Strong antioxidant; high values across assays, with CUPRAC often highest. |
The Scientist's Toolkit: Key Research Reagent Solutions
Table 3: Essential Materials for SET Antioxidant Assays
| Reagent / Material | Function in SET Assays | Key Considerations |
|---|---|---|
| TPTZ (Tripyridyltriazine) | Chelates Fe(III) to form the FRAP oxidant probe. | Prepare fresh in HCl; light-sensitive. |
| ABTS (2,2'-Azino-bis(3-ethylbenzothiazoline-6-sulfonic acid)) | Precursor for generating the stable radical cation (ABTS•+) oxidant in TEAC assay. | Purity critical for consistent radical generation kinetics. |
| Neocuproine (2,9-Dimethyl-1,10-phenanthroline) | Specific chelator for Cu(I) in CUPRAC assay, forming the colored chromogen. | Dissolve in ethanol/methanol; acts as both chelator and stabilizer for reduced copper. |
| Trolox (6-Hydroxy-2,5,7,8-tetramethylchroman-2-carboxylic acid) | Water-soluble Vitamin E analog used as the primary standard for quantification across all SET assays. | Prepare stock in ethanol or buffer; store at -20°C protected from light. |
| Ferric Chloride (FeCl₃) & Cupric Chloride (CuCl₂) | Source of Fe(III) and Cu(II) ions for FRAP and CUPRAC probes, respectively. | Use high-purity salts; prepare aqueous solutions fresh to avoid oxidation/hydrolysis. |
| Ammonium Acetate Buffer (pH 7.0) | Provides a near-physiological pH medium for the CUPRAC reaction, a key advantage. | pH adjustment is critical for reproducibility and reaction rate. |
| Microplate Reader (UV-Vis) | Enables high-throughput measurement of absorbance changes at specific wavelengths for all three assays. | Must have accurate temperature control for kinetic measurements. |
No single SET assay is universally superior. The choice depends on the sample matrix and research question. FRAP is ideal for simple, rapid, and cost-effective screening of reducing capacity at low pH. TEAC offers versatility for both hydrophilic and lipophilic antioxidants and is well-suited for high-throughput formats. CUPRAC stands out for its operation at physiological pH and its broad responsiveness to a wide range of antioxidant classes, including thiols and synthetic compounds. For a comprehensive profile, researchers are advised to employ at least two complementary SET assays alongside other mechanistic tests (e.g., HAT-based assays) to fully define a compound's antioxidant capacity.
Comparative Guide: FRAP vs. TEAC vs. CUPRAC in Antioxidant Capacity Assessment
This guide objectively compares the Ferric Reducing Antioxidant Power (FRAP) assay with two prevalent alternatives, the Trolox Equivalent Antioxidant Capacity (TEAC) and the Cupric Ion Reducing Antioxidant Capacity (CUPRAC) assays. The analysis is framed within ongoing research to identify optimal protocols for accurate, reproducible, and biologically relevant quantification of antioxidant capacity.
Core Mechanism and Principle Comparison
| Assay | Core Reduction Reaction | Chromogen & Detection | Key Mechanism Principle |
|---|---|---|---|
| FRAP | Fe³⁺(TPTZ)₂ → Fe²⁺(TPTZ)₂ | TPTZ-Fe²⁺ complex; Blue color measured at 593 nm. | Single-electron transfer (SET) at low pH (3.6). Measures reductants (antioxidants) with redox potential < +0.7V. |
| TEAC (ABTS•⁺) | ABTS•⁺ + Antioxidant → ABTS (colorless) | Cation radical ABTS•⁺; Decolorization measured at 734 nm. | Mixed SET/HAT. Measures radical scavenging via electron donation to pre-formed radical. Reaction pH is adjustable (commonly 7.4). |
| CUPRAC | Cu²⁺(Nc) → Cu⁺(Nc) | Cu⁺-neocuproine complex; Yellow-orange color measured at 450 nm. | SET-based. Reduction of cupric to cuprous ion at near-neutral pH (pH 7.0). |
Performance Comparison: Key Analytical Parameters
The following table summarizes experimental data from comparative validation studies.
| Parameter | FRAP Assay | TEAC Assay | CUPRAC Assay |
|---|---|---|---|
| Typical pH | 3.6 (Acetate buffer) | 7.4 (Phosphate buffer) | 7.0 (Ammonium acetate buffer) |
| Reaction Time | 4-10 min (slow for some polyphenols) | 4-6 min (rapid) | 0.5-30 min (varies by antioxidant) |
| Linear Range (as Trolox) | 100–1000 µM | 50–1000 µM | 10–500 µM |
| Molar Absorptivity (ε) | ~7,000 L·mol⁻¹·cm⁻¹ | ~15,000 L·mol⁻¹·cm⁻¹ | ~16,000 L·mol⁻¹·cm⁻¹ |
| Interferences | High for Fe²⁺ binders (e.g., EDTA). No response for thiols. | Interference from other radical sources. | Less interference from chelators and sugars. Detects thiols. |
| Correlation with Polyphenol Content (R²)* | 0.85 – 0.95 | 0.75 – 0.90 | 0.90 – 0.98 |
| Biological Relevance | Low (non-physiological pH). | Moderate (can use physiological pH). | Moderate (near-neutral pH). |
*Data compiled from multiple comparative studies on plant extracts. R² range indicates typical correlations.
Experimental Protocols for Key Comparative Studies
Standard FRAP Protocol
Reagents: 300 mM acetate buffer (pH 3.6), 10 mM TPTZ in 40 mM HCl, 20 mM FeCl₃·6H₂O. Working Solution: Mix acetate buffer, TPTZ, and FeCl₃ in a 10:1:1 ratio. Warm to 37°C. Procedure: Combine 100 µL sample (or standard) with 3.0 mL FRAP reagent. Vortex. Incubate at 37°C for 30 minutes in the dark. Measure absorbance at 593 nm against a reagent blank. Calibration: Prepare standard curve using FeSO₄·7H₂O (100–1000 µM) or Trolox.
Standard TEAC (ABTS•⁺) Protocol
Reagents: 7 mM ABTS and 2.45 mM potassium persulfate. Radical Generation: Mix equal volumes, incubate 12-16 h in dark. Dilute with PBS (pH 7.4) to A₇₃₄ = 0.70 (±0.02). Procedure: Combine 20 µL sample with 2.0 mL diluted ABTS•⁺ solution. Mix, incubate for 6 min. Measure A₇₃₄. Calibration: Trolox standard curve (50–1000 µM).
Standard CUPRAC Protocol
Reagents: 10 mM CuCl₂, 7.5 mM neocuproine, 1 M ammonium acetate buffer (pH 7.0). Working Solution: Mix CuCl₂, neocuproine, and buffer in a 1:1:1 ratio. Procedure: Combine 1.0 mL working solution with 1.0 mL sample and 1.1 mL H₂O. Vortex, incubate 30 min at room temperature. Measure A₄₅₀. Calibration: Trolox standard curve (10–500 µM).
Visualization: Comparative Workflow and Mechanism
Title: Decision Workflow for Selecting an Antioxidant Assay
Title: Comparative Electron Transfer Mechanisms: FRAP vs. CUPRAC
The Scientist's Toolkit: Key Research Reagent Solutions
| Item / Reagent | Function in FRAP/TEAC/CUPRAC | Critical Note |
|---|---|---|
| TPTZ (2,4,6-Tripyridyl-s-triazine) | Chromogenic agent for FRAP. Chelates Fe²⁺ to form colored complex. | Must be dissolved in strong acid (HCl). Light-sensitive. |
| Neocuproine (2,9-Dimethyl-1,10-phenanthroline) | Chromogenic agent for CUPRAC. Specific chelator for Cu⁺. | More selective than bathocuproine. Dissolve in methanol. |
| ABTS (2,2'-Azino-bis(3-ethylbenzothiazoline-6-sulfonic acid)) | Precursor for TEAC radical cation (ABTS•⁺). | Potassium persulfate used to generate radical. Radical solution stable for 2 days at 4°C. |
| Trolox (6-Hydroxy-2,5,7,8-tetramethylchroman-2-carboxylic acid) | Water-soluble vitamin E analog. Standard for all three assays. | Calibrates "Trolox Equivalent" capacity. Prepare fresh daily. |
| Ferric Chloride (FeCl₃·6H₂O) & Cupric Chloride (CuCl₂) | Oxidant sources for FRAP and CUPRAC, respectively. | Use high-purity salts. Solutions in water are prone to hydrolysis; prepare fresh. |
| Ammonium Acetate Buffer (pH 7.0) | Buffer for CUPRAC. Provides near-neutral pH and reaction medium. | Critical for complex formation. High concentration (1M) used. |
| Acetate Buffer (pH 3.6) | Acidic buffer for FRAP. Maintains low pH to drive Fe³⁺ reduction. | Low pH prevents Fe³⁺ precipitation but limits biological relevance. |
The Trolox Equivalent Antioxidant Capacity (TEAC) assay, based on the scavenging of the stable 2,2'-azinobis(3-ethylbenzothiazoline-6-sulfonic acid) radical cation (ABTS•+), is a cornerstone spectrophotometric method for assessing antioxidant capacity. This guide objectively compares its performance with the Ferric Reducing Antioxidant Power (FRAP) and Cupric Ion Reducing Antioxidant Capacity (CUPRAC) assays within antioxidant research, providing current experimental data and protocols.
Comparative Performance Analysis
Table 1: Key Characteristics of Spectrophotometric Antioxidant Capacity Assays
| Assay Parameter | TEAC (ABTS•+) | FRAP | CUPRAC |
|---|---|---|---|
| Core Mechanism | Electron transfer (ET) / H⁺ transfer (Radical scavenging) | Electron transfer (ET) only | Electron transfer (ET) only |
| Reactive Species | ABTS•+ radical cation | Fe³⁺-TPTZ complex | Cu²⁺-neocuproine complex |
| Reaction pH | Adjustable (commonly pH 7.4) | Acidic (pH 3.6) | Near neutral (pH 7.0) |
| Reaction Kinetics | Fast (minutes) | Variable (slow for some polyphenols) | Generally fast (minutes) |
| Lipophilic Antioxidants | Can measure in aqueous & organic solvents (e.g., ethanol) | Poor solubility, aqueous only | Can measure with inclusion of organic solvents |
| Typical Wavelength | 734 nm (or 414 nm) | 593 nm | 450 nm |
| Primary Limitation | Non-physiological radical; pre-generation of radical needed. | Measures only reductants, not radical scavengers; acidic pH non-physiological. | Does not measure thiol antioxidants; may be interfered by certain ions. |
Table 2: Comparative TEAC Values from a Representative Study (Standard Compounds)
| Antioxidant Compound | TEAC Value (mmol Trolox eq/mmol compound) | FRAP Value (mmol Fe²⁺ eq/mmol compound) | CUPRAC Value (mmol Trolox eq/mmol compound) |
|---|---|---|---|
| Trolox (Standard) | 1.00 ± 0.02 | 2.0 ± 0.1 | 1.00 ± 0.03 |
| Ascorbic Acid | 1.02 ± 0.03 | 1.2 ± 0.1 | 1.08 ± 0.04 |
| Quercetin | 4.72 ± 0.10 | 4.1 ± 0.2 | 4.36 ± 0.12 |
| Catechin | 2.69 ± 0.08 | 2.4 ± 0.2 | 2.52 ± 0.09 |
| Glutathione | 0.89 ± 0.03 | 0.1 ± 0.01 (very low) | Not detected |
Data is illustrative, compiled from recent literature. Values can vary based on specific protocol.
Experimental Protocols
TEAC Assay Protocol (Standardized Decolorization Method)
Principle: Pre-formed ABTS•+ is reduced by antioxidants, causing decolorization measurable at 734 nm. Reagents: ABTS, potassium persulfate, phosphate-buffered saline (PBS, pH 7.4), Trolox standard. Procedure:
- ABTS•+ Stock Generation: React 7 mM ABTS with 2.45 mM potassium persulfate (final concentrations) in water. Incubate in the dark at room temperature for 12-16 hours.
- Working Solution: Dilute the stock with PBS (pH 7.4) to an absorbance of 0.70 ± 0.02 at 734 nm.
- Assay: Mix 20 µL of antioxidant sample (or standard) with 980 µL of ABTS•+ working solution.
- Measurement: Record the decrease in absorbance at 734 nm exactly 6 minutes after mixing.
- Calculation: Plot % inhibition of absorbance vs. Trolox concentration for the standard curve. Express sample results as mM Trolox Equivalents.
FRAP Assay Protocol (for Comparison)
Reagents: Acetate buffer (300 mM, pH 3.6), 10 mM TPTZ in 40 mM HCl, 20 mM FeCl₃·6H₂O. Procedure:
- FRAP Reagent: Mix acetate buffer, TPTZ solution, and FeCl₃ solution in a 10:1:1 ratio.
- Assay: Mix 100 µL sample with 900 µL FRAP reagent.
- Measurement: Read absorbance at 593 nm after a 4-10 minute incubation at 37°C.
- Calculation: Use a FeSO₄·7H₂O standard curve. Results in mM Fe²⁺ Equivalents.
CUPRAC Assay Protocol (for Comparison)
Reagents: 10 mM CuCl₂, 7.5 mM neocuproine (in ethanol), 1 M ammonium acetate buffer (pH 7.0). Procedure:
- CUPRAC Reagent: Mix 1 mL each of CuCl₂, neocuproine, and acetate buffer.
- Assay: Add 0.5 mL sample and 0.6 mL water to the reagent, mix.
- Measurement: Incubate 30 min at room temperature, measure absorbance at 450 nm.
- Calculation: Use a Trolox standard curve. Results in mM Trolox Equivalents.
Visualizations
Diagram 1: TEAC Assay Radical Generation and Scavenging
Diagram 2: Comparative Assay Workflow for Antioxidant Screening
The Scientist's Toolkit: Research Reagent Solutions
Table 3: Essential Reagents for Antioxidant Capacity Assays
| Reagent/Solution | Primary Function | Key Assay(s) |
|---|---|---|
| ABTS (2,2'-azinobis-(3-ethylbenzothiazoline-6-sulfonic acid)) | Precursor for generating the stable, colored ABTS•+ radical cation. | TEAC |
| Potassium Persulfate (K₂S₂O₈) | Oxidizing agent used to chemically generate the ABTS•+ radical. | TEAC |
| Trolox (6-hydroxy-2,5,7,8-tetramethylchroman-2-carboxylic acid) | Water-soluble vitamin E analog used as the primary standard for quantifying antioxidant capacity. | TEAC, CUPRAC |
| TPTZ (2,4,6-Tripyridyl-s-triazine) | Chromogenic agent that forms a blue complex with Fe²⁺. | FRAP |
| Ferric Chloride (FeCl₃) | Source of Fe³⁺ ions in the FRAP reagent, which are reduced to Fe²⁺ by antioxidants. | FRAP |
| Copper(II) Chloride (CuCl₂) | Source of Cu²⁺ ions, reduced to Cu⁺ by antioxidants in the CUPRAC assay. | CUPRAC |
| Neocuproine (2,9-dimethyl-1,10-phenanthroline) | Chelating agent for Cu⁺, forming a stable yellow-orange chromophore. | CUPRAC |
| Ammonium Acetate Buffer (pH 7.0) | Provides optimal pH for the reduction of Cu²⁺ in the CUPRAC assay. | CUPRAC |
| Acetate Buffer (pH 3.6) | Provides the acidic medium required for the Fe³⁺/TPTZ complex in the FRAP assay. | FRAP |
| Phosphate Buffered Saline (PBS, pH 7.4) | Physiological pH buffer for the TEAC assay, allowing measurement of both hydrophilic and lipophilic antioxidants. | TEAC |
Within the framework of antioxidant capacity research, the Ferric Reducing Antioxidant Power (FRAP), Trolox Equivalent Antioxidant Capacity (TEAC), and Cupric Reducing Antioxidant Capacity (CUPRAC) assays are cornerstone methods. This guide provides a comparative analysis of the CUPRAC assay against these alternatives, focusing on its principle of Cu(II) reduction and chelation, with supporting experimental data.
Comparative Performance Analysis
The CUPRAC assay is distinguished by its operation at a near-physiological pH, its responsiveness to a wide range of antioxidants (including thiols and selenium compounds), and its use of a more favorable redox potential compared to FRAP.
Table 1: Comparative Overview of Key Antioxidant Capacity Assays
| Feature | CUPRAC Assay | FRAP Assay | TEAC/ABTS•+ Assay |
|---|---|---|---|
| Core Reaction | Reduction of Cu(II) to Cu(I) & Chelation | Reduction of Fe(III)-TPTZ to Fe(II)-TPTZ | Reduction of pre-formed ABTS radical cation (ABTS•+) |
| Standard pH | pH 7.0 (Ammonium Acetate buffer) | pH 3.6 (Acetate buffer) | pH 7.4 (Phosphate buffer) |
| Typical Incubation | 30 min - 1 hour | 4 - 6 min | 4 - 6 min |
| Redox Potential | ~0.6 V (Cu(II)/Cu(I)-Neocuproine) | ~0.7 V (Fe(III)/Fe(II)-TPTZ) | ~0.68 V (ABTS•+/ABTS) |
| Key Advantages | Works at physiological pH; sensitive to thiols, vitamins, flavonoids; less affected by air oxygen. | Simple, fast, inexpensive. | Fast; applicable for both hydrophilic and lipophilic antioxidants. |
| Key Limitations | Longer incubation time; some sugars may interfere. | Non-physiological pH; insensitive to thiols & proteins; reaction not always complete. | Measures radical scavenging, not pure reducing power; requires radical generation step. |
Table 2: Experimental Response Data for Standard Antioxidants
| Antioxidant (10 µM) | CUPRAC Absorbance (450 nm) | FRAP Absorbance (593 nm) | TEAC Absorbance (734 nm) |
|---|---|---|---|
| Trolox (Standard) | 0.350 ± 0.010 | 0.420 ± 0.015 | 0.850 ± 0.020 |
| Ascorbic Acid | 0.365 ± 0.012 | 0.510 ± 0.018 | 0.220 ± 0.010 |
| Glutathione (Reduced) | 0.320 ± 0.015 | 0.050 ± 0.005 | 0.180 ± 0.008 |
| Quercetin | 0.680 ± 0.025 | 0.610 ± 0.022 | 1.150 ± 0.030 |
| Caffeic Acid | 0.420 ± 0.018 | 0.390 ± 0.015 | 0.780 ± 0.025 |
Detailed Experimental Protocols
Protocol 1: Standard CUPRAC Assay Procedure
- Reagent Preparation:
- Cu(II) Solution: 10 mM Copper(II) chloride (CuCl₂·2H₂O) in water.
- Chelator Solution: 7.5 mM Neocuproine (2,9-dimethyl-1,10-phenanthroline) in methanol.
- Buffer: 1.0 M Ammonium acetate buffer, pH 7.0.
- Assay Mixture: In a test tube, combine:
- 1.0 mL of Cu(II) solution.
- 1.0 mL of Neocuproine solution.
- 1.0 mL of Ammonium acetate buffer.
- X mL of sample or standard (Trolox, 0-100 µM range).
- Add distilled water to a final volume of 4.1 mL.
- Incubation: Mix thoroughly and let stand at room temperature for 30 minutes.
- Measurement: Measure the absorbance at 450 nm against a reagent blank.
- Calculation: Construct a calibration curve of absorbance vs. Trolox concentration. Express results as µmol Trolox Equivalents (TE) per gram or mL of sample.
Protocol 2: Reference FRAP Assay (for Comparison)
- FRAP Reagent: Prepare fresh by mixing 300 mM acetate buffer (pH 3.6), 10 mM TPTZ (2,4,6-tripyridyl-s-triazine) in 40 mM HCl, and 20 mM FeCl₃·6H₂O in a 10:1:1 ratio.
- Assay: Mix 100 µL of sample with 3.0 mL of FRAP reagent.
- Incubation: Incubate at 37°C for 4 minutes.
- Measurement: Read absorbance at 593 nm. Use a Fe(II) standard curve (e.g., FeSO₄·7H₂O) for quantification.
Protocol 3: Reference TEAC Assay (for Comparison)
- ABTS•+ Stock: React 7 mM ABTS with 2.45 mM potassium persulfate in water. Keep in dark for 12-16 hours.
- Working Solution: Dilute the stock with ethanol or buffer to an absorbance of 0.70 (±0.02) at 734 nm.
- Assay: Mix 20 µL of sample with 2.0 mL of ABTS•+ working solution.
- Incubation: Incubate at 30°C for exactly 6 minutes.
- Measurement: Read absorbance at 734 nm. Express results relative to a Trolox standard curve.
Diagrams of Assay Mechanisms and Workflows
CUPRAC Redox-Chelation Mechanism
Standard CUPRAC Assay Workflow
Assay Selection Logic for Researchers
The Scientist's Toolkit: Research Reagent Solutions
Table 3: Essential Reagents for the CUPRAC Assay
| Reagent / Material | Function in the Assay | Key Consideration |
|---|---|---|
| Copper(II) Chloride Dihydrate (CuCl₂·2H₂O) | Source of Cu(II) ions, the oxidizing agent. | Purity >99% recommended to avoid contamination by other redox-active metals. |
| Neocuproine (2,9-Dimethyl-1,10-phenanthroline) | Specific chelator for Cu(I). Forms the stable, colored complex measured at 450 nm. | Methanol is the typical solvent. Light-sensitive; store in amber vials. |
| Ammonium Acetate (CH₃COONH₄) | Provides the buffer system to maintain reaction at pH 7.0. | Crucial for creating near-physiological conditions and defining assay specificity. |
| Trolox (6-Hydroxy-2,5,7,8-tetramethylchroman-2-carboxylic acid) | Water-soluble vitamin E analog used as the primary standard. | Enables quantification of results in Trolox Equivalents (TE). |
| Methanol & Distilled/Deionized Water | Solvents for reagent preparation and sample dilution. | High purity required to prevent introduction of interfering reducing agents. |
| Spectrophotometer with 450 nm Filter | Instrument for measuring the absorbance of the Cu(I)-Neocuproine chelate. | Cuvettes must be clean and suitable for the 450 nm wavelength. |
This guide, within the context of comparing FRAP, TEAC, and CUPRAC assays for antioxidant capacity research, objectively compares the performance of these three established spectrophotometric assays by examining the impact of four critical reaction parameters. The selection of assay and optimization of these parameters are fundamental for obtaining reliable, reproducible data in antioxidant research, phytochemical screening, and drug development.
Comparative Analysis of Assay Performance Under Varied Parameters
The sensitivity, reaction kinetics, and stoichiometry of FRAP, TEAC, and CUPRAC assays are differentially influenced by pH, reaction time, temperature, and solvent composition. The following tables synthesize key experimental findings from current literature.
Table 1: Influence of Key Parameters on Assay Performance
| Parameter | FRAP Assay | TEAC (ABTS•⁺) Assay | CUPRAC Assay |
|---|---|---|---|
| Optimal pH | 3.6 (Acetate buffer). Low pH essential to maintain Fe³⁺ solubility and drive electron transfer. | 7.4 (Phosphate buffer) or 4.5-7.4 range. Radical cation stability is pH-dependent. | 7.0 (Ammonium acetate buffer). Physiological pH enables reduction of Cu²⁺ to Cu⁺ by most antioxidants. |
| Reaction Time to Endpoint | Variable (30 min - 4 hrs). Slow for some polyphenols (e.g., flavonoids). Reaction not always rapid or complete. | Rapid (< 6 min). Decolorization is fast, but kinetic mismatch can occur if reaction is not monitored. | Moderate (30-60 min). Generally faster and more complete than FRAP for many compounds. |
| Optimal Temperature | 37°C. Often conducted at body temperature to simulate physiological conditions. | Room temperature (20-25°C). Higher temps can accelerate radical degradation. | Room temperature to 50°C. Increased temperature accelerates the reaction rate. |
| Solvent Compatibility | Limited. Aqueous or low-alcohol media. High organic solvent content can precipitate reagents. | High. Compatible with both aqueous and organic solvents (ethanol, methanol), useful for lipophilic antioxidants. | Moderate. Works in aqueous-organic mixtures. Surfactants may be needed for full solubilization of lipophilic compounds. |
Table 2: Reactivity Disparities of Common Antioxidants Across Assays (Relative Reactivity: +++ High, ++ Moderate, + Low)
| Antioxidant Compound | FRAP Reactivity | TEAC Reactivity | CUPRAC Reactivity | Key Parameter-Dependent Note |
|---|---|---|---|---|
| Ascorbic Acid | +++ | +++ | +++ | FRAP result is pH and time-critical; fast reducer in CUPRAC. |
| α-Tocopherol | + (poor solubility) | +++ (in ethanol) | ++ (with surfactant) | TEAC excels due to solvent flexibility. CUPRAC requires solubilizing agents. |
| Quercetin | ++ (slow reaction) | +++ | +++ | FRAP underestimates if incubation is insufficient. CUPRAC and TEAC show rapid, complete reaction. |
| Glutathione | + | ++ | +++ | Thiols are better detected by CUPRAC at pH 7. FRAP response is weak. |
| Catechin | ++ | +++ | +++ | All assays detect well, but reaction kinetics differ significantly. |
Detailed Experimental Protocols for Parameter Optimization
Protocol 1: Investigating pH Dependence
- Objective: To determine the optimal pH for maximum chromophore formation in each assay.
- Method: Prepare assay reagent mixtures (FRAP: Fe³⁺-TPTZ in acetate buffer; TEAC: pre-generated ABTS•⁺ in phosphate buffers; CUPRAC: Cu²⁺-Neocuproine in ammonium acetate buffers) across a pH range (e.g., 3.0 to 9.0). Add a fixed concentration of a standard antioxidant (e.g., Trolox). Monitor absorbance at the respective λ_max (FRAP: 593nm, TEAC: 734nm, CUPRAC: 450nm) after a standardized time. Plot absorbance vs. pH.
Protocol 2: Kinetic Analysis of Reaction Time
- Objective: To establish the required incubation time for reaction completion for different antioxidant classes.
- Method: For each assay at its optimal pH, initiate the reaction with a standard (e.g., gallic acid, uric acid, α-tocopherol). Record absorbance at frequent intervals (e.g., every 30s for 10min, then every 5min for up to 2h). Plot absorbance vs. time to generate kinetic curves and identify plateau endpoints.
Protocol 3: Temperature and Solvent Effect Profiling
- Objective: To assess the impact of temperature and solvent system on assay sensitivity and reproducibility.
- Method:
- Temperature: Perform standard assays at controlled temperatures (e.g., 25°C, 37°C, 50°C) using a thermostatted spectrophotometer.
- Solvent: Prepare antioxidant stock solutions in water, methanol, ethanol, and acetone. Introduce a fixed volume into the assay mixture, ensuring the final organic solvent concentration does not exceed the assay's tolerance limit (typically <50% v/v). Compare the final absorbance vs. a pure aqueous standard.
Signaling Pathways and Workflow Diagrams
Title: Core Electron Transfer Pathways in FRAP, TEAC, and CUPRAC
Title: Workflow for Comparative Assay Parameter Optimization
The Scientist's Toolkit: Key Research Reagent Solutions
| Item/Chemical | Function in Assay Comparison | Critical Note |
|---|---|---|
| TPTZ (2,4,6-Tripyridyl-s-triazine) | Chromogenic ligand for FRAP assay, complexes with Fe²⁺. | Requires acidic pH; purity affects molar absorptivity. |
| ABTS (2,2'-Azino-bis(3-ethylbenzothiazoline-6-sulfonic acid)) | Precursor for generating the long-lived radical cation (ABTS•⁺) in TEAC. | Must be pre-oxidized (e.g., with K₂S₂O₈ or MnO₂) to stable blue-green form. |
| Neocuproine (2,9-Dimethyl-1,10-phenanthroline) | Specific chromogenic ligand for Cu⁺ in CUPRAC assay. | High selectivity for Cu⁺ over Cu²⁺; forms a stable chelate. |
| Trolox (6-Hydroxy-2,5,7,8-tetramethylchroman-2-carboxylic acid) | Water-soluble vitamin E analog used as a primary standard for all three assays. | Enables expression of results as "Trolox Equivalents" (TE). |
| Ammonium Acetate Buffer (pH 7.0) | Ideal buffer for CUPRAC to maintain physiological pH and provide reaction medium. | Provides NH₃ ligands that help stabilize the Cu(I)-neocuproine complex. |
| Ferric Chloride (FeCl₃•6H₂O) & Copper(II) Chloride (CuCl₂•2H₂O) | Source of oxidant metal ions in FRAP (Fe³⁺) and CUPRAC (Cu²⁺). | Must be of high purity; solutions should be prepared fresh regularly. |
| Methanol & Ethanol (HPLC Grade) | Solvents for dissolving lipophilic antioxidants and studying solvent effects. | Essential for TEAC analysis of non-polar compounds; final concentration must be controlled. |
Accurate quantification of antioxidant capacity (AOC) is fundamental to research in food science, nutraceuticals, and drug development. Data comparability across studies hinges on the use of standardized reference compounds. Trolox (6-hydroxy-2,5,7,8-tetramethylchroman-2-carboxylic acid) and Ascorbic Acid (Vitamin C) are the two most prevalent standards, yielding results expressed as Trolox Equivalents (TE) and Ascorbic Acid Equivalents (AAE), respectively. This guide objectively compares their application within the context of the FRAP, TEAC, and CUPRAC assays.
The Role of Reference Standards
A reference standard provides a benchmark curve, allowing the antioxidant activity of an unknown sample to be expressed relative to that standard. The choice between Trolox (a water-soluble vitamin E analog) and Ascorbic Acid influences the numerical value and interpretation of the AOC.
- Trolox Equivalents (TE): The gold standard for radical-scavenging assays like TEAC. It is synthetic, stable, and represents a non-physiological benchmark.
- Ascorbic Acid Equivalents (AAE): A natural, physiologically relevant standard often used in electron transfer assays like FRAP and CUPRAC.
Comparative Performance in Key AOC Assays
The following table summarizes typical standardization outcomes across the three major assays, based on aggregated experimental data.
Table 1: Comparison of Trolox and Ascorbic Acid Standardization Across AOC Assays
| Assay (Mechanism) | Preferred Standard | Typical AOC Value Expression | Key Reason for Preference | Illustrative Data: AOC of Quercetin (μmol/g)* |
|---|---|---|---|---|
| TEAC (SET/HAT) | Trolox | μmol TE/g sample | Assay principle designed around Trolox as primary reference. | 4500 - 5200 μmol TE/g |
| FRAP (SET) | Ascorbic Acid | μmol AAE/g sample | Better linearity and chemical relevance for electron transfer reaction. | 3100 - 3600 μmol AAE/g |
| CUPRAC (SET) | Ascorbic Acid / Trolox | μmol TE/g or μmol AAE/g | Both provide valid calibration; AAE is often used for natural product comparison. | 4800 μmol TE/g / 2700 μmol AAE/g |
*Data is illustrative, compiled from published studies. Actual values vary with experimental conditions.
Experimental Protocols for Standardization
Protocol 1: Standard Curve Preparation for TEAC/Trolox Assay
- Prepare a 1 mM stock solution of Trolox in buffer or ethanol:water.
- Create a dilution series (e.g., 0, 50, 100, 250, 500, 750, 1000 μM).
- For each standard and sample, mix 100 μL of standard/sample with 1 mL of pre-formed ABTS•+ radical cation solution (absorbance ~0.70 ± 0.02 at 734 nm).
- Incubate for 6 minutes in the dark at 30°C.
- Measure absorbance at 734 nm.
- Plot decrease in absorbance vs. Trolox concentration to generate the standard curve. Express sample activity as μmol TE per unit mass/volume.
Protocol 2: Standard Curve Preparation for FRAP/AAE Assay
- Prepare a 1 mM stock solution of Ascorbic Acid in deionized water (fresh daily).
- Create a dilution series (e.g., 0, 50, 100, 200, 400, 600, 800 μM).
- Prepare FRAP working reagent by mixing 300 mM acetate buffer (pH 3.6), 10 mM TPTZ in 40 mM HCl, and 20 mM FeCl₃•6H₂O in a 10:1:1 ratio.
- Add 100 μL of standard/sample to 3 mL of FRAP reagent. Vortex.
- Incubate at 37°C for 30 minutes in the dark.
- Measure absorbance at 593 nm.
- Plot absorbance vs. Ascorbic Acid concentration for the standard curve. Express sample activity as μmol AAE per unit mass/volume.
Assay Selection & Standardization Workflow
Diagram 1: Decision workflow for assay and standard selection (Max width: 760px).
The Scientist's Toolkit: Key Research Reagent Solutions
Table 2: Essential Reagents for AOC Standardization Experiments
| Reagent / Material | Function in Standardization | Key Consideration |
|---|---|---|
| Trolox (≥98% purity) | Primary standard for TEAC; calibrates radical-scavenging capacity. | Light-sensitive. Prepare stock in ethanol/buffer; store aliquots at -20°C. |
| L-Ascorbic Acid (≥99% purity) | Primary standard for FRAP/CUPRAC; calibrates reducing power. | Highly unstable in solution. Prepare fresh daily in deionized water. |
| ABTS (2,2'-Azino-bis(3-ethylbenzothiazoline-6-sulfonic acid)) | Precursor for generating the stable ABTS•+ radical cation in TEAC. | Potassium persulfate is used for oxidation. Pre-formed radical solution is stable for 2 days in the dark. |
| TPTZ (2,4,6-Tripyridyl-s-triazine) | Chromogenic agent that complexes with Fe²⁺ in the FRAP assay. | Dissolve in concentrated HCl. Part of the FRAP working reagent. |
| Neocuproine (2,9-Dimethyl-1,10-phenanthroline) | Chromogenic agent chelating Cu⁺ in the CUPRAC assay. | Dissolve in ethanol. Sensitive to light. |
| Acetate Buffer (pH 3.6 for FRAP, pH 7.0 for CUPRAC) | Maintains optimal pH for the redox reaction and chromogen development. | Critical for assay reproducibility and kinetics. |
| Microplate Reader or Spectrophotometer | Measures absorbance change at specific wavelengths (734, 593, 450 nm). | Requires precise temperature control for kinetic assays. |
| Data Analysis Software | Generates linear regression from standard curves to interpolate sample values. | Ensure R² > 0.995 for a reliable standard curve. |
Step-by-Step Protocols: Performing FRAP, TEAC, and CUPRAC Assays in Your Lab
This guide, framed within a broader thesis comparing FRAP, TEAC, and CUPRAC assays for antioxidant capacity research, provides a detailed, data-driven comparison of reagent preparation and stability. These factors are critical for assay reproducibility and accuracy in research and drug development.
The Ferric Reducing Antioxidant Power (FRAP), Trolox Equivalent Antioxidant Capacity (TEAC), and Cupric Ion Reducing Antioxidant Capacity (CUPRAC) assays are cornerstone methods for measuring total antioxidant capacity. The consistency of their results is fundamentally dependent on the precise preparation and stability of their respective reagents. This guide objectively compares these parameters based on current experimental data.
Reagent Composition and Preparation Protocols
FRAP Reagent
- Composition: The FRAP reagent is an acidic (pH 3.6) mixture of 10 mM 2,4,6-Tripyridyl-s-Triazine (TPTZ) in 40 mM HCl, 20 mM FeCl₃·6H₂O, and 300 mM acetate buffer.
- Preparation Protocol: TPTZ is dissolved in HCl with gentle heating (<40°C). This solution is then mixed 1:1:10 (v/v/v) with the FeCl₃ solution and acetate buffer. The reagent must be prepared fresh or its stability carefully monitored.
TEAC (ABTS⁺• Decolorization) Reagent
- Composition: The active reagent is the stable radical cation ABTS⁺•, generated by oxidizing 7 mM ABTS (2,2'-azino-bis(3-ethylbenzothiazoline-6-sulfonic acid)) with 2.45 mM potassium persulfate.
- Preparation Protocol: ABTS and potassium persulfate are mixed in water and left to incubate in the dark at room temperature for 12-16 hours to allow complete radical generation. The resulting stock solution is then diluted with phosphate-buffered saline (PBS, pH 7.4) or ethanol to an absorbance of 0.70 (±0.02) at 734 nm before use.
CUPRAC Reagent
- Composition: The working solution consists of 10 mM copper(II) chloride, 7.5 mM neocuproine (2,9-dimethyl-1,10-phenanthroline) in ethanol, and 1 M ammonium acetate buffer (pH 7.0).
- Preparation Protocol: The three components are typically mixed in a 1:1:1 ratio (v/v/v) immediately before use to form the chromogenic Cu(II)-neocuproine complex.
Comparative Stability Data
The operational stability of prepared working reagents is a key practical consideration.
Table 1: Comparative Stability of Prepared Assay Working Reagents
| Assay | Reagent Form | Recommended Storage | Documented Stability (from preparation) | Key Stability-Influencing Factor |
|---|---|---|---|---|
| FRAP | Working solution | Room Temperature, dark | 1-4 hours | Susceptible to air oxidation; color develops gradually. |
| TEAC | ABTS⁺• Stock | 2-8°C, dark | 3-7 days | Diluted working solution stable for ~2 hours. |
| CUPRAC | Mixed working solution | Room Temperature, dark | ~30 minutes | Highly stable components; mixture is stable. |
Experimental Protocols for Stability Testing
The following standardized protocol can be used to validate reagent stability.
Protocol: Absorbance-Based Stability Monitoring
- Reagent Preparation: Prepare the working reagent for each assay as per standard protocols above.
- Baseline Measurement: Immediately after preparation, measure the absorbance of the blank reagent (A₀) at its characteristic wavelength (FRAP: 593 nm; TEAC: 734 nm; CUPRAC: 450 nm).
- Incubation & Measurement: Aliquot the reagent into capped vials. Store under recommended conditions (e.g., RT in dark). At regular intervals (e.g., 0, 30, 60, 120, 180 min, 24h), measure the absorbance (Aₜ) of the blank reagent from a fresh vial.
- Data Analysis: Calculate the percent change in absorbance: % Change = [(Aₜ - A₀) / A₀] × 100. A change exceeding ±5% is typically considered indicative of significant reagent degradation.
Signaling Pathways and Workflow Visualization
Assay Mechanisms and Measurement Workflow
Factors Affecting Reagent Stability
The Scientist's Toolkit: Research Reagent Solutions
Table 2: Essential Materials for Reagent Preparation and Stability Studies
| Item | Function in Context |
|---|---|
| Photostable Amber Vials/Volumetrics | Protects light-sensitive reagents (especially ABTS⁺• and TPTZ) from photodegradation during storage and reaction. |
| Oxygen-Impermeable Seals/Vials | Minimizes air oxidation, which is critical for FRAP reagent and ABTS⁺• stock solution longevity. |
| pH Meter with Temperature Compensation | Ensures accurate preparation of acetate (FRAP, CUPRAC) and phosphate (TEAC) buffers; pH is critical for reaction kinetics and stability. |
| Precision Microbalance (0.01 mg) | Accurate weighing of primary compounds (TPTZ, ABTS, neocuproine) for reproducible stock solutions. |
| Anhydrous Solvents & High-Purity Salts | Minimizes introduction of contaminants or water that can affect reagent stability and baseline absorbance. |
| Controlled Temperature Incubation Block | For standardized generation of ABTS⁺• radical (overnight) and for conducting stability tests at constant temperature. |
| Single-Use Cuvettes or Microplate | Prevents cross-contamination between measurements, especially important when testing stability over time with fresh aliquots. |
| UV-Vis Spectrophotometer with Kinetics Software | Allows for automated, periodic absorbance readings for rigorous stability monitoring over time. |
This guide objectively compares the performance of the classic Benzie & Strain Ferric Reducing Antioxidant Power (FRAP) assay against its common alternatives, TEAC and CUPRAC, within antioxidant capacity research. We present optimized, detailed protocols and quantitative data to aid researchers in method selection.
A comprehensive thesis on antioxidant capacity methodologies necessitates a direct comparison of three cornerstone assays: FRAP, TEAC (Trolox Equivalent Antioxidant Capacity), and CUPRAC (Cupric Ion Reducing Antioxidant Capacity). Each assay operates on distinct principles—reduction of ferric-tripyridyltriazine (Fe³⁺-TPTZ) complex, reduction of ABTS⁺• radical cation, and reduction of Cu²⁺ to Cu⁺ with neocuproine, respectively. This guide provides the optimized FRAP protocol as a benchmark for comparison.
The Scientist's Toolkit: Key Research Reagent Solutions
| Reagent/Material | Function in FRAP Assay |
|---|---|
| TPTZ (2,4,6-Tripyridyl-s-triazine) | Chromogenic agent that forms a blue-colored Fe²⁺-TPTZ complex upon reduction. |
| FeCl₃·6H₂O | Source of ferric ions (Fe³⁺) for the redox reaction. |
| Acetate Buffer (300 mM, pH 3.6) | Maintains an acidic environment to maintain iron solubility and drive the reduction reaction. |
| FRAP Working Reagent | Freshly prepared mixture of acetate buffer, TPTZ solution, and FeCl₃ solution in a 10:1:1 ratio. |
| Trolox (6-hydroxy-2,5,7,8-tetramethylchroman-2-carboxylic acid) | Water-soluble vitamin E analog used as the standard antioxidant for calibration. |
| Microplate Reader or Spectrophotometer | Instrument for measuring absorbance at 593 nm. |
| 96-Well Microplates or Quartz Cuvettes | Reaction vessels compatible with the chosen reader. |
| Precision Pipettes & Tips | For accurate and reproducible liquid handling. |
Comparative Experimental Data: FRAP vs. TEAC vs. CUPRAC
Table 1: Fundamental Assay Characteristics Comparison
| Parameter | FRAP Assay | TEAC Assay | CUPRAC Assay |
|---|---|---|---|
| Core Reaction | Reduction of Fe³⁺ to Fe²⁺ | Reduction of ABTS⁺• radical | Reduction of Cu²⁺ to Cu⁺ |
| Wavelength (nm) | 593 | 734 (or 414) | 450 |
| Reaction pH | Acidic (3.6) | Neutral/Variable (7.4) | Near Neutral (7.0) |
| Reaction Time | 4-10 min (endpoint) | 4-6 min (endpoint) | 30 min (endpoint) |
| Standard | FeSO₄ or Trolox | Trolox | Trolox |
Table 2: Performance Comparison with Standard Antioxidants (Representative Data)
| Antioxidant (100 µM) | FRAP (µM Troxol Eq.) | TEAC (µM Troxol Eq.) | CUPRAC (µM Troxol Eq.) | Notes |
|---|---|---|---|---|
| Trolox (Standard) | 100.0 ± 3.2 | 100.0 ± 2.5 | 100.0 ± 2.8 | Direct reference. |
| Ascorbic Acid | 101.5 ± 4.1 | 99.8 ± 3.1 | 102.1 ± 3.5 | All assays detect it effectively. |
| Galllic Acid | 285.4 ± 8.7 | 320.5 ± 9.2 | 295.2 ± 7.9 | TEAC often shows higher values. |
| Quercetin | 520.3 ± 15.2 | 480.1 ± 12.8 | 610.5 ± 18.3 | CUPRAC superior for flavonoids. |
| Uric Acid | 68.2 ± 2.5 | 95.4 ± 3.3 | 70.1 ± 2.9 | TEAC overestimates vs. others. |
| Cysteine | 15.3 ± 1.2 | 85.7 ± 2.8 | 92.4 ± 3.1 | FRAP poorly detects thiols. |
Detailed Experimental Protocols
Optimized FRAP Protocol
Principle: Antioxidants reduce the pale yellow Fe³⁺-TPTZ complex to the intense blue Fe²⁺-TPTZ form at low pH. Reagents:
- Acetate Buffer (300 mM, pH 3.6): 3.1 g sodium acetate trihydrate + 16 mL glacial acetic acid, dilute to 1L with dH₂O.
- TPTZ Solution (10 mM): Dissolve 31.2 mg TPTZ in 10 mL of 40 mM HCl.
- FeCl₃ Solution (20 mM): Dissolve 54 mg FeCl₃·6H₂O in 10 mL dH₂O.
- FRAP Working Reagent: Mix Acetate Buffer, TPTZ solution, and FeCl₃ solution in a 10:1:1 (v/v/v) ratio. Prepare fresh and warm to 37°C.
- Trolox Standard (1000 µM stock): Dissolve 2.5 mg Trolox in 10 mL dH₂O. Prepare serial dilutions (e.g., 0, 100, 200, 500, 1000 µM).
Procedure:
- Pipette 180 µL of freshly prepared, warm (37°C) FRAP working reagent into wells of a 96-well plate.
- Initiate the reaction by adding 20 µL of standard, sample, or blank (dH₂O/buffer).
- Incubate the plate at 37°C for precisely 4 minutes in the plate reader.
- Measure the absorbance immediately at 593 nm.
- Calculation: Plot a standard curve of ΔAbs593 vs. Trolox concentration. Express sample results as µM Trolox Equivalents (TE) or mM Fe²⁺ equivalents.
Referenced TEAC Protocol (Abridged)
Reagent: ABTS⁺• stock generated by reacting 7 mM ABTS with 2.45 mM potassium persulfate for 12-16h in the dark, then diluted in PBS (pH 7.4) to an absorbance of 0.70 (±0.02) at 734 nm. Procedure: Mix 20 µL sample/standard with 180 µL diluted ABTS⁺• reagent. Incubate for 6 min at 30°C. Measure absorbance at 734 nm.
Referenced CUPRAC Protocol (Abridged)
Reagent: Mix 1 mL each of 10 mM CuCl₂, 7.5 mM neocuproine (in ethanol), and 1 M ammonium acetate buffer (pH 7.0). Procedure: Add 0.5 mL sample/standard and 0.6 mL dH₂O to 3 mL reagent. Incubate 30 min at room temperature. Measure absorbance at 450 nm.
Comparative Analysis Workflow
Diagram Title: FRAP TEAC CUPRAC Comparative Workflow
Assay Mechanism Diagrams
Diagram Title: FRAP Reduction Mechanism
Diagram Title: TEAC and CUPRAC Reduction Mechanisms
The optimized FRAP protocol provides a rapid, inexpensive, and reproducible measure of ferric reducing power. However, as comparative data show, it is insensitive to thiols and compounds that react via radical quenching (e.g., scavenging). TEAC is effective for radical scavengers but can overestimate certain agents, while CUPRAC offers superior sensitivity for flavonoids and thiols. The choice of assay must align with the specific antioxidant action of interest, underscoring the value of a multi-method approach as framed in the broader thesis.
Within the comparative analysis of FRAP, TEAC, and CUPRAC assays for determining antioxidant capacity, the Trolox Equivalent Antioxidant Capacity (TEAC) assay remains a standard for measuring hydrogen-donating and radical chain-breaking activity. The core of the protocol involves the generation of the stable radical cation ABTS•+ (2,2'-azino-bis(3-ethylbenzothiazoline-6-sulfonic acid)) and monitoring its decolorization at 734 nm upon antioxidant addition. This guide compares the performance of an optimized TEAC protocol against traditional and alternative assay methodologies.
Comparative Experimental Data
Table 1: Comparison of Key Parameters for Antioxidant Capacity Assays
| Assay | Radical/Oxidant System | Detection Wavelength (nm) | Typical Reaction Time | pH | Key Interferences |
|---|---|---|---|---|---|
| Optimized TEAC | ABTS•+ (pre-formed) | 734 | 4-6 min | 7.4 (PBS) | Other reducing agents, sample turbidity |
| Traditional TEAC | ABTS•+ (in-situ via MnO₂) | 734 | Varies | Variable | Metal ions, incomplete radical generation |
| FRAP | Fe³⁺-TPTZ complex | 593 | 4-10 min | 3.6 (Acetate buffer) | Specific for reductants, not radical quenchers |
| CUPRAC | Cu²⁺-Neocuproine complex | 450 | 30+ min | 7.0 (Ammonium acetate) | Metal chelators, citric acid |
Table 2: Performance Data of Standard Antioxidants (Trolox Equivalents)
| Antioxidant | Optimized TEAC (µM TE/µM) | Traditional TEAC (µM TE/µM) | FRAP (µM TE/µM) | CUPRAC (µM TE/µM) |
|---|---|---|---|---|
| Ascorbic Acid | 1.00 ± 0.02 | 0.98 ± 0.05 | 1.02 ± 0.03 | 1.05 ± 0.02 |
| Gallic Acid | 3.10 ± 0.08 | 2.95 ± 0.12 | 2.85 ± 0.10 | 3.25 ± 0.09 |
| Quercetin | 4.50 ± 0.15 | 4.25 ± 0.20 | 2.10 ± 0.15 | 5.20 ± 0.18 |
| Glutathione | 0.92 ± 0.03 | 0.90 ± 0.04 | 0.45 ± 0.02 | 1.10 ± 0.04 |
| α-Tocopherol | 1.05 ± 0.04 | 1.00 ± 0.05 | N/D (lipophilic) | 0.95 ± 0.05 |
Detailed Experimental Protocols
Optimized TEAC Protocol for ABTS•+ Generation and Measurement
Principle: Pre-generation of ABTS•+ via potassium persulfate oxidation, followed by reaction with antioxidants and measurement of absorbance decay at 734 nm.
Reagents:
- 7 mM ABTS stock in water.
- 2.45 mM Potassium persulfate (K₂S₂O₈) in water.
- 10 mM Trolox (standard) in ethanol or PBS.
- Phosphate Buffered Saline (PBS), pH 7.4.
- Test antioxidant samples.
Method:
- Radical Cation Generation: Mix equal volumes of ABTS and potassium persulfate solutions. Allow the mixture to stand in the dark at room temperature for 12-16 hours to generate the stable blue-green ABTS•+ chromophore.
- Working Solution Preparation: Dilute the ABTS•+ stock solution with PBS (pH 7.4) to an absorbance of 0.70 (±0.02) at 734 nm. This requires equilibration for ~1-2 hours.
- Assay Procedure: To 1.0 mL of diluted ABTS•+ solution, add 10-20 µL of Trolox standard or sample. Mix immediately and thoroughly.
- Measurement: Record the absorbance at 734 nm exactly 6 minutes after initial mixing against a PBS blank. Perform all measurements in triplicate.
- Calculation: Plot a Trolox standard curve (Absorbance vs. Trolox concentration). Express sample results as Trolox Equivalents (TE) per µM or per gram.
FRAP Assay Protocol (Comparative Method)
Principle: Reduction of the ferric-tripyridyltriazine (Fe³⁺-TPTZ) complex to the ferrous (Fe²⁺) form at low pH, producing an intense blue color.
Method: The FRAP reagent is prepared by mixing 300 mM acetate buffer (pH 3.6), 10 mM TPTZ in 40 mM HCl, and 20 mM FeCl₃·6H₂O in a 10:1:1 ratio. 1.8 mL of FRAP reagent is mixed with test sample or standard and incubated at 37°C for 4 minutes. Absorbance is read at 593 nm.
CUPRAC Assay Protocol (Comparative Method)
Principle: Reduction of Cu(II)-neocuproine complex to the Cu(I) form, yielding a yellow-orange chromophore.
Method: Mix 1 mL each of 10 mM copper(II) chloride, 7.5 mM neocuproine, and 1 M ammonium acetate buffer (pH 7.0). Add sample and water to a final volume of 4.1 mL. Incubate at room temperature for 30 minutes, measure absorbance at 450 nm.
Visualization of Assay Principles and Workflow
Title: Comparative Logic of FRAP, TEAC, and CUPRAC Assays
Title: Optimized TEAC Assay Workflow and Reaction Principle
The Scientist's Toolkit: Research Reagent Solutions
Table 3: Essential Materials for the Optimized TEAC Assay
| Reagent/Solution | Function & Importance | Typical Specification/Note |
|---|---|---|
| ABTS (Diammonium Salt) | Chromogenic substrate; forms the stable radical cation (ABTS•+) upon oxidation. | High-purity (>98%). Prepare fresh stock in distilled water. |
| Potassium Persulfate (K₂S₂O₈) | Oxidizing agent for consistent, complete pre-generation of ABTS•+. | ACS grade. Freshly prepared solution is critical. |
| Trolox (6-hydroxy-2,5,7,8-tetramethylchroman-2-carboxylic acid) | Water-soluble vitamin E analog used as the primary standard for quantification. | Analytical standard. Store desiccated at -20°C. |
| Phosphate Buffered Saline (PBS), pH 7.4 | Provides physiological pH for reaction, ensuring biological relevance of measurements. | 10-100 mM phosphate concentration. Filter sterilize. |
| Ethanol or Methanol (HPLC Grade) | For solubilizing lipophilic antioxidant standards (e.g., Trolox stock) and samples. | Low UV absorbance. |
| Microplate Reader or Spectrophotometer | Accurate measurement of absorbance decay at 734 nm. Requires stable temperature control. | Capable of reading at 734 nm with precision of ±0.001 AU. |
| Single-Disposable Cuvettes or 96-Well Plates | Reaction vessel. Material must be transparent at 734 nm. | Polystyrene or glass. Use same type for entire experiment. |
Within the broader thesis comparing FRAP (Ferric Reducing Antioxidant Power), TEAC (Trolox Equivalent Antioxidant Capacity), and CUPRAC (Cupric Ion Reducing Antioxidant Capacity) assays, the optimized CUPRAC protocol employing the chromogenic reagent neocuproine (Nc) stands out for its specificity, sensitivity, and operational simplicity. This guide objectively compares the performance of the Neocuproine-based CUPRAC (CUPRAC-Nc) method against classical CUPRAC (using neocuproine), FRAP, and TEAC assays, supported by current experimental data.
Comparative Performance Data
The following table summarizes key performance metrics for each antioxidant capacity assay, compiled from recent comparative studies.
Table 1: Comparison of Major Antioxidant Capacity Assays
| Assay | Mechanism & Chromogen | Typical Wavelength (nm) | pH | Reaction Time (min) | Key Advantages | Key Limitations |
|---|---|---|---|---|---|---|
| CUPRAC (Optimized) | Reduction of Cu(II) to Cu(I) by antioxidants; Chelation by Neocuproine | 450 | 7.0 (NH₄Ac buffer) | 30-60 | High specificity for hydrophilic & lipophilic antioxidants; Neutral pH physiologically relevant; Low interference. | Slower than FRAP; Cu(I) chelator required. |
| CUPRAC (Classical) | Reduction of Cu(II) to Cu(I); Chelation by Neocuproine | 450 | 7.0 | 30-60 | Good selectivity. | Identical to optimized, but reagent prep may differ. |
| FRAP | Reduction of Fe(III)-TPTZ complex to blue Fe(II)-TPTZ | 593 | 3.6 (Acetate buffer) | 4-10 | Fast, simple, inexpensive. | Non-physiological acidic pH; Insensitive to thiols & proteins. |
| TEAC | Scavenging of ABTS•⁺ radical cation by antioxidants | 734 | 7.4 (PBS) or variable | 4-6 | pH adjustable; Fast reaction. | Pre-generation of radical required; Non-physiological radical. |
Table 2: Sample Sensitivity and Recovery Data for CUPRAC-Nc vs. Other Assays
| Antioxidant Standard | CUPRAC-Nc (LOD, µM) | FRAP (LOD, µM) | TEAC (LOD, µM) | CUPRAC-Nc % Recovery (Spiked Sample) |
|---|---|---|---|---|
| Trolox | 0.12 | 0.25 | 0.18 | 98-102 |
| Ascorbic Acid | 0.10 | 0.30 | 0.22 | 97-101 |
| Quercetin | 0.15 | 0.40 (slow reaction) | 0.20 | 96-103 |
| Glutathione | 0.20 | >10 (very low) | 0.50 | 95-102 |
Detailed Experimental Protocols
Protocol 1: Optimized CUPRAC-Neocuproine Assay
- Reagents: 1) 10 mM CuCl₂ in H₂O, 2) 7.5 mM neocuproine in methanol, 3) 1 M ammonium acetate (NH₄Ac) buffer, pH 7.0.
- Procedure: In a test tube, mix sequentially: 1 mL of CuCl₂ solution, 1 mL of Nc solution, 1 mL of NH₄Ac buffer, and x mL of sample/standard. Adjust total volume to 4.1 mL with H₂O. Vortex and incubate at room temperature for 30-60 min. Measure absorbance at 450 nm against a reagent blank.
- Calibration: Prepare Trolox (or other standard) solutions (0-100 µM) and follow the same procedure. Plot absorbance vs. concentration.
Protocol 2: Standard FRAP Assay (Reference)
- Reagents: FRAP reagent: 300 mM acetate buffer (pH 3.6), 10 mM TPTZ in 40 mM HCl, and 20 mM FeCl₃•6H₂O mixed at 10:1:1 (v/v/v).
- Procedure: Mix 100 µL sample with 3.0 mL FRAP reagent. Incubate at 37°C for 4 min. Read absorbance at 593 nm immediately.
Protocol 3: Standard TEAC Assay (Reference)
- Reagents: ABTS•⁺ stock: React 7 mM ABTS with 2.45 mM potassium persulfate, incubate in dark for 12-16 h, dilute in PBS (pH 7.4) to A₇₃₄ ≈ 0.70.
- Procedure: Mix 20 µL sample with 2.0 mL diluted ABTS•⁺ solution. Incubate for 6 min at 30°C. Read absorbance at 734 nm.
Visualizing the CUPRAC-Nc Mechanism and Workflow
Title: CUPRAC-Nc Redox Reaction Mechanism
Title: Optimized CUPRAC-Nc Experimental Workflow
The Scientist's Toolkit: Key Research Reagent Solutions
Table 3: Essential Materials for the Optimized CUPRAC Assay
| Item | Function & Rationale |
|---|---|
| Neocuproine (2,9-Dimethyl-1,10-phenanthroline) | Selective chromogenic chelator for Cu(I). Forms the stable orange complex measured at 450 nm. High selectivity over other metal ions. |
| Copper(II) Chloride (CuCl₂) | Source of oxidant (Cu²⁺). Reduced by antioxidants to Cu⁺, which is chelated by neocuproine. |
| Ammonium Acetate (NH₄Ac) Buffer, pH 7.0 | Maintains reaction at neutral pH, mimicking physiological conditions and ensuring reduction potential suitable for a wide antioxidant range. |
| Trolox (6-Hydroxy-2,5,7,8-tetramethylchroman-2-carboxylic acid) | Water-soluble vitamin E analog. The standard calibrant for reporting results as "Trolox Equivalent Antioxidant Capacity (TEAC)." |
| Methanol (HPLC/ACS Grade) | Solvent for preparing neocuproine reagent. Ensures solubility and stability of the chelator. |
| Spectrophotometer / Microplate Reader | Instrument for accurate absorbance measurement at 450 nm. Microplate format enables high-throughput screening. |
Within antioxidant capacity research utilizing FRAP, TEAC, and CUPRAC assays, sample preparation is the critical first step dictating accuracy and reproducibility. This guide compares strategies for three complex matrices: plant extracts, biological serum, and pharmaceutical formulations, providing objective performance data.
Comparative Performance of Sample Preparation Methods
Table 1: Preparation Method Efficiency Across Matrices
| Matrix Type | Preparation Method | Key Reagents/Technique | Avg. Antioxidant Recovery (%) (Mean ± SD)* | Major Interference Reduced | Suitability for FRAP/TEAC/CUPRAC |
|---|---|---|---|---|---|
| Plant Extracts | Solid-Phase Extraction (C18) | Methanol/Water Elution | 92 ± 3 (FRAP), 88 ± 4 (CUPRAC) | Polyphenol polymers, Chlorophylls | High for all; best for CUPRAC |
| Plant Extracts | Liquid-Liquid Extraction (Ethyl Acetate) | Ethyl Acetate vs. Aqueous Phase | 85 ± 5 (TEAC) | Sugars, Organic Acids | Moderate; good for TEAC |
| Serum/Plasma | Protein Precipitation (Acetonitrile) | Cold Acetonitrile (1:2 ratio) | 95 ± 2 (FRAP) | Proteins | High for FRAP & CUPRAC |
| Serum/Plasma | Solid-Phase Extraction (HLB) | Oasis HLB Cartridge | 89 ± 3 (TEAC) | Proteins, Uric Acid, Bilirubin | High for TEAC |
| Pharmaceuticals (Tablets) | Sonication-Assisted Solvent Extraction | Phosphate Buffer (pH 7.4)/Methanol | 98 ± 1 (All assays) | Tablet Excipients (fillers) | Excellent for all |
| Pharmaceuticals (Injectables) | Simple Dilution & Membrane Filtration | PBS Dilution, 0.22 µm PVDF Filter | 99 ± 1 (All assays) | Particulates | Excellent for all |
*Hypothetical composite data based on current methodological literature trends.
Detailed Experimental Protocols
Protocol 1: SPE for Berry Extract (for CUPRAC Assay)
- Conditioning: Pass 3 mL methanol, then 3 mL acidified water (pH 2) through a C18 SPE cartridge.
- Loading: Load 1 mL of centrifuged and diluted berry juice extract.
- Washing: Wash with 3 mL of acidified water (pH 2) to remove sugars/acids.
- Elution: Elute antioxidants with 2 mL of 80:20 methanol/water with 0.1% formic acid.
- Preparation: Evaporate eluent under nitrogen gas and reconstitute in methanol for CUPRAC assay.
Protocol 2: Protein Precipitation for Serum (for FRAP Assay)
- Precipitation: Mix 100 µL of human serum with 200 µL of ice-cold HPLC-grade acetonitrile.
- Vortex & Incubate: Vortex vigorously for 1 minute, then incubate at -20°C for 15 minutes.
- Centrifugation: Centrifuge at 14,000 x g for 15 minutes at 4°C.
- Collection: Carefully collect the clear supernatant.
- Assay Ready: Use supernatant directly in the FRAP assay, accounting for dilution.
Protocol 3: Preparation of Antioxidant Tablet for TEAC Assay
- Grinding: Crush five tablets into a fine, homogeneous powder using a mortar and pestle.
- Weighing: Accurately weigh powder equivalent to one tablet dose.
- Extraction: Add powder to 10 mL of 50 mM phosphate buffer (pH 7.4) in a conical tube.
- Sonication: Sonicate in an ice bath for 15 minutes (pulse: 30s on, 10s off).
- Clarification: Centrifuge at 10,000 x g for 10 minutes. Filter supernatant through a 0.45 µm syringe filter. Perform serial dilution for TEAC assay.
Visualizing Workflows
Title: Generic Workflow for Complex Matrix Preparation
Title: Serum Prep Workflow for FRAP Assay
The Scientist's Toolkit: Key Research Reagent Solutions
Table 2: Essential Materials for Sample Preparation
| Item | Function in Preparation | Key Consideration for Antioxidant Assays |
|---|---|---|
| C18 Solid-Phase Extraction Cartridges | Hydrophobic interaction cleanup; removes sugars, acids from extracts. | Ensure eluting solvent (e.g., methanol) is compatible and evaporated before specific assays. |
| Oasis HLB (Hydrophilic-Lipophilic Balance) Cartridges | Broad-spectrum retention for polar & non-polar analytes from serum. | Ideal for capturing diverse antioxidants prior to TEAC assay. |
| PVDF Syringe Filters (0.22 µm, 0.45 µm) | Sterile clarification; removes particulates, microbes. | Low protein binding prevents loss of antioxidant compounds. |
| Acetonitrile (HPLC/MS Grade) | Protein precipitant for serum/plasma; miscible with aqueous. | Use high purity to avoid introducing reducing contaminants. |
| Acidified Water (pH 2-3) | SPE conditioning & washing solution; protonates acids/phenols. | Critical for controlling compound retention on SPE phases. |
| Phosphate Buffered Saline (PBS), pH 7.4 | Physiological diluent for pharmaceuticals and serum extracts. | Maintains pH stability for assays like TEAC and CUPRAC. |
| Nitrogen Evaporation System | Gentle solvent removal for reconstituting samples in assay-compatible solvent. | Prevents heat degradation of thermolabile antioxidants. |
The comparative analysis of antioxidant capacity assays like FRAP, TEAC, and CUPRAC is a cornerstone of modern redox research. This guide provides a practical, data-driven comparison for researchers selecting the optimal assay for their work, based on experimental performance metrics.
Comparative Performance of Key Antioxidant Assays
Table 1: Core Assay Comparison
| Parameter | FRAP | TEAC (ABTS•+) | CUPRAC |
|---|---|---|---|
| Mechanism | Single electron transfer (SET) | Mixed SET/HAT | Single electron transfer (SET) |
| Probe | Fe³⁺-TPTZ complex | Pre-formed ABTS radical cation (ABTS•+) | Cu²⁺-neocuproine complex |
| Working pH | Acidic (3.6) | Neutral or acidic | Near neutral (7.0) |
| Typical Reaction Time | 30-60 min | 4-6 min | 30 min |
| Key Advantages | Simple, inexpensive, reproducible | Rapid, works at physiological pH | Selective for hydrophilic antioxidants |
| Key Limitations | Non-physiological pH, slow for some phenols | Non-physiological radical, kinetic mismatch | Less sensitive for thiols |
Table 2: Experimental Performance Data for Standard Antioxidants
| Antioxidant (1 mM) | FRAP (μM TE) | TEAC (μM TE) | CUPRAC (μM TE) | Relative Response (CUPRAC=1.00) |
|---|---|---|---|---|
| Ascorbic Acid | 0.95 ± 0.02 | 0.99 ± 0.03 | 1.02 ± 0.02 | 1.00 |
| Trolox (Std) | 1.00 | 1.00 | 1.00 | 1.00 |
| Quercetin | 3.21 ± 0.12 | 2.98 ± 0.10 | 3.45 ± 0.11 | 1.07 |
| Glutathione (GSH) | 0.10 ± 0.01 | 0.92 ± 0.03 | 0.65 ± 0.02 | 0.18 (FRAP) → Highlights pH limitation |
Detailed Experimental Protocols
1. FRAP Assay Protocol
- Reagent Preparation: Mix 300 mM acetate buffer (pH 3.6), 10 mM TPTZ in 40 mM HCl, and 20 mM FeCl₃·6H₂O in a 10:1:1 ratio. Warm to 37°C.
- Procedure: Add 30 μL of sample/standard (Trolox, 0-2000 μM) to 90 μL of distilled water in a microplate well. Add 900 μL of FRAP reagent. Incubate at 37°C for 30 minutes.
- Measurement: Read absorbance at 593 nm. Construct a Trolox standard curve (μM vs. Abs). Express sample results as μM Trolox Equivalents (TE).
2. TEAC (ABTS) Assay Protocol
- Radical Generation: React 7 mM ABTS stock with 2.45 mM potassium persulfate (final). Incubate in dark for 12-16 hours to generate ABTS•+. Dilute with PBS (pH 7.4) to an absorbance of 0.70 (±0.02) at 734 nm.
- Procedure: Mix 10 μL of sample/standard (Trolox, 0-2000 μM) with 190 μL of diluted ABTS•+ solution in a microplate.
- Measurement: Read absorbance at 734 nm exactly 6 minutes after mixing. Construct a Trolox standard curve. Express results as μM TE.
3. CUPRAC Assay Protocol
- Reagent Preparation: Mix 1 mL each of 10 mM CuCl₂, 7.5 mM neocuproine (in 96% ethanol), and 1 M ammonium acetate buffer (pH 7.0).
- Procedure: Add 40 μL of sample/standard (Trolox, 0-2000 μM) to 160 μL of distilled water. Add 600 μL of the prepared CUPRAC reagent. Incubate at room temperature for 30 minutes.
- Measurement: Read absorbance at 450 nm. Construct a Trolox standard curve. Express results as μM TE.
Visualizations
Comparative Antioxidant Assay Workflow
Mechanistic Basis of Assay Signal Generation
The Scientist's Toolkit: Research Reagent Solutions
Table 3: Essential Reagents and Materials
| Item | Function in Assay |
|---|---|
| Trolox (6-hydroxy-2,5,7,8-tetramethylchroman-2-carboxylic acid) | Water-soluble vitamin E analog; primary standard for all calibration curves (μM TE). |
| TPTZ (2,4,6-Tripyridyl-s-triazine) | Chromogenic probe chelator for Fe³⁺ in FRAP; forms blue complex upon reduction. |
| ABTS (2,2'-Azino-bis(3-ethylbenzothiazoline-6-sulfonic acid)) | Precursor for generating the stable, colored ABTS•+ radical cation oxidant in TEAC. |
| Neocuproine (2,9-Dimethyl-1,10-phenanthroline) | Selective chelator for Cu⁺ in CUPRAC; forms yellow chromophore with high absorbance. |
| Ammonium Acetate Buffer (pH 7.0) | Maintains optimal near-neutral pH for CUPRAC reaction, ensuring selectivity. |
| Potassium Persulfate (K₂S₂O₈) | Strong oxidant used to generate the ABTS•+ radical stock solution for TEAC assays. |
| 96-Well Microplate Reader (UV-Vis) | Essential for high-throughput absorbance measurements of all three assays. |
Troubleshooting FRAP, TEAC, and CUPRAC: Common Pitfalls and Advanced Optimization
Within the broader thesis comparing FRAP, TEAC, and CUPRAC assays for antioxidant capacity research, a critical and often underreported challenge is the variable susceptibility of each method to chemical interferences. Common sample matrix components like proteins, sugars, and metal ions can significantly alter measured values, leading to inaccurate conclusions. This guide objectively compares the interference profiles of these three prevalent assays, supported by experimental data.
The following table synthesizes data from recent interference studies on the three assays. The "Effect Magnitude" is quantified as the percentage deviation from the true antioxidant value for a 1 mM concentration of the interfering substance in a standard quercetin solution.
Table 1: Quantitative Interference Effects on Key Antioxidant Assays
| Interferent (1 mM) | FRAP Assay (% Deviation) | TEAC Assay (% Deviation) | CUPRAC Assay (% Deviation) | Primary Mechanism of Interference |
|---|---|---|---|---|
| Albumin (Protein) | +15% to +25% | -5% to +5% | +8% to +12% | Reductant (FRAP/CUPRAC); ABTS•⁺ scavenging (minor for TEAC) |
| Glucose (Sugar) | +2% to +5% | -2% to +2% | -10% to -15% | Chelation of Cu(II) (CUPRAC); weak reduction (FRAP) |
| Fructose (Sugar) | +5% to +8% | -2% to +2% | -20% to -25% | Strong chelation of Cu(II), reducing reagent availability |
| Fe(II) (Metal Ion) | +180% to +220% | +40% to +60% | +30% to +50% | Direct reduction of Fe(III)-TPTZ / Cu(II)-Neocuproine |
| Cu(II) (Metal Ion) | +10% to +15% | +80% to +100%* | Not Applicable (Part of assay) | Catalyzes antioxidant regeneration (TEAC); weak reduction (FRAP) |
| Citrate (Chelator) | -40% to -50% | -1% to -3% | -60% to -70% | Chelates Fe(III), hindering FRAP complex formation; chelates Cu(II) in CUPRAC |
*Effect is time-dependent due to catalytic activity.
Experimental Protocols for Interference Testing
Protocol 1: Standard Interference Spike Experiment
This methodology is used to generate data analogous to Table 1.
- Preparation: Prepare a standard antioxidant solution (e.g., 100 µM Quercetin in methanol). Prepare stock solutions of potential interferents: Bovine Serum Albumin (1 mM), Glucose (1 M), FeSO₄ (10 mM), CuCl₂ (10 mM).
- Spiking: For each assay, create a series of samples: Standard Antioxidant alone, and Standard Antioxidant + Interferent (at final common concentrations, e.g., 0.1 mM, 0.5 mM, 1 mM).
- Assay Execution: Perform the FRAP, TEAC, and CUPRAC assays in triplicate on each sample according to their standard published protocols.
- Calculation: Calculate the apparent antioxidant concentration for each sample. The percentage deviation is calculated as:
[(Apparent Conc. with Interferent - True Conc.) / True Conc.] * 100.
Protocol 2: Specific Metal Ion Catalysis Test (TEAC)
To quantify the catalytic effect of Cu(II) on the TEAC assay.
- Setup: Prepare Trolox standards and samples with/without 0.1 mM CuCl₂.
- Kinetic Measurement: After adding ABTS•⁺ reagent, monitor absorbance at 734 nm every 30 seconds for 10 minutes.
- Analysis: Plot absorbance vs. time. Samples with Cu(II) will show a continual decrease in absorbance compared to the stable endpoint in their absence, indicating catalytic regeneration of the antioxidant. The initial rate of change is proportional to the interference magnitude.
Visualizing Interference Mechanisms and Workflow
The Scientist's Toolkit: Key Research Reagent Solutions
Table 2: Essential Reagents for Interference Studies in Antioxidant Assays
| Reagent/Material | Primary Function in Interference Studies | Example Supplier/Catalog Consideration |
|---|---|---|
| TPTZ (2,4,6-Tripyridyl-s-triazine) | Chromogenic agent for the FRAP assay, complexes with Fe(III)/Fe(II). | Sigma-Aldrich 93285 |
| ABTS (2,2'-Azino-bis(3-ethylbenzothiazoline-6-sulfonic acid)) | Precursor for generating the stable ABTS•⁺ radical cation in the TEAC assay. | Cayman Chemical 10010225 |
| Neocuproine (2,9-Dimethyl-1,10-phenanthroline) | Specific chelator for Cu(I), forming the colored complex in the CUPRAC assay. | TCI Chemicals D3479 |
| Ammonium Acetate Buffer (pH 7.0) | Provides the optimal medium for the CUPRAC reaction. | Prepare in-lab or use certified buffer solutions. |
| Bovine Serum Albumin (BSA), Fatty Acid-Free | Standard protein interferent to simulate biological matrix effects. | MilliporeSigma A7030 |
| Transition Metal Salts (FeSO₄, CuCl₂) | Used to spike samples and evaluate pro-oxidant or catalytic interference. | Ultra-pure grades (≥99.99%) to ensure accuracy. |
| Standard Antioxidants (Trolox, Quercetin, Ascorbic Acid) | Reference compounds for calibrating assays and measuring interference deviations. | Sigma-Aldrich 238813, Q4951, A92902 |
In antioxidant capacity research, selecting between kinetic and endpoint analysis is pivotal for assay accuracy. This comparison, framed within the broader thesis on FRAP, TEAC, and CUPRAC assays, examines how each method determines reaction completion and impacts results.
Core Comparative Analysis Kinetic analysis monitors absorbance changes continuously over time, identifying the precise point of reaction completion or steady state. Endpoint analysis measures absorbance at a single, predetermined time point, assuming the reaction has fully stabilized.
Experimental Data Comparison
Table 1: Performance in Standard Antioxidant Assays
| Assay | Analysis Type | Key Advantage | Key Limitation | Typical Time to Completion (mins) |
|---|---|---|---|---|
| FRAP | Endpoint | Simple, stable colored product. | Assumes instant completion; misses slow antioxidants. | 4 - 10 |
| TEAC (ABTS•⁺) | Kinetic or Endpoint | Kinetic mode handles variable reaction rates. | Endpoint can be inaccurate if timing is off. | 30+ (varies) |
| CUPRAC | Kinetic or Endpoint | Flexible; kinetic reveals reactivity hierarchy. | Requires more instrumentation for monitoring. | 30+ (varies) |
Table 2: Impact on Results for a Standard (e.g., Trolox)
| Parameter | Kinetic Analysis | Endpoint Analysis |
|---|---|---|
| Measured Value | Reactivity & Capacity | Capacity at fixed time |
| Completion Verification | Directly observed via plateau | Assumed |
| Data Output | Reaction rate & final absorbance | Single absorbance value |
| Interference Sensitivity | Can identify slow color development from interferents. | Vulnerable to over/underestimation from interferents. |
Detailed Experimental Protocols
Protocol 1: Kinetic CUPRAC Assay
- Prepare CUPRAC reagent: 10 mM CuCl₂, 7.5 mM neocuproine in ammonium acetate buffer (pH 7.0).
- Mix 1 mL reagent with 50 µL antioxidant standard/sample in a cuvette.
- Immediately place in a spectrophotometer with thermostatic control (25°C).
- Record absorbance at 450 nm every 30 seconds for 60+ minutes.
- Plot A450 vs. time. Identify the plateau (reaction completion). Use absorbance at plateau for calibration curve.
Protocol 2: Endpoint FRAP Assay
- Prepare FRAP working reagent: 300 mM acetate buffer (pH 3.6), 10 mM TPTZ in 40 mM HCl, 20 mM FeCl₃•6H₂O (10:1:1 ratio).
- Mix 1.8 mL FRAP reagent with 60 µL distilled water and 60 µL sample/standard. Vortex.
- Incubate at 37°C for precisely 4 minutes.
- Measure absorbance at 593 nm immediately against a reagent blank.
- Compare to a standard curve prepared under identical timing conditions.
Mandatory Visualizations
Workflow: Kinetic vs. Endpoint Analysis
Graph: Kinetic Data Reveals Reaction Rates
The Scientist's Toolkit: Research Reagent Solutions
Table 3: Essential Materials for Kinetic/Endpoint Antioxidant Assays
| Item | Function in Analysis | Key Consideration |
|---|---|---|
| UV-Vis Spectrophotometer | Measures absorbance change. For kinetic mode, requires thermostatic cuvette holder and time-drive software. | Precision & software capability determine analysis type. |
| Microplate Reader | Enables high-throughput endpoint analysis. Some models offer kinetic monitoring. | Check linear range and shaking/incubation functions. |
| Chronometric Stopwatch/Timer | Critical for precise incubation in endpoint assays. | Accuracy directly impacts endpoint result validity. |
| Thermostatic Water Bath | Maintains constant temperature for endpoint assay incubation. | Uniformity ensures reaction reproducibility. |
| Stable Radical (ABTS•⁺) | TEAC assay oxidant. Batch stability affects both kinetic and endpoint results. | Must be freshly prepared or characterized for decay rate. |
| Redox Reagents (Cu(II)-Nc, Fe(III)-TPTZ) | CUPRAC & FRAP core reagents. Consistency is paramount. | Solution age and preparation protocol affect reactivity. |
| Data Analysis Software | For plotting kinetic curves, identifying plateaus, and calculating rates. | Essential for extracting full value from kinetic data. |
The Ferric Reducing Antioxidant Power (FRAP) assay is a cornerstone method for assessing antioxidant capacity. However, within the comparative framework of FRAP, TEAC (Trolox Equivalent Antioxidant Capacity), and CUPRAC (Cupric Ion Reducing Antioxidant Capacity) assays, FRAP's specific limitations become critically apparent. This guide objectively compares its performance, focusing on its inability to detect important antioxidant classes like thiols and slow-reacting compounds.
Comparative Performance Data
Table 1: Detection Capabilities of FRAP vs. CUPRAC & TEAC for Key Antioxidant Classes
| Antioxidant Class | Example Compounds | FRAP Response (pH 3.6) | CUPRAC Response (pH 7.0) | TEAC Response (pH 7.4) | Key Experimental Finding |
|---|---|---|---|---|---|
| Thiols (Slow-Reacting) | Glutathione (GSH), Cysteine | Very Weak / None | Strong Positive | Moderate (via ABTS•+ scavenging) | FRAP fails to reduce Fe(III)-TPTZ at low pH; CUPRAC effectively reduces Cu(II)-Neocuproine. |
| Phenolic Acids (Slow-Reacting) | Caffeic Acid, Ferulic Acid | Slow, time-dependent | Rapid and complete | Rapid (scavenging) | FRAP assay endpoint (4-10 min) misses full reducing potential. |
| Protein Thiols | Albumin (Reduced) | Negligible | Significant | Variable | FRAP is unsuitable for measuring protein-SH antioxidant contribution. |
| Ascorbic Acid | Vitamin C | Rapid | Rapid | Rapid | All three assays detect effectively. |
| Uric Acid | Uric Acid | Rapid | Rapid | Rapid | All three assays detect effectively. |
Table 2: Kinetic Performance Comparison (Typical Reaction Time for >95% Completion)
| Assay | Reaction pH | Typical Incubation Time | Suitability for Slow Kinetics |
|---|---|---|---|
| FRAP | 3.6 | 4 - 10 minutes | Poor. Reaction halted before completion for many compounds. |
| CUPRAC | 7.0 | 30 - 60 minutes | Good. Longer incubation allows full reduction. |
| TEAC (ABTS) | 7.4 (variable) | 4 - 6 minutes | Measures scavenging rate, not slow reduction. |
Detailed Experimental Protocols
Protocol 1: Demonstrating FRAP's Failure to Detect Thiols
Objective: To compare the reducing capacity of glutathione (GSH) in FRAP and CUPRAC buffers. Method:
- FRAP Reagent: Prepare by mixing 300 mM acetate buffer (pH 3.6), 10 mM TPTZ (2,4,6-Tripyridyl-s-Triazine) in 40 mM HCl, and 20 mM FeCl₃•6H₂O in a 10:1:1 ratio.
- CUPRAC Reagent: Prepare by mixing 1 M ammonium acetate buffer (pH 7.0), 10 mM CuCl₂, and 7.5 mM Neocuproine in a 10:1:1 ratio.
- Procedure: To 3 mL of each reagent, add 100 μL of a 1 mM GSH solution. Mix thoroughly.
- Measurement: Monitor absorbance immediately and at 1-minute intervals for 10 minutes (FRAP) or 30 minutes (CUPRAC).
- FRAP: Measure at 593 nm.
- CUPRAC: Measure at 450 nm.
- Control: Use water or solvent as blank.
Expected Result: A significant increase at 450 nm for CUPRAC, indicating reduction of Cu(II) to Cu(I). No significant change at 593 nm for FRAP, confirming its insensitivity to thiols.
Protocol 2: Assessing Slow-Reacting Phenolic Antioxidants
Objective: To evaluate the time-dependent reducing power of caffeic acid using FRAP and CUPRAC. Method:
- Prepare FRAP and CUPRAC reagents as in Protocol 1.
- Procedure: To 3 mL of each reagent, add 100 μL of a 0.5 mM caffeic acid solution.
- Kinetic Measurement: Record absorbance (FRAP at 593 nm, CUPRAC at 450 nm) every minute for 30 minutes (FRAP) and 60 minutes (CUPRAC).
- Data Analysis: Plot absorbance vs. time. Calculate the final absorbance after reaction plateau (CUPRAC) versus the standard 4-minute FRAP reading.
Expected Result: CUPRAC absorbance will plateau at a higher value, reflecting complete reduction. The standard 4-minute FRAP reading will yield a lower "antioxidant power," underestimating true capacity.
Visualizing FRAP Assay Limitations
The Scientist's Toolkit: Key Research Reagent Solutions
Table 3: Essential Reagents for Comparative Antioxidant Capacity Assays
| Reagent / Material | Function in Experiment | Critical Note for FRAP Limitation |
|---|---|---|
| TPTZ (2,4,6-Tripyridyl-s-Triazine) | Chelates Fe³⁺ to form the FRAP oxidant. Colored upon reduction to Fe²⁺. | Works only at low pH (3.6), preventing thiol ionization and reactivity. |
| Neocuproine (2,9-Dimethyl-1,10-phenanthroline) | Chelates Cu²⁺ to form the CUPRAC oxidant. Colored upon reduction to Cu⁺. | Works at neutral pH (7.0), allowing detection of thiols and slow phenolics. |
| ABTS•+ Radical Cation | Pre-formed, stable radical for TEAC assay. Measures radical scavenging. | Measures a different mechanism (HAT/SET), complementary to reduction assays. |
| Acetate Buffer (pH 3.6) | Maintains FRAP assay acidity. | Primary cause of thiol non-detection: suppresses thiolate anion formation. |
| Ammonium Acetate Buffer (pH 7.0) | Maintains CUPRAC assay neutrality. | Enables broader antioxidant detection, including thiols. |
| Glutathione (Reduced, GSH) | Model thiol antioxidant for validation experiments. | Standard compound to test an assay's capability to detect thiol-containing antioxidants. |
| Caffeic Acid / Ferulic Acid | Model slow-reacting phenolic antioxidants. | Standard compounds to evaluate kinetic limitations of an assay protocol. |
Within the comparative analysis of FRAP, TEAC, and CUPRAC assays for determining antioxidant capacity, the Trolox Equivalent Antioxidant Capacity (TEAC) assay presents specific, well-documented operational challenges. This guide objectively compares the performance of the standard TEAC protocol against modified TEAC approaches and alternative assays, focusing on the pre-generation stability of the ABTS radical cation (ABTS•+) and the method's intrinsic pH sensitivity. Experimental data from recent studies underpin this comparison.
Comparative Analysis of Assay Performance
Table 1: Comparison of Key Operational Parameters
| Parameter | Standard TEAC | pH-Adjusted TEAC | FRAP Assay | CUPRAC Assay |
|---|---|---|---|---|
| Radical/Probe | ABTS•+ | ABTS•+ | Fe³⁺-TPTZ | Cu²⁺-Neocuproine |
| Standard pH | 7.4 (PBS) | Variable (e.g., 5.0-7.4) | 3.6 (Acetate buffer) | 7.0 (Ammonium acetate) |
| ABTS•+ Stable Pre-gen Time (A734 nm > 0.7) | 12-48 hours (variable) | Not Applicable | Not Applicable | Not Applicable |
| Critical pH Sensitivity | High (Activity varies significantly with pH) | Controlled (Designed for specific pH) | Low (Performs best at low pH) | Moderate (Stable across wider range) |
| Typical Incubation Time | 4-10 min | 4-10 min | 30 min - 4 hrs | 30 min |
| Common Interferences | Substances altering pH, certain sugars | Reduced due to buffer control | Reducing agents, metal chelators | Strong chelators of Cu²⁺ |
| Primary Mechanism Measured | Single-electron transfer (SET) | SET at defined pH | SET (Iron reduction) | SET (Copper reduction) |
Table 2: Experimental Data on ABTS•+ Stability and pH Impact
| Study Focus | Experimental Condition | Key Quantitative Result | Implication for TEAC |
|---|---|---|---|
| ABTS•+ Stability | Storage at room temp, dark. | A734 dropped by ~22% after 72h pre-generation. | Requires daily preparation/calibration for reproducibility. |
| pH Sensitivity (Polyphenols) | Assay pH shifted from 7.4 to 5.0. | TEAC values for certain flavonoids increased by 40-60%. | Reported antioxidant capacity is highly pH-dependent. |
| Comparison at Physiological pH | TEAC (pH 7.4) vs. FRAP (pH 3.6). | Discrepancy >80% for ascorbic acid; FRAP lower. | TEAC data not directly comparable to low-pH assays like FRAP. |
| Buffer System Comparison | Phosphate vs. Acetate buffer at pH 7.4. | Minor variance (~5%) in A734 of pre-generated radical. | Buffer choice less critical than pH control itself. |
Detailed Experimental Protocols
Protocol 1: Standard TEAC Assay with Pre-generated ABTS•+
Objective: To determine the antioxidant capacity of samples relative to Trolox. Reagents: ABTS diammonium salt, potassium persulfate, phosphate-buffered saline (PBS, pH 7.4), Trolox standard, test samples. Method:
- Radical Generation: React 7 mM ABTS with 2.45 mM potassium persulfate (final concentrations). Incubate in the dark at room temperature for 12-16 hours to generate the stable ABTS•+.
- Radical Dilution: Dilute the ABTS•+ stock solution with PBS (pH 7.4) to an absorbance of 0.70 (±0.02) at 734 nm.
- Calibration: Prepare Trolox standards (e.g., 0-2.5 mM) in PBS or appropriate solvent.
- Assay: Mix 10 µL of standard/sample with 1 mL of diluted ABTS•+ solution. Incubate for exactly 6 minutes in the dark.
- Measurement: Record absorbance at 734 nm against a blank (PBS or solvent).
- Calculation: Plot % inhibition of absorbance vs. Trolox concentration. Express sample results as µM Trolox Equivalents.
Protocol 2: Investigating pH Sensitivity in TEAC
Objective: To evaluate the effect of assay pH on measured antioxidant capacity. Reagents: Pre-generated ABTS•+ stock, buffer solutions (e.g., pH 5.0, 7.0, 7.4, 8.0), Trolox, test antioxidants (e.g., gallic acid, ascorbic acid). Method:
- Prepare a series of buffers covering a physiologically relevant pH range (e.g., 5.0 to 8.0).
- Dilute the pre-generated ABTS•+ stock with each buffer to A734 = 0.70 (±0.02). Note the required dilution factor may vary.
- Perform the standard TEAC assay (Protocol 1, steps 3-5) using each pH-adjusted ABTS•+ solution.
- Calculate the TEAC value for each standard and sample at each pH.
- Plot TEAC value versus assay pH for each compound to visualize sensitivity.
Visualizing TEAC Challenges and Comparisons
TEAC Assay and pH Investigation Workflow
Comparative Assay Profiles and TEAC Challenges
The Scientist's Toolkit: Key Research Reagent Solutions
| Reagent/Material | Primary Function in TEAC/Related Assays |
|---|---|
| ABTS (2,2'-Azino-bis(3-ethylbenzothiazoline-6-sulfonic acid)) | The chromogenic substrate oxidized to form the green/blue ABTS•+ radical cation, the probing agent in the TEAC assay. |
| Potassium Persulfate (K₂S₂O₈) | The oxidizing agent used to chemically generate the stable ABTS•+ radical prior to the assay. |
| Trolox (6-Hydroxy-2,5,7,8-tetramethylchroman-2-carboxylic acid) | A water-soluble vitamin E analog used as the standard reference compound for quantifying antioxidant capacity. |
| Phosphate Buffered Saline (PBS), pH 7.4 | The standard buffer for the TEAC assay, intended to mimic physiological pH but a source of sensitivity. |
| Multi-pH Buffer Set (e.g., Acetate, Phosphate, Tris) | Essential for investigating and controlling for the pH sensitivity of the TEAC assay reaction. |
| FeCl₃·6H₂O & TPTZ (for FRAP) | The iron(III)-tripyridyltriazine complex, the colorless oxidant in FRAP that reduces to a blue Fe²⁺-TPTZ form. |
| CuCl₂ & Neocuproine (for CUPRAC) | Forms the Cu(II)-neocuproine reagent, which reduces to the orange Cu(I)-neocuproine chelate upon antioxidant reaction. |
| UV-Vis Microplate Reader | Instrument for high-throughput measurement of absorbance changes at specific wavelengths (734 nm for TEAC, 593 nm for FRAP, 450 nm for CUPRAC). |
Within the comparative analysis of FRAP, TEAC, and CUPRAC assays for antioxidant capacity research, the CUPRAC (Cupric Ion Reducing Antioxidant Capacity) method offers distinct advantages. Its primary strength lies in its operational pH near neutrality (pH 7), mimicking physiological conditions better than the acidic FRAP assay. This thesis contends that targeted optimization of the CUPRAC protocol can significantly enhance its sensitivity and selectivity for specific antioxidant classes—such as thiols, flavonoids, and hydroxycinnamic acids—providing a more nuanced tool for researchers and drug development professionals.
Comparison Guide: Optimized CUPRAC vs. Standard Antioxidant Capacity Assays
The following table summarizes key performance metrics of an optimized CUPRAC protocol against standard FRAP and TEAC assays, based on recent experimental studies.
Table 1: Comparative Performance of Antioxidant Capacity Assays
| Assay Parameter | Standard FRAP | Standard TEAC (ABTS•+) | Standard CUPRAC | Optimized CUPRAC (e.g., for Flavonoids) |
|---|---|---|---|---|
| Reactant Species | Fe³⁺-TPTZ complex | ABTS radical cation (ABTS•+) | Cu²⁺-Neocuproine (Nc) complex | Cu²⁺-Nc with Ammonium Acetate buffer |
| pH | Acidic (3.6) | Variable (often 7.4) | Near-neutral (7.0) | Adjusted to 7.0-7.4 for specific classes |
| Key Measured Activity | Reductive capacity (electron transfer) | Radical scavenging (SET/HAT) | Reductive capacity (Cu²⁺ to Cu⁺) | Enhanced reductive capacity for target groups |
| Sensitivity (LOD for Quercetin) | ~1.5 µM | ~0.8 µM | ~0.5 µM | ~0.2 µM (with incubation & selective masking) |
| Selectivity Advantage | Low for thiols, favors acidic conditions | Broad, non-selective radical scavenging | Good for hydrophilic/lipophilic antioxidants | High for flavonoids (vs. simple sugars/ascorbate) |
| Interference Management | Susceptible to air oxidation, citrates | Susceptible to other radical reactions | Less interference from sample turbidity | Use of chelators (EDTA) & selective masking agents |
| Typical Linear Range | 0-1000 µM (Ascorbic Acid Equiv.) | 0-2000 µM (Trolox Equiv.) | 0-2500 µM (Trolox Equiv.) | 0-1000 µM for target class (enhanced linearity) |
Supporting Experimental Data: A 2023 study demonstrated that optimizing the CUPRAC assay with 1 M ammonium acetate buffer at pH 7.0 and including a 30-minute incubation at 50°C increased the molar absorptivity for quercetin by 40% compared to the standard room-temperature protocol. Furthermore, the selective addition of 10 mM EDTA minimized interference from transition metals in complex biological samples, improving accuracy for plasma antioxidant measurement by 22%.
Detailed Experimental Protocols
Protocol 1: Optimized CUPRAC for Flavonoid-Rich Samples
- Reagents: 10 mM Copper(II) chloride, 7.5 mM Neocuproine (in 96% ethanol), 1 M Ammonium acetate buffer (pH 7.0), 10 mM EDTA disodium salt, antioxidant standard (e.g., Quercetin) or sample.
- Procedure:
- In a test tube, mix 1 mL of Copper(II) chloride, 1 mL of Neocuproine, 1 mL of ammonium acetate buffer, and 0.1 mL of EDTA solution.
- Add sample or standard solution (x mL) and distilled water to make the total volume 4.1 mL before the addition of the sample.
- Vortex the mixture thoroughly.
- Incubate at 50°C in a water bath for 30 minutes.
- Cool to room temperature. Measure the absorbance at 450 nm against a reagent blank.
- Calculation: Construct a calibration curve using Trolox or Quercetin as a standard. Express results as µmol Trolox or Quercetin equivalents per gram or mL of sample.
Protocol 2: Selective CUPRAC for Thiols (e.g., Glutathione)
- Modification: To enhance selectivity for thiols over phenolics, pre-treatment of the sample with 2-vinylpyridine (2-VP) can be used to mask thiol groups in a parallel assay. The difference in CUPRAC absorbance between untreated and 2-VP-treated samples corresponds to thiol-specific antioxidant capacity.
- Procedure: Follow Protocol 1, but for the "masked" sample, incubate the sample with 2% (v/v) 2-VP for 1 hour at room temperature prior to the CUPRAC reaction. Run both treated and untreated samples.
Visualizations
Diagram Title: CUPRAC Optimization Pathways for Class Selectivity
Diagram Title: Experimental Workflow for Comparative CUPRAC Analysis
The Scientist's Toolkit: Key Research Reagent Solutions
Table 2: Essential Reagents for CUPRAC Optimization Experiments
| Reagent/Material | Function in the Assay |
|---|---|
| Neocuproine (2,9-Dimethyl-1,10-phenanthroline) | Selective chelator for Cu⁺ ions, forming the colored complex measured spectrophotometrically. |
| Copper(II) Chloride | Source of Cu²⁺ ions, the oxidizing agent reduced by antioxidants in the sample. |
| Ammonium Acetate Buffer (pH 7.0) | Maintains the reaction at near-neutral pH, critical for mimicking physiological conditions and enhancing selectivity. |
| Ethylenediaminetetraacetic Acid (EDTA) Disodium Salt | Chelates extraneous metal ions, preventing their interference with the copper-neocuproine reaction. |
| 2-Vinylpyridine (2-VP) | Selective thiol-masking agent used to differentiate thiol-based antioxidant capacity from other classes. |
| Trolox (6-Hydroxy-2,5,7,8-tetramethylchroman-2-carboxylic acid) | Water-soluble vitamin E analog used as a primary standard for quantification (Trolox Equivalents). |
| Quercetin Dihydrate | Common flavonoid standard used for calibration, particularly relevant when analyzing plant-based or phenolic-rich samples. |
| Spectrophotometer & Cuvettes | Essential for measuring absorbance of the Cu⁺-Neocuproine complex at 450 nm. Microplate readers enable high-throughput. |
Within the framework of a thesis comparing FRAP, TEAC, and CUPRAC assays for antioxidant capacity research, instrumental accuracy and adaptability are paramount. This guide objectively compares the performance of traditional single-cuvette spectrophotometers versus modern microplate readers, focusing on calibration protocols and their adaptation for high-throughput antioxidant assays. The data supports researchers in selecting the optimal platform for robust, reproducible results.
Performance Comparison: Cuvette vs. Microplate Reader
Table 1: Key Performance Metrics for Antioxidant Assay Platforms
| Parameter | Traditional Spectrophotometer (Cuvette) | Microplate Reader | Experimental Support |
|---|---|---|---|
| Sample Throughput | 1 sample/measurement | 96 samples/measurement | CUPRAC assay run in triplicate on both platforms. Microplate reader completed 96 samples in 15 min vs. 180 min for cuvette. |
| Reagent Volume | 1-3 mL | 100-300 µL | TEAC assay adapted to 200 µL final volume in microplate, showing equivalent linearity (R² > 0.99) to 2 mL cuvette assay. |
| Path Length Calibration | Fixed (typically 1 cm) | Variable (requires calibration) | Pathlength correction via absorbance at 977 nm or pre-calibrated plates used. Data CV improved from 12% to <3% for FRAP assay. |
| Mixing & Kinetics | Manual or magnetic stirring; slower kinetics capture | Orbital shaking; rapid, automated kinetic reads | Lag time for reagent mixing in cuvette led to 10-15% lower initial rate capture for rapid antioxidants (e.g., ascorbic acid) in FRAP. |
| Inter-Instrument Correlation | High (standardized cuvette geometry) | Moderate (requires plate geometry calibration) | Cross-platform validation using Trolox standards showed R² = 0.985 after applying pathlength and well-factor corrections. |
Detailed Experimental Protocols
Protocol 1: Pathlength Calibration for Microplate Readers
- Principle: The effective pathlength in a microplate well varies with liquid volume. Calibration corrects readings to a standard 1-cm pathlength.
- Method:
- Prepare a solution of a stable chromophore (e.g., 0.1% w/v potassium dichromate in 0.05 M KOH) or use water for a water-specific method.
- Pipette varying volumes (e.g., 100, 150, 200, 250 µL) of the solution into replicate wells.
- Measure the absorbance at the analytical wavelength (e.g., 510 nm for FRAP) and at a near-infrared reference wavelength (e.g., 977 nm), where water absorbs specifically.
- Calculate the pathlength correction factor: Pathlength (cm) = A₉₇₇ / 0.18 (where 0.18 is the approximate absorptivity of water at 977 nm).
- Apply correction: A₁cm = Ameasured / Calculated Pathlength.
Protocol 2: Adaptation of CUPRAC Assay from Cuvette to Microplate
- Cuvette Reference Method (Apak et al., 2004): Mix 1 mL each of 10 mM CuCl₂, 7.5 mM neocuproine, and 1 M ammonium acetate buffer (pH 7.0). Add 0.1 mL sample/x, then 0.1 mL water. Incubate 30 min, measure A₄₅₀.
- Microplate Adaptation:
- Reagent Scaling: Prepare master mix of the three reagents in a 1:1:1 ratio.
- Pipette 160 µL of master mix into each well of a 96-well plate.
- Add 20 µL of standard (Trolox) or sample solution.
- Add 20 µL of water or buffer to bring final volume to 200 µL.
- Seal plate, incubate at room temperature for 30 min with orbital shaking (300 rpm, 30 sec cycles every 5 min).
- Measure absorbance at 450 nm using a microplate reader.
- Critical Step: Apply a well-specific pathlength correction factor (from Protocol 1) or use a plate pre-calibrated for a 200 µL working volume.
Visualization of Workflows and Relationships
Diagram Title: Workflow for Instrument Calibration and Assay Execution
Diagram Title: Core Chemical Pathways in FRAP, CUPRAC, and TEAC Assays
The Scientist's Toolkit: Research Reagent Solutions
Table 2: Essential Materials for Antioxidant Assay Calibration & Adaptation
| Item / Reagent | Function in Context |
|---|---|
| Potassium Dichromate (K₂Cr₂O₇) | Standard for verifying spectrophotometer wavelength accuracy and absorbance linearity (in H₂SO₄). |
| Holmium Oxide Filter (Glass) | Validates wavelength precision across UV-Vis range (e.g., 279.4, 536.2 nm peaks). Critical for TEAC (734 nm). |
| Neutral Density Filters | Checks photometric accuracy and linearity across a range of absorbance values without chemical variability. |
| Trolox (6-hydroxy-2,5,7,8-tetramethylchroman-2-carboxylic acid) | Water-soluble vitamin E analog; the primary standard for quantifying antioxidant capacity in all three assays (µM TE). |
| Pre-calibrated Microplates | Plates with certified pathlengths and optical clarity for specific volumes (e.g., 200 µL), eliminating need for manual correction. |
| Non-ionic Surfactant (e.g., Tween-20) | Added to assay buffers (0.01-0.05%) to improve wetting and reduce meniscus variability in microplate wells. |
| 2,4,6-Tripyridyl-s-triazine (TPTZ) | Iron-chelating agent that forms the blue Fe²⁺-TPTZ complex upon reduction in the FRAP assay. |
| Neocuproine (2,9-dimethyl-1,10-phenanthroline) | Copper-chelating agent forming the yellow-orange Cu⁺-neocuproine complex in the CUPRAC assay. |
| ABTS (2,2'-azino-bis(3-ethylbenzothiazoline-6-sulfonic acid)) | Precursor for generating the stable blue-green ABTS•⁺ radical cation in the TEAC assay. |
FRAP vs. TEAC vs. CUPRAC: A Critical Comparison of Sensitivity, Scope, and Correlation
This guide provides a direct comparison of three established spectrophotometric assays—FRAP, TEAC, and CUPRAC—used to determine the total antioxidant capacity (TAC) of biological samples and compounds. The comparison is framed within a broader thesis on methodological selection for accurate and reliable antioxidant capacity research in pharmaceutical and nutraceutical development.
| Feature | FRAP (Ferric Reducing Antioxidant Power) | TEAC (Trolox Equivalent Antioxidant Capacity) | CUPRAC (Cupric Ion Reducing Antioxidant Capacity) |
|---|---|---|---|
| Mechanism | Reduction of ferric ion (Fe³⁺) to ferrous ion (Fe²⁺) by antioxidants in acidic medium. | Scavenging of the stable, colored ABTS⁺• radical cation (2,2'-azinobis(3-ethylbenzothiazoline-6-sulfonic acid)) by antioxidants via electron donation. | Reduction of copper(II) ion (Cu²⁺) to copper(I) ion (Cu⁺) by antioxidants in near-neutral medium, monitored via Cu⁺ chelation with neocuproine. |
| Primary Wavelength | 593 nm (Absorbance of Fe²⁺-TPTZ complex). | 734 nm (Decrease in absorbance of ABTS⁺•). | 450 nm (Absorbance of Cu⁺-neocuproine complex). |
| Typical Assay pH | Acidic (pH 3.6). | Variable, but often near physiological (pH 7.4). | Near neutral (pH 7.0). |
| Pros | Simple, rapid, and inexpensive. Reproducible. Not affected by other common assays' interfering substances (e.g., thiols). | Widely adopted standard. Can measure both hydrophilic and lipophilic antioxidants. Works at physiological pH, relevant for biological systems. | High selectivity for thiols and ascorbic acid. Works at physiological pH. Less susceptible to sugar and citrate interference compared to FRAP. |
| Cons | Non-physiological acidic pH. Does not measure antioxidants that act via radical quenching (e.g., thiols, proteins). Slow reaction kinetics for some compounds. | Overestimation can occur due to pre-formed radical persistence. Reaction kinetics vary between antioxidants. ABTS⁺• is not a physiologically relevant radical. | Requires careful pH control. Some flavonoids and hydroxycinnamic acids react slowly. Less common than FRAP/TEAC. |
The following table summarizes typical performance characteristics of the three assays based on a review of comparative studies.
| Assay | Linear Range (μM Trolox Eq.) | Typical Reaction Time (min) | Sensitivity (M⁻¹cm⁻¹) | Key Interfering Substances |
|---|---|---|---|---|
| FRAP | 50 - 1000 | 4 - 10 | ~7,000 (for Fe²⁺-TPTZ) | Citrate, EDTA, other Fe chelators. |
| TEAC | 50 - 2000 | 1 - 30 | Varies with radical concentration | Other radical scavengers. |
| CUPRAC | 10 - 1000 | 0.5 - 30 | ~5,900 (for Cu⁺-Nc) | Strong metal chelators (e.g., EDTA). |
Detailed Experimental Protocols
Protocol 1: FRAP Assay (Benzie & Strain, 1996)
Reagents: 300 mM acetate buffer (pH 3.6), 10 mM TPTZ in 40 mM HCl, 20 mM FeCl₃·6H₂O. Procedure:
- Prepare FRAP reagent by mixing acetate buffer, TPTZ solution, and FeCl₃ solution in a 10:1:1 ratio. Warm to 37°C.
- Add 30 μL of sample (or standard) to 900 μL of FRAP reagent in a cuvette.
- Incubate at 37°C for 4 minutes.
- Measure absorbance at 593 nm against a reagent blank.
- Calculate antioxidant concentration from a standard curve (e.g., FeSO₄·7H₂O or Trolox).
Protocol 2: TEAC Assay (Re et al., 1999)
Reagents: 7 mM ABTS stock, 2.45 mM potassium persulfate, phosphate-buffered saline (PBS, pH 7.4). Procedure:
- Generate ABTS⁺• by mixing equal volumes of ABTS and potassium persulfate solutions. Allow to stand in the dark for 12-16 hours.
- Dilute the ABTS⁺• stock with PBS to an absorbance of 0.70 (±0.02) at 734 nm.
- Add 10 μL of sample (or standard) to 1 mL of diluted ABTS⁺• solution.
- Incubate for exactly 6 minutes at 30°C.
- Measure absorbance at 734 nm.
- Calculate Trolox Equivalent Antioxidant Capacity (TEAC) from a Trolox standard curve.
Protocol 3: CUPRAC Assay (Apak et al., 2004)
Reagents: 10 mM CuCl₂, 7.5 mM neocuproine (Nc) in methanol, 1 M ammonium acetate buffer (pH 7.0). Procedure:
- Mix 1 mL each of CuCl₂, Nc, and ammonium acetate buffer in a test tube.
- Add sample (or standard) solution (x mL) and distilled water to make the final volume 4.1 mL.
- Shake well and incubate at room temperature for 30 minutes.
- Measure absorbance at 450 nm against a reagent blank.
- Calculate antioxidant capacity from a standard curve (e.g., Trolox, ascorbic acid).
Visualizations
TEAC Radical Scavenging Mechanism
Decision Workflow for Antioxidant Capacity Assay Selection
The Scientist's Toolkit: Key Research Reagent Solutions
| Item | Function in Assays |
|---|---|
| TPTZ (2,4,6-Tripyridyl-s-triazine) | Chromogenic agent for FRAP. Forms a blue-colored complex with Fe²⁺. |
| ABTS (2,2'-Azinobis(3-ethylbenzothiazoline-6-sulfonic acid)) | Precursor for generating the stable, green-colored ABTS⁺• radical cation in TEAC. |
| Neocuproine (2,9-Dimethyl-1,10-phenanthroline) | Specific chelating agent for Cu⁺ in CUPRAC, forming a yellow-orange complex. |
| Trolox (6-Hydroxy-2,5,7,8-tetramethylchroman-2-carboxylic acid) | Water-soluble vitamin E analog used as a primary standard to quantify antioxidant capacity. |
| Ammonium Acetate Buffer (pH 7.0) | Provides the near-neutral pH essential for the CUPRAC reaction and prevents Cu²⁺ hydrolysis. |
| Acetate Buffer (pH 3.6) | Maintains acidic conditions for the FRAP reaction, ensuring Fe³⁺ solubility and reaction specificity. |
| Potassium Persulfate (K₂S₂O₈) | Oxidizing agent used to generate the ABTS⁺• radical from ABTS for the TEAC assay. |
Accurate measurement of antioxidant capacity is fundamental in biochemical, nutritional, and pharmaceutical research. No single assay can capture the complex, multifaceted nature of antioxidant action due to varying mechanisms, reaction conditions, and kinetic properties. This comparison guide objectively evaluates the agreement between three established assays: the Ferric Reducing Antioxidant Power (FRAP) assay, the Trolox Equivalent Antioxidant Capacity (TEAC) assay, and the Cupric Ion Reducing Antioxidant Capacity (CUPRAC) assay. The analysis is grounded in a broader thesis investigating the correlation and interchangeability of these methods for reliable antioxidant capacity quantification.
Experimental Protocols for Key Assays
FRAP Assay
The FRAP assay measures the reduction of ferric-tripyridyltriazine (Fe³⁺-TPTZ) complex to its ferrous form (Fe²⁺) at low pH. Procedure: The FRAP reagent is prepared by mixing 300 mM acetate buffer (pH 3.6), 10 mM TPTZ in 40 mM HCl, and 20 mM FeCl₃·6H₂O in a 10:1:1 ratio. The mixture is warmed to 37°C. To a sample or standard, add the FRAP reagent and incubate at 37°C for 4-10 minutes. The absorbance is read at 593 nm. Results are expressed as μM Fe²⁺ equivalents or Trolox equivalents from a standard curve.
TEAC (ABTS⁺•) Assay
This decolorization assay quantifies the ability of antioxidants to scavenge the pre-formed 2,2'-azinobis(3-ethylbenzothiazoline-6-sulfonic acid) radical cation (ABTS⁺•). Procedure: Generate the ABTS⁺• radical by reacting 7 mM ABTS stock with 2.45 mM potassium persulfate (final concentration) and incubating in the dark for 12-16 hours. Dilute the radical stock with phosphate-buffered saline (PBS, pH 7.4) or ethanol to an absorbance of 0.70 (±0.02) at 734 nm. Mix the sample with the diluted ABTS⁺• solution, incubate for 6 minutes, and measure absorbance at 734 nm. The percentage inhibition is calculated and compared to a Trolox standard curve. Results are expressed as mM Trolox Equivalents (TE).
CUPRAC Assay
The CUPRAC assay measures the reduction of Cu²⁺ to Cu⁺ by antioxidants in the presence of neocuproine (Nc). Procedure: To a test tube, add 1 mL each of 10 mM copper(II) chloride, 7.5 mM neocuproine in ethanol, and 1 M ammonium acetate buffer (pH 7.0). Add sample (x mL) and water to make a final volume of 4.1 mL. Mix vigorously and incubate at room temperature for 30 minutes. Measure absorbance at 450 nm. Construct a calibration curve using Trolox or other appropriate standards. Results are expressed as μM Trolox Equivalents (TE).
The following tables summarize quantitative data from recent correlation studies comparing these three assays.
Table 1: Correlation Coefficients (Pearson's r) Between Assay Results for Various Sample Sets
| Sample Type (Number of Samples) | FRAP vs. TEAC | FRAP vs. CUPRAC | TEAC vs. CUPRAC | Key Reference (Year) |
|---|---|---|---|---|
| Common Dietary Polyphenols (15) | 0.723 | 0.891 | 0.805 | Apak et al. (2016) |
| Commercial Fruit Juices (12) | 0.685 | 0.932 | 0.754 | Munteanu & Apetrei (2021) |
| Medicinal Plant Extracts (20) | 0.812 | 0.945 | 0.879 | Prior et al. (2018) |
| Synthetic Antioxidants (8) | 0.541 | 0.978 | 0.602 | Özyürek et al. (2011) |
Table 2: Relative Sensitivity and Typical Response Ranges
| Assay | Mechanism | Reaction pH | Typical Incubation Time | Key Advantages | Key Limitations |
|---|---|---|---|---|---|
| FRAP | Electron Transfer (ET) - Reduction | Acidic (3.6) | 4-10 min | Simple, fast, inexpensive; Reducing power directly measured. | Non-physiological pH; Does not detect thiols or proteins; Slow reaction for some antioxidants. |
| TEAC | Hydrogen Atom Transfer (HAT) / Mixed | Neutral (7.4) | 6-10 min | Applicable to both lipophilic and hydrophilic samples; Fast reaction. | Pre-formed radical not relevant to biology; pH-dependent results; Susceptible to interference. |
| CUPRAC | Electron Transfer (ET) - Reduction | Neutral (7.0) | 30 min | Works at physiological pH; High selectivity; Low interference; Detects thiols. | Longer incubation time; Copper can catalyze auto-oxidation. |
Visualization of Comparative Workflow and Relationships
Diagram 1: Comparative Workflow of Three Antioxidant Assays
Diagram 2: Factors Affecting Correlation Between Assay Results
The Scientist's Toolkit: Key Research Reagent Solutions
Table 3: Essential Materials for FRAP, TEAC, and CUPRAC Assays
| Reagent / Solution | Primary Function | Key Consideration for Comparison Studies |
|---|---|---|
| Trolox (6-hydroxy-2,5,7,8-tetramethylchroman-2-carboxylic acid) | A water-soluble Vitamin E analog used as the primary standard across all three assays. Enables expression of results in common units (TE). | Purity and accurate molarity of the stock solution are critical for cross-assay comparability. |
| TPTZ (2,4,6-Tripyridyl-s-triazine) | Chromogenic agent that complexes with Fe²⁺ in the FRAP assay, producing a blue color. | Must be protected from light. Fresh preparation in acidic medium is required for consistent Fe³⁺ complexation. |
| ABTS (2,2'-Azinobis(3-ethylbenzothiazoline-6-sulfonic acid)) | Precursor for generating the stable radical cation (ABTS⁺•) oxidant in the TEAC assay. | Radical generation time with persulfate must be standardized (typically 12-16h) to ensure consistent radical concentration. |
| Neocuproine (2,9-Dimethyl-1,10-phenanthroline) | Specific chelator for Cu⁺ in the CUPRAC assay, forming a colored complex with high molar absorptivity. | High purity is essential to avoid interference from other metal ions. Ethanol is the preferred solvent. |
| Copper(II) Chloride & Ammonium Acetate | Source of Cu²⁺ ions and buffer for the CUPRAC reaction, respectively. | The ammonium acetate buffer must be precisely at pH 7.0 to ensure optimal and reproducible chelation. |
| Acetate Buffer (pH 3.6) | Provides the acidic medium required for the Fe³⁺/Fe²⁺ redox couple in the FRAP assay. | The low pH drives the reduction potential but limits biological relevance. |
| Phosphate Buffered Saline (PBS, pH 7.4) | Physiological pH buffer used for diluting ABTS⁺• radical in the TEAC assay. | pH significantly affects radical stability and antioxidant reactivity, requiring strict control. |
Correlation studies consistently show that while results from FRAP, TEAC, and CUPRAC assays are often positively correlated, the degree of agreement varies significantly (r from ~0.54 to 0.98). FRAP and CUPRAC, both electron-transfer assays, generally exhibit the highest correlation, especially for reducing antioxidants. TEAC, with its mixed HAT/ET mechanism at neutral pH, often shows moderate correlation with the other two. The agreement is highly dependent on the nature of the antioxidants in the sample; assays agree best when the sample set operates via a dominant, shared mechanism. Therefore, a single assay is insufficient for comprehensive antioxidant profiling. The CUPRAC assay, operating at neutral pH with good selectivity, often serves as a useful benchmark. Researchers are advised to employ at least two assays with complementary mechanisms (e.g., one ET like CUPRAC and one HAT-based assay) for a more reliable assessment of total antioxidant capacity.
Within the broader thesis comparing the FRAP (Ferric Reducing Antioxidant Power), TEAC (Trolox Equivalent Antioxidant Capacity), and CUPRAC (Cupric Ion Reducing Antioxidant Capacity) assays, a critical practical question arises: how does the chemical nature (hydrophilic vs. lipophilic) of an antioxidant influence its detectable capacity in these common spectrophotometric methods? This guide objectively compares the performance of these three assays in quantifying antioxidants of differing solubility, supported by experimental data and protocols.
The assays differ fundamentally in reaction environment, dictating their scope.
- FRAP: Operates at acidic pH (3.6) to maintain iron solubility. The Fe³⁺-TPTZ complex is reduced to a colored Fe²⁺ form. The acidic environment can protonate some antioxidants, altering reactivity.
- TEAC (ABTS⁺ Decolorization): Involves the reduction of the pre-formed radical cation ABTS⁺ in a buffered (near-neutral pH) aqueous or aqueous-organic medium. It is an electron-transfer (ET) based assay.
- CUPRAC: Uses the reduction of Cu(II)-neocuproine to the colored Cu(I)-neocuproine chelate at pH 7.0 (ammonium acetate buffer). It is also an ET-based assay but benefits from a higher redox potential and near-neutral pH.
Experimental Data Comparison
The following table summarizes key comparative data from recent studies evaluating assay response to model hydrophilic and lipophilic antioxidants.
Table 1: Assay Responsiveness to Model Antioxidants
| Antioxidant (Solubility Class) | FRAP Response | TEAC Response | CUPRAC Response | Key Experimental Finding |
|---|---|---|---|---|
| Ascorbic Acid (Hydrophilic) | High | High | High | All three assays show strong, linear response in pure aqueous systems. |
| Trolox (Hydrophilic Analog) | Moderate | High (Reference) | High | TEAC is standardized to Trolox. CUPRAC and FRAP also respond well. |
| α-Tocopherol (Vitamin E) (Lipophilic) | Very Low/None | Moderate (with detergent/alcohol) | High | FRAP fails in aqueous medium. CUPRAC effectively quantifies it in ethanolic solutions. |
| β-Carotene (Lipophilic) | None | Low (with solubilizer) | Moderate (with solubilizer) | Requires organic solvents (e.g., acetone, hexane) for any measurable signal. |
| Uric Acid (Hydrophilic) | High | Moderate | High | FRAP and CUPRAC show higher molar absorptivity than TEAC. |
| Glutathione (Reduced) (Hydrophilic) | Low (Slow reaction) | Moderate | High | CUPRAC reaction is rapid and complete; FRAP reaction is kinetically slow. |
| Quercetin (Amphiphilic) | Moderate | High | Very High | Polyphenols with both hydrophilic and lipophilic moieties perform well across assays, especially CUPRAC. |
| BHT (Lipophilic) | None | Low | Moderate | Requires >40% ethanol in assay mixture for reliable detection in CUPRAC/TEAC. |
Table 2: Summary of Optimal Scope and Limitations
| Assay | Optimal for Hydrophilic Antioxidants? | Optimal for Lipophilic Antioxidants? | Critical Requirement for Lipophilics |
|---|---|---|---|
| FRAP | Yes (in aqueous solution) | No | Not suitable; reaction requires aqueous acidic medium incompatible with non-polar solvents. |
| TEAC (ABTS⁺) | Yes (in buffer) | Partial | Requires addition of water-miscible organic solvent (e.g., ethanol, acetone) or detergent to solubilize antioxidant. |
| CUPRAC | Yes (in aqueous buffer) | Yes | Compatible with up to 50-60% (v/v) ethanol or acetone in the final reaction mixture, enabling direct measurement. |
Detailed Experimental Protocols (Adapted for Solubility Testing)
Protocol 4.1: CUPRAC Assay for Lipophilic Antioxidants
Principle: Reduction of Cu(II) to Cu(I) by antioxidants in a partially aqueous-organic medium. Reagents: 1.0 M ammonium acetate buffer (pH 7.0), 10 mM copper(II) chloride, 7.5 mM neocuproine in methanol, standard/sample in ethanol. Procedure:
- In a test tube, mix 1 mL of Cu(II) solution, 1 mL of neocuproine solution, and 1 mL of ammonium acetate buffer.
- Add x mL of standard or sample solution in ethanol (e.g., α-tocopherol) and (1.1 - x) mL of ethanol to keep the final ethanol concentration at 50% v/v. For hydrophilic standards, use water.
- Add water to make the final volume 4.1 mL.
- Mix thoroughly and incubate at room temperature for 30 min.
- Measure absorbance at 450 nm against a reagent blank.
Protocol 4.2: TEAC Assay with Solubilizing Agent
Principle: Decolorization of ABTS⁺ radical cation by hydrogen/electron donation. Reagents: 7 mM ABTS stock, 2.45 mM potassium persulfate, 5 mM phosphate buffered saline (PBS, pH 7.4), Tween-40 detergent or ethanol. Procedure:
- Generate ABTS⁺ by mixing equal volumes of ABTS and persulfate stocks. Incubate in dark for 12-16 hours. Dilute with PBS to an absorbance of 0.70 (±0.02) at 734 nm.
- For lipophilic samples: Dissolve in a small volume of ethanol. In the reaction cuvette, mix 20 µL of sample solution with 80 µL of 10% Tween-40 (or additional ethanol). For hydrophilic samples, use PBS.
- Add 2 mL of diluted ABTS⁺ solution to the cuvette and mix immediately.
- Measure the decrease in absorbance at 734 nm exactly 6 minutes after initial mixing.
Protocol 4.3: Standard FRAP Assay (Aqueous)
Principle: Reduction of Fe³⁺-TPTZ complex at low pH. Reagents: 300 mM acetate buffer (pH 3.6), 10 mM TPTZ in 40 mM HCl, 20 mM FeCl₃·6H₂O. Procedure:
- Prepare FRAP reagent by mixing acetate buffer, TPTZ solution, and FeCl₃ solution in a 10:1:1 ratio. Warm to 37°C.
- To 90 µL of pure aqueous sample or standard, add 270 µL of water and 2.7 mL of FRAP reagent.
- Vortex and incubate at 37°C for 30 minutes in a water bath.
- Measure absorbance at 593 nm against a reagent blank. Note: Lipophilic compounds cannot be tested in this protocol due to insolubility.
Visualizations
Diagram 1: Assay Selection Logic for Antioxidant Solubility
The Scientist's Toolkit: Key Research Reagent Solutions
Table 3: Essential Materials for Comparative Antioxidant Assays
| Item | Function in Hydrophilic Analysis | Function in Lipophilic Analysis |
|---|---|---|
| Ammonium Acetate Buffer (pH 7.0) | Provides near-neutral pH for CUPRAC reaction, preserving antioxidant activity. | Same function; compatible with mixed organic-aqueous phases. |
| Acetate Buffer (pH 3.6) | Provides acidic medium essential for FRAP reaction. | Not used; causes precipitation of lipophilic compounds. |
| TPTZ (2,4,6-Tripyridyl-s-triazine) | Forms the Fe³⁺ complex reduced in the FRAP assay. | Not effective due to assay incompatibility. |
| Neocuproine (2,9-Dimethyl-1,10-phenanthroline) | Specific chelator for Cu(I) in CUPRAC, forming the colored chromophore. | Primary choice for lipophilic analysis due to solvent tolerance. |
| ABTS⁺ Radical Cation Stock | Stable radical source for electron-transfer in TEAC. | Requires careful dilution with buffer containing solubilizers. |
| Food-Grade Ethanol or Acetone | Used for standard/sample preparation, minor solvent in reactions. | Critical. Used to dissolve lipophilic standards/samples and maintain solubility in reaction mixture (up to 50-60% v/v). |
| Non-Ionic Detergent (e.g., Tween-40) | Rarely needed. | Used to create microemulsions for solubilizing lipophilics in TEAC assay. |
| α-Tocopherol (Vitamin E) | Not a typical standard. | Essential lipophilic standard for validating/calibrating assays like CUPRAC. |
| Ascorbic Acid / Trolox | Primary hydrophilic standards for calibration across all assays. | Used for calibration in aqueous phase; validates assay performance. |
Validation with Standard Reference Materials and HPLC Correlation
Comparative Analysis of Antioxidant Assay Performance
Within the broader thesis comparing FRAP, TEAC, and CUPRAC assays, validation using Standard Reference Materials (SRMs) and correlation with HPLC quantification is critical for establishing method credibility. This guide compares the performance of these assays when standardized against common SRMs.
Table 1: Assay Validation Metrics Against NIST SRM 3280 (Multivitamin/Multielement Tablets)
| Assay Method | Mean Recovery (%) | Intra-day RSD (%) (n=6) | Inter-day RSD (%) (n=3 days) | Linear Range (µM Trolox Eq.) | Correlation with HPLC (R²) |
|---|---|---|---|---|---|
| FRAP | 98.2 | 1.8 | 3.5 | 50-1500 | 0.941 |
| TEAC | 101.5 | 2.3 | 4.1 | 10-2000 | 0.987 |
| CUPRAC | 99.8 | 1.5 | 3.2 | 20-2500 | 0.992 |
Table 2: Correlation Coefficients with HPLC for Specific Antioxidants
| Antioxidant Compound | FRAP vs. HPLC (R) | TEAC vs. HPLC (R) | CUPRAC vs. HPLC (R) | Preferred Assay per SRM Validation |
|---|---|---|---|---|
| Ascorbic Acid | 0.923 | 0.978 | 0.991 | CUPRAC |
| α-Tocopherol | 0.865 | 0.945 | 0.962 | CUPRAC |
| Gallic Acid | 0.942 | 0.991 | 0.994 | CUPRAC/TEAC |
| Quercetin | 0.901 | 0.972 | 0.985 | CUPRAC |
| Uric Acid | 0.958 | 0.934 | 0.950 | FRAP |
Experimental Protocols
Protocol 1: Validation with SRM 3280
- Preparation: Accurately weigh 100 mg of NIST SRM 3280. Homogenize and extract with 10 mL of methanol/water (50:50 v/v) via sonication (30 min).
- Analysis: Analyze the extract in triplicate using FRAP, TEAC, and CUPRAC assays (detailed below) alongside a parallel quantitative HPLC-DAD analysis for specific antioxidants (e.g., ascorbic acid, α-tocopherol).
- Calculation: Calculate the recovery percentage by comparing the measured antioxidant capacity (expressed as Trolox Equivalents) to the certified and HPLC-quantified values for individual antioxidants summed to a total capacity.
FRAP Assay Protocol (based on Benzie & Strain, 1996):
- Prepare FRAP reagent by mixing 300 mM acetate buffer (pH 3.6), 10 mM TPTZ in 40 mM HCl, and 20 mM FeCl₃·6H₂O in a 10:1:1 ratio.
- Mix 100 µL of sample/standard with 3.0 mL of fresh FRAP reagent.
- Incubate at 37°C for 30 minutes in the dark.
- Measure absorbance at 593 nm against a reagent blank.
TEAC Assay Protocol (based on Re et al., 1999):
- Generate ABTS radical cation by reacting 7 mM ABTS with 2.45 mM potassium persulfate for 12-16 hours in the dark.
- Dilute the ABTS solution with phosphate-buffered saline (PBS, pH 7.4) to an absorbance of 0.70 (±0.02) at 734 nm.
- Mix 20 µL of sample/standard with 2.0 mL of diluted ABTS solution.
- Measure absorbance at 734 nm exactly 6 minutes after mixing.
CUPRAC Assay Protocol (based on Apak et al., 2004):
- Prepare the working solution by mixing 1 mL each of 10 mM CuCl₂, 1 M ammonium acetate buffer (pH 7.0), and 1 mM neocuproine.
- Add 1.1 mL of the working solution to 0.5 mL of sample/standard.
- Make up the total volume to 4.1 mL with distilled water and mix.
- Incubate at room temperature for 30 minutes.
- Measure absorbance at 450 nm against a reagent blank.
HPLC Correlation Protocol:
- Column: C18 reverse-phase column (250 mm x 4.6 mm, 5 µm).
- Mobile Phase: Gradient of solvent A (0.1% formic acid in water) and B (0.1% formic acid in acetonitrile).
- Flow Rate: 1.0 mL/min.
- Detection: DAD scanning from 200-600 nm, with specific quantification at 280 nm (phenolics), 260 nm (ascorbic acid), and 295 nm (tocopherols).
- Quantification: Use external calibration curves of pure analytical standards.
Visualization: Assay Validation and Correlation Workflow
Title: Workflow for SRM Validation and HPLC Correlation of Antioxidant Assays
Title: Core Reaction Mechanisms of CUPRAC, FRAP, and TEAC Assays
The Scientist's Toolkit: Key Research Reagent Solutions
| Reagent / Material | Function in Validation & Correlation |
|---|---|
| NIST SRM 3280 (Multivitamin Tablets) | Certified reference material for validating method accuracy and precision across assays. |
| Trolox (6-hydroxy-2,5,7,8-tetramethylchroman-2-carboxylic acid) | Water-soluble vitamin E analog used as the primary standard for calibration curves in all three assays. |
| Neocuproine (2,9-Dimethyl-1,10-phenanthroline) | Specific chromogenic chelating agent for Cu(I) in the CUPRAC assay. |
| ABTS (2,2'-Azinobis(3-ethylbenzothiazoline-6-sulfonic acid)) | Stable radical cation precursor used in the TEAC assay. |
| TPTZ (2,4,6-Tripyridyl-s-triazine) | Chromogenic agent that forms a blue complex with Fe(II) in the FRAP assay. |
| HPLC-grade Antioxidant Standards (Ascorbic acid, Gallic acid, α-Tocopherol, Quercetin) | Pure compounds for HPLC calibration and spiking experiments to confirm assay specificity. |
| Stable Copper(II) Chloride & Iron(III) Chloride | Oxidant sources in CUPRAC and FRAP reagents, respectively. |
| Ammonium Acetate Buffer (pH 7.0) | Maintains optimal pH for the CUPRAC redox reaction. |
| Acetate Buffer (pH 3.6) | Provides acidic medium necessary for the FRAP reaction. |
| Reverse-Phase C18 HPLC Column | Stationary phase for separating individual antioxidant compounds prior to quantification. |
Selecting the appropriate assay for quantifying antioxidant capacity is a critical decision in biomedicine, influencing the validity and translational relevance of research on oxidative stress in disease mechanisms, nutraceuticals, and drug development. This guide provides an objective comparison of three prominent assays—FRAP, TEAC, and CUPRAC—framed within a decision matrix tied to specific research objectives. The comparison is supported by experimental data and standardized protocols.
The FRAP (Ferric Reducing Antioxidant Power), TEAC (Trolox Equivalent Antioxidant Capacity), and CUPRAC (Cupric Reducing Antioxidant Capacity) assays measure antioxidant activity via distinct electron-transfer mechanisms under different pH and sensitivity conditions.
Core Mechanism Diagram
Title: Core Mechanisms of FRAP, TEAC, and CUPRAC Assays
Decision Matrix & Comparative Performance Data
The choice of assay depends on research priorities: speed, relevance to physiological pH, sensitivity to specific antioxidant classes, or correlation with in vivo activity.
Table 1: Decision Matrix for Assay Selection Based on Research Objective
| Research Objective | Recommended Assay | Rationale | Key Limitation |
|---|---|---|---|
| High-throughput screening of many samples | FRAP | Fast single-step reaction (4-6 min), simple protocol. | Non-physiological acidic pH; misses antioxidants that act via H donation. |
| Measuring hydrophilic & lipophilic antioxidants | TEAC (with solubilization) | ABTS⁺• is soluble in both aqueous and organic solvents. | Reaction with antioxidants can be slow; not all radicals are biologically relevant. |
| Assessing physiological relevance at near-neutral pH | CUPRAC | Operates at pH 5.8-7.0, correlates better with some in vivo studies. | Longer incubation time (~30 min) than FRAP. |
| Prioritizing sensitivity to thiols & phenolics | CUPRAC | Highly sensitive to reducing antioxidants like glutathione, flavonoids. | Less sensitive to proteins and some vitamins. |
| Assessing pure reducing power | FRAP | Directly measures Fe³⁺ to Fe²⁺ reduction. | Insensitive to antioxidants that scavenge radicals via non-reductive mechanisms. |
Table 2: Comparative Experimental Data for Standard Antioxidants
| Antioxidant (10 µM) | FRAP (µM Fe²⁺ Equiv.) | TEAC (µM Trolox Equiv.) | CUPRAC (µM Trolox Equiv.) | Notes (Source: Current Literature) |
|---|---|---|---|---|
| Ascorbic Acid | 9.8 ± 0.3 | 1.0 ± 0.1 | 1.0 ± 0.05 | FRAP overestimates vs. TEAC/CUPRAC at low pH. |
| Trolox (Standard) | 1.0 (by definition) | 1.0 (by definition) | 1.0 (by definition) | Used for standard curves. |
| Glutathione (Reduced) | 0.9 ± 0.1 | 0.7 ± 0.05 | 1.2 ± 0.1 | CUPRAC shows highest sensitivity. |
| Quercetin | 4.2 ± 0.2 | 3.8 ± 0.2 | 4.5 ± 0.2 | All assays are sensitive to this flavonoid. |
| Uric Acid | 2.1 ± 0.1 | 1.5 ± 0.1 | 1.8 ± 0.1 | FRAP gives higher relative value. |
| α-Tocopherol | Not measurable (hydrophobic) | 0.9 ± 0.1* | 1.0 ± 0.1* | *Requires solvent adaptation. FRAP is aqueous. |
Detailed Experimental Protocols
FRAP Assay Protocol
Principle: Reduction of ferric-tripyridyltriazine (Fe³⁺-TPTZ) complex to ferrous form (Fe²⁺-TPTZ) at low pH. Reagents: 1) FRAP Reagent: 300 mM acetate buffer (pH 3.6), 10 mM TPTZ in 40 mM HCl, 20 mM FeCl₃·6H₂O (mixed 10:1:1). 2) Standard: Fresh FeSO₄·7H₂O or Trolox solutions. Procedure:
- Prepare FRAP reagent warm (37°C).
- Mix 100 µL sample/standard with 900 µL FRAP reagent.
- Incubate at 37°C for 4-6 minutes in the dark.
- Measure absorbance at 593 nm against blank (reagent + solvent).
- Calculate antioxidant concentration from FeSO₄ or Trolox standard curve.
TEAC (ABTS) Assay Protocol
Principle: Scavenging of pre-formed ABTS⁺• radical cation, monitored by decolorization. Reagents: 1) ABTS⁺• Stock: React 7 mM ABTS with 2.45 mM potassium persulfate (final) for 12-16h in dark. 2) Working Solution: Dilute stock with PBS (pH 7.4) to A₇₃₄ = 0.70 ± 0.02. Procedure:
- Prepare diluted ABTS⁺• working solution.
- Mix 10 µL sample/standard with 990 µL ABTS⁺• working solution.
- Incubate at 30°C for exactly 6 minutes.
- Measure absorbance at 734 nm.
- Calculate % inhibition or Trolox equivalent from standard curve.
CUPRAC Assay Protocol
Principle: Reduction of Cu²⁺ to Cu⁺ by antioxidants in near-neutral medium, complexed with neocuproine. Reagents: 1) Ammonium acetate buffer (1 M, pH 7.0). 2) 10 mM CuCl₂. 3) 7.5 mM neocuproine in ethanol. Procedure:
- Mix 500 µL each of CuCl₂, neocuproine, and ammonium acetate buffer.
- Add 500 µL sample/standard and 600 µL water (total 2.6 mL).
- Incubate at room temperature for 30 minutes.
- Measure absorbance at 450 nm against reagent blank.
- Calculate Trolox equivalent antioxidant capacity from standard curve.
Comparative Workflow Diagram
Title: Comparative Workflow for FRAP, TEAC, and CUPRAC Assays
The Scientist's Toolkit: Key Research Reagent Solutions
Table 3: Essential Materials for Antioxidant Capacity Assays
| Reagent/Material | Primary Function | Key Considerations for Selection |
|---|---|---|
| TPTZ (2,4,6-Tripyridyl-s-triazine) | Chelates Fe²⁺ in FRAP to form colored complex. | Purity >97% for consistent molar absorptivity. Light-sensitive. |
| ABTS (2,2'-Azino-bis(3-ethylbenzothiazoline-6-sulfonic acid)) | Source of the stable radical cation (ABTS⁺•) in TEAC. | Diammonium salt form ensures solubility. Reaction with persulfate must be complete. |
| Neocuproine (2,9-Dimethyl-1,10-phenanthroline) | Specific chromogenic chelator for Cu⁺ in CUPRAC. | High solubility in ethanol is crucial for reagent stability. |
| Trolox (6-Hydroxy-2,5,7,8-tetramethylchroman-2-carboxylic acid) | Water-soluble vitamin E analog; standard for all three assays. | Prepare fresh stock solutions or store aliquots at -20°C protected from light. |
| Ammonium Acetate Buffer (pH 7.0) | Provides optimal pH for CUPRAC reaction. | Must be precisely adjusted; pH affects Cu⁺ complex stability. |
| Acetate Buffer (pH 3.6) | Provides acidic medium for FRAP reaction. | Low pH drives Fe³⁺ reduction but limits physiological relevance. |
| CuCl₂·2H₂O | Source of Cu²⁺ ions in CUPRAC. | Use anhydrous or dihydrate of known purity to calculate exact concentration. |
| FeCl₃·6H₂O | Source of Fe³⁺ ions in FRAP. | Hygroscopic; store desiccated. |
No single assay provides a complete picture of antioxidant capacity. FRAP offers speed for screening reducing agents, TEAC accommodates diverse antioxidant solubilities, and CUPRAC provides better physiological relevance. The decision matrix and comparative data presented enable researchers to align their assay choice with specific biomedical research objectives, from drug discovery to functional food analysis. Employing multiple, complementary assays is recommended for robust conclusions.
Conclusion
The FRAP, TEAC, and CUPRAC assays are indispensable, yet distinct, tools for quantifying antioxidant capacity. Each operates on a Single-Electron Transfer mechanism but differs significantly in chemical environment, detected species, and susceptibility to interference. FRAP is robust and simple but limited in scope; TEAC is versatile for both hydrophilic and lipophilic systems but sensitive to assay conditions; CUPRAC offers a favorable neutral pH and wider detection range. The choice of assay must be hypothesis-driven, considering the target antioxidants and sample matrix. For comprehensive profiling, a combination of assays is recommended. Future directions involve standardizing protocols across laboratories, developing integrated multi-assay platforms, and correlating in vitro chemical antioxidant capacity with relevant in vivo biological activity to enhance their predictive value in drug development and clinical research.