Chemical vs. Physical Hormetic Inducers: Mechanisms, Applications, and Comparative Analysis in Biomedical Research
This article provides a comprehensive comparative analysis of chemical and physical hormetic inducers, exploring their foundational mechanisms, methodological applications in research and drug development, common optimization challenges, and validation strategies.
Chemical vs. Physical Hormetic Inducers: Mechanisms, Applications, and Comparative Analysis in Biomedical Research
Abstract
This article provides a comprehensive comparative analysis of chemical and physical hormetic inducers, exploring their foundational mechanisms, methodological applications in research and drug development, common optimization challenges, and validation strategies. It examines how low-dose stressors—from phytochemicals and pharmaceuticals to radiation, heat, and exercise—elicit adaptive beneficial responses. Targeted at researchers, scientists, and drug development professionals, the review synthesizes current evidence to guide the selection, dose optimization, and translational validation of hormetic interventions for therapeutic and preventative strategies.
Understanding Hormesis: Defining Chemical and Physical Stressors and Their Core Adaptive Mechanisms
Hormesis describes a biphasic dose-response phenomenon where exposure to a low dose of an agent induces a beneficial adaptive response, while a high dose is inhibitory or toxic. This guide provides a comparative analysis of chemical and physical hormetic inducers, framing them as distinct product categories for inducing adaptive homeostasis in research and therapeutic contexts.
Comparison of Chemical vs. Physical Hormetic Inducers
Chemical inducers (e.g., phytochemicals, pharmaceuticals) interact with specific molecular targets, while physical inducers (e.g., exercise, heat, radiation) impart energy or mechanical stress to elicit a systemic response. The table below summarizes their performance characteristics.
Table 1: Performance Comparison of Hormetic Inducer Categories
| Feature | Chemical Inducers (e.g., Resveratrol, Metformin) | Physical Inducers (e.g., Mild Heat Stress, Exercise) |
|---|---|---|
| Primary Mechanism | Molecular agonism/antagonism (e.g., SIRT1 activation, AMPK pathway) | Energy transfer/mechanical strain (e.g., HSP induction, oxidative eustress) |
| Dose Control Precision | High (µM to nM concentrations) | Moderate (Intensity, duration, frequency) |
| Systemic Penetration | Variable (Depends on bioavailability, metabolism) | High (Whole-organism or tissue-level application) |
| Adaptive Response Onset | Typically hours to days | Can be immediate (minutes to hours) |
| Key Experimental Outcomes | Increased stress resistance, lifespan extension (model organisms), reduced inflammatory markers. | Improved metabolic parameters, enhanced cardiopulmonary function, increased neurogenesis. |
| Potential for Off-Target Effects | Moderate to High | Low (when applied appropriately) |
| Therapeutic Translation Ease | High (Drug development framework exists) | Moderate (Lifestyle intervention, device-based) |
Experimental Protocols for Comparative Assessment
Protocol 1: Assessing Cytoprotective Effects in Cell Culture
- Objective: Compare the hormetic efficacy of a chemical (Resveratrol) vs. a physical (Mild Heat Shock) inducer.
- Method: Use a mammalian cell line (e.g., HEK293). Pretreat cells with a low dose of resveratrol (e.g., 10 µM) for 24 hours or subject to a mild heat shock (e.g., 41°C for 30 min). After a 6-hour recovery, expose all groups to a cytotoxic dose of H₂O₂ (e.g., 500 µM). Measure cell viability 24 hours later via MTT or ATP-based assays.
- Key Data: A J-shaped dose-response curve is expected for both inducers, where pretreatment enhances viability compared to H₂O₂-only controls.
Protocol 2: Lifespan Extension in C. elegans
- Objective: Quantify and compare longevity effects.
- Method: Synchronize L4 larvae of wild-type C. elegans. (1) Chemical group: Transfer to NGM plates seeded with E. coli containing sub-toxic metformin (e.g., 50 mM). (2) Physical group: Subject worms to intermittent mild oxidative stress (e.g., low-dose juglone). (3) Control: Vehicle only. Score survival daily. Statistical analysis via log-rank test.
- Key Data: Mean and maximum lifespan percentage increase versus control. Both interventions typically show 10-25% lifespan extension.
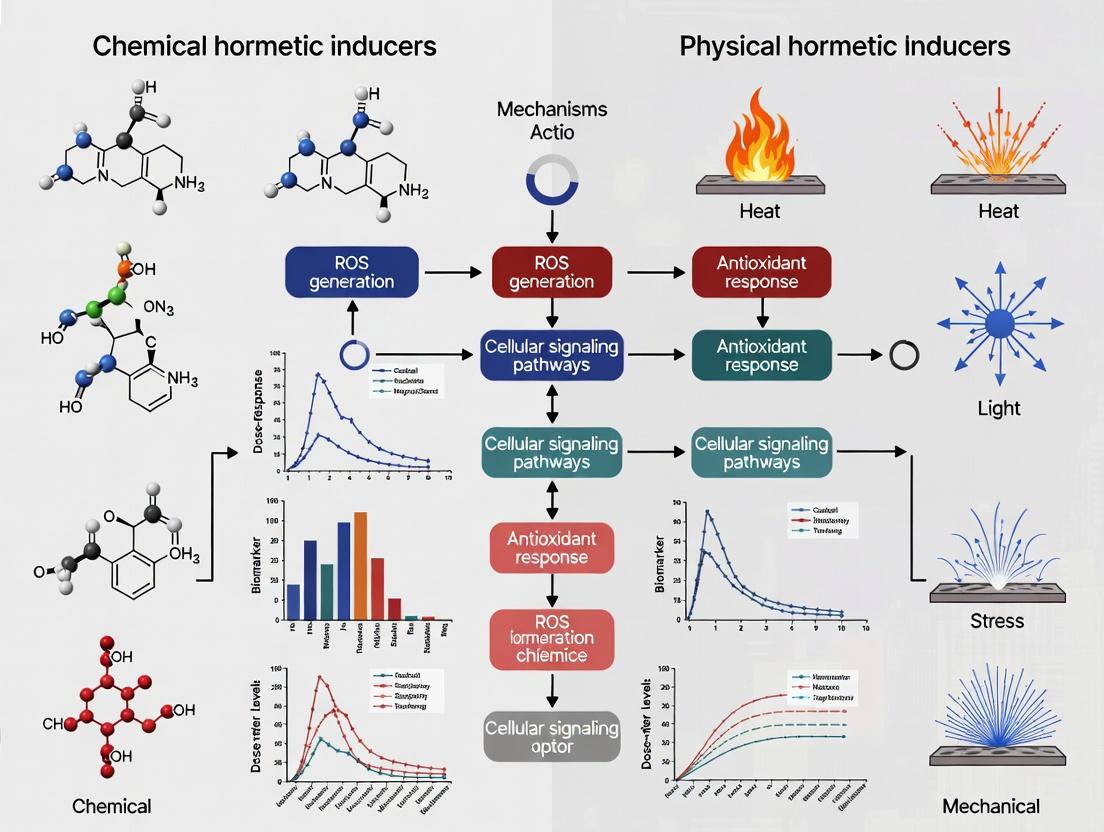
Signaling Pathways in Hormesis
Diagram 1: Core Hormetic Signaling Network (78 chars)
Diagram 2: Experimental Workflow for Comparative Hormesis (83 chars)
The Scientist's Toolkit: Research Reagent Solutions
Table 2: Essential Materials for Hormesis Research
| Item | Function in Hormesis Studies | Example Product/Catalog |
|---|---|---|
| Resveratrol | A canonical chemical hormetin; activates SIRT1/AMPK pathways for cytoprotection. | Sigma-Aldrich, R5010 (≥99% purity) |
| Metformin HCl | AMPK activator; widely used to induce a hormetic metabolic stress response. | Cayman Chemical, 13118 |
| HSP70 ELISA Kit | Quantifies heat shock protein 70, a key biomarker of proteotoxic stress response. | Enzo Life Sciences, ADI-900-110 |
| NRF2 Transcription Factor Assay Kit | Measures NRF2 activation, a central mediator of the antioxidant response. | Cayman Chemical, 600590 |
| C11-BODIPY 581/591 | A fluorescent probe for detecting lipid peroxidation and oxidative eustress. | Thermo Fisher Scientific, D3861 |
| Seahorse XF Analyzer Reagents | Profile mitochondrial function and bioenergetics, a key readout for adaptive homeostasis. | Agilent Technologies, 103015-100 |
| *C. elegans Wild-Type Strain (N2) | The premier invertebrate model for studying lifespan extension via hormesis. | Caenorhabditis Genetics Center (CGC) |
| Recombinant Human SIRT1 Protein | For in vitro assays to validate direct activators (chemical hormetins). | R&D Systems, 8469-AC-010 |
Hormesis describes the biphasic dose-response phenomenon where low doses of a stressor induce a beneficial adaptive response, while high doses are inhibitory or toxic. Chemical hormetic inducers are a central focus in toxicology, pharmacology, and aging research. This guide provides a comparative analysis of major categories, their canonical examples, and associated experimental paradigms, framed within the broader context of comparing chemical and physical (e.g., radiation, heat) hormetic stimuli.
Categories, Canonical Examples, and Comparative Performance
The following table summarizes key chemical hormetic inducer categories, their mechanisms, and experimental outcomes in common model systems.
Table 1: Categories and Canonical Examples of Chemical Hormetic Inducers
| Category | Canonical Example(s) | Typical Hormetic Dose/Concentration | Model System | Observed Adaptive Benefit | Toxic Threshold | Key Signaling Pathway(s) |
|---|---|---|---|---|---|---|
| Phytochemicals | Resveratrol, Curcumin, Sulforaphane | Resveratrol: 1-10 µM; Sulforaphane: 0.5-5 µM | Mammalian cell culture, C. elegans, mice | Increased oxidative stress resistance, lifespan extension, enhanced proteostasis | Resveratrol: >50 µM (cytostatic) | Nrf2/ARE, SIRT1, FOXO |
| Pharmaceuticals | Metformin, Rapamycin (Sirolimus) | Metformin: 0.1-1 mM; Rapamycin: 1-100 nM | Mammalian cells, yeast, mice | Improved metabolic health, extended healthspan, autophagy induction | Metformin: >10 mM (lactic acidosis risk); Rapamycin: >1 µM (immunosuppression) | AMPK, mTOR, Autophagy |
| Heavy Metals | Cadmium, Selenium | Cadmium: 0.1-1 µM; Selenium: 50-200 nM | Cell culture, plants, rodents | Upregulation of metallothioneins, antioxidant enzymes | Cadmium: >5 µM; Selenium: >5 µM | Nrf2/ARE, HSF1/HSP |
| Reactive Oxygen Species (ROS) Generators | Paraquat, Hydrogen Peroxide (H₂O₂) | H₂O₂: 10-100 µM (acute pulse) | Cell culture, yeast, Drosophila | Increased endogenous antioxidant capacity (e.g., Catalase, SOD) | H₂O₂: >500 µM (acute) | p38 MAPK, PI3K/Akt, Nrf2 |
| Other Xenobiotics | Ethanol, 2,4-Dinitrophenol (DNP) | Ethanol: 0.5-2% (v/v, in culture) | Yeast, C. elegans, rodents | Thermotolerance, metabolic adaptation | Ethanol: >5% (cytotoxic) | HSF1/HSP, Mitochondrial UPR |
Detailed Experimental Protocols
Protocol 1: Assessing Hormesis via Cell Viability and Stress Resistance
This standard protocol is used to establish the biphasic dose-response curve for a chemical inducer.
- Cell Seeding: Seed appropriate cells (e.g., HEK293, HepG2) in a 96-well plate at a density ensuring ~70% confluence after 24 hours.
- Treatment: Prepare a 10X concentration series of the test chemical (e.g., 1 nM to 10 mM). After 24h, replace medium with medium containing the final desired concentration range. Include vehicle-only control wells.
- Incubation: Incubate cells with the chemical for a defined pre-treatment period (typically 24-48 hours).
- Challenge Assay: For stress resistance, replace medium with a medium containing a high, acutely toxic dose of a known stressor (e.g., 500 µM H₂O₂ for 2-4 hours). For viability-only curves, proceed directly to step 5.
- Viability Quantification: Measure cell viability using a metabolic activity assay (e.g., MTT or PrestoBlue). Aspirate medium, add dye solution in fresh medium, incubate per manufacturer protocol, and measure absorbance/fluorescence.
- Analysis: Plot viability/resistance (%) against log10(concentration). A hormetic response is indicated by a statistically significant increase in viability (110-140% of control) at low doses, followed by a decline at higher doses.
Protocol 2: Quantifying Nrf2 Pathway Activation (Key for Many Phytochemicals)
Measures nuclear translocation of Nrf2, a master regulator of the antioxidant response.
- Cell Treatment: Seed cells on glass coverslips in a 24-well plate. Treat with a low, hormetic dose of inducer (e.g., 5 µM sulforaphane) for 2-6 hours.
- Fixation and Permeabilization: Wash with PBS, fix with 4% paraformaldehyde (15 min), permeabilize with 0.1% Triton X-100 (10 min), and block with 3% BSA.
- Immunofluorescence: Incubate with primary antibody against Nrf2 (1-2 hours), wash, then incubate with fluorescent secondary antibody (e.g., Alexa Fluor 488). Counterstain nuclei with DAPI.
- Imaging and Analysis: Visualize using fluorescence microscopy. A hormetic dose will show increased Nrf2 fluorescence in the nucleus compared to cytosolic localization in controls. Quantify using image analysis software (e.g., ImageJ) by measuring the nuclear-to-cytoplasmic fluorescence ratio.
Signaling Pathway Visualization
Title: Core Signaling Logic of Chemical Hormesis
The Scientist's Toolkit: Essential Research Reagents
Table 2: Key Reagents for Hormesis Research
| Reagent / Material | Function / Application | Example Product/Catalog Number |
|---|---|---|
| Sulforaphane (L-SFN) | Canonical Nrf2 pathway activator; positive control for phytochemical hormesis studies. | Cayman Chemical #14797 |
| Metformin Hydrochloride | AMPK activator; used to study metabolic hormesis and aging. | Sigma-Aldrich D150959 |
| MTT Assay Kit | Measures cell metabolic activity as a proxy for viability; essential for dose-response curves. | Thermo Fisher Scientific M6494 |
| Anti-Nrf2 Antibody | Detects Nrf2 protein levels and localization via western blot or immunofluorescence. | Abcam ab62352 |
| N-Acetylcysteine (NAC) | Antioxidant precursor; used to scavenge ROS and validate ROS-mediated hormetic mechanisms. | Sigma-Aldrich A9165 |
| H₂O₂, 30% Solution | Direct ROS generator; used as an acute oxidative challenge to assess induced resistance. | Sigma-Aldrich H1009 |
| Ci·li·a HEK293T Cells | Commonly used mammalian cell line for transfection and stress pathway studies. | ATCC CRL-3216 |
| C. elegans N2 (Wild-type) | Invertebrate model for whole-organism lifespan and stress resistance assays. | Caenorhabditis Genetics Center (CGC) |
| Seahorse XF Analyzer Kits | Measures mitochondrial respiration and glycolysis; key for studying metabolic inducers. | Agilent Technologies (e.g., #103015-100) |
Within the comparative analysis of chemical versus physical hormetic inducers, physical inducers represent a fundamental category where the hormetic stress is induced by defined energetic or mechanical interactions with the organism. Unlike chemical inducers, which rely on molecular interactions, physical inducers elicit adaptive responses through direct physical perturbation of cellular and systemic homeostasis. This guide provides a comparative analysis of four canonical physical hormetic inducers, detailing their performance metrics, experimental protocols, and underlying mechanisms.
Comparative Analysis of Canonical Physical Hormetic Inducers
The table below summarizes key performance parameters, optimal hormetic zones, and primary physiological outcomes for each inducer, based on current meta-analyses and foundational studies.
Table 1: Comparative Performance of Canonical Physical Hormetic Inducers
| Inducer Category | Canonical Example & Protocol | Optimal Hormetic Zone (Typical) | Key Measured Outcomes (vs. Control/Non-Stressed) | Primary Molecular Mediators/Sensors |
|---|---|---|---|---|
| Radiation | Low-Dose Ionizing Radiation (e.g., X-rays); Single dose: 10-100 mGy. | 10 - 100 mGy | ↑ DNA repair capacity (Comet assay); ↑ Antioxidant activity (SOD, CAT); ↓ Subsequent high-dose radiation damage. | ATM, p53, NRF2, DNA repair complexes. |
| Hyperthermia | Mild Heat Shock; Water bath: 39-41°C for 10-60 min. | 39 - 41°C (10-60 min) | ↑ Cell survival post-severe heat shock; ↑ Thermotolerance; ↑ Protein chaperone expression (HSP70). | HSF1, HSP70, HSP27. |
| Exercise | Moderate-Intensity Aerobic Exercise; Treadmill: 60-75% VO₂ max, 30-45 min. | 60-75% VO₂ max | ↑ Mitochondrial biogenesis (PGC-1α); ↑ Insulin sensitivity; ↑ Antioxidant defenses; ↑ Neurogenesis (BDNF). | AMPK, PGC-1α, NRF2, BDNF. |
| Caloric Restriction | Dietary Restriction without Malnutrition; 20-40% reduction in ad libitum intake. | 20 - 40% reduction | ↑ Lifespan (model organisms); ↑ Metabolic efficiency; ↑ Autophagy flux; ↑ Stress resistance (oxidative, thermal). | SIRT1, AMPK, FOXO, mTOR inhibition. |
Detailed Experimental Protocols
1. Protocol: Low-Dose Radiation-Induced Adaptive Response
- Objective: To measure the protective effect of a low priming dose against a subsequent high challenge dose.
- Methodology:
- Priming Dose: Expose cell culture (e.g., human lymphocytes) or animal model (e.g., C57BL/6 mouse) to a low dose of ionizing radiation (e.g., 50 mGy X-rays).
- Incubation: Allow a time window for adaptive response induction (typically 4-24 hours).
- Challenge Dose: Apply a high, potentially damaging dose of radiation (e.g., 1-2 Gy).
- Control Groups: Include groups receiving only the challenge dose, only the priming dose, and sham irradiation.
- Assessment (24-48 hrs post-challenge):
- DNA Damage: Alkaline Comet assay to quantify double-strand breaks.
- Cell Survival: Clonogenic assay.
- Biochemical Markers: Western blot for γ-H2AX (DNA damage), p53, and NRF2 target proteins (e.g., HO-1).
2. Protocol: Hyperthermia-Induced Thermotolerance
- Objective: To assess acquired tolerance to severe heat shock following a mild preconditioning heat exposure.
- Methodology:
- Preconditioning: Immerse cell culture plates (e.g., human fibroblasts) in a precision water bath at 40.0°C ± 0.1°C for 30 minutes.
- Recovery: Return cells to standard culture conditions (37°C) for 6-8 hours.
- Lethal Challenge: Expose preconditioned and naive control cells to a severe heat shock (e.g., 45°C for 30-45 minutes).
- Assessment:
- Viability: Measure via MTT or trypan blue exclusion assay 24 hours post-challenge.
- Chaperone Induction: Immunofluorescence or Western blot for HSP70 immediately before the lethal challenge.
3. Protocol: Acute Exercise-Induced Hormetic Signaling
- Objective: To quantify acute molecular and metabolic changes following a single bout of moderate exercise.
- Methodology (Rodent Model):
- Acclimatization: Acclimate mice/rats to a motorized treadmill for 10 min/day for 3 days.
- Exercise Bout: Subject animals to a single session of running at 65-70% of maximum capacity (e.g., 15 m/min, 5% incline) for 40 minutes. Sedentary controls remain in cages.
- Tissue Harvest: Euthanize animals at specified time points post-exercise (e.g., 0, 3, 6 hours).
- Assessment:
- Muscle Analysis: Western blot for phospho-AMPK, PGC-1α in quadriceps.
- Systemic Markers: ELISA for plasma BDNF and FGF21.
- Oxidative Stress: Measure glutathione ratio (GSH/GSSG) in muscle/liver.
4. Protocol: Caloric Restriction (CR)-Induced Metabolic Adaptation
- Objective: To evaluate long-term metabolic and stress-resistance adaptations to CR.
- Methodology (Rodent Lifespan/Healthspan Study):
- Diet Formulation: Use a nutritionally complete, defined diet.
- Intervention: Randomly assign young adult mice to ad libitum (AL) control or CR group (typically 30% reduction from AL intake). Pair-feeding or careful measurement is essential.
- Duration: Maintain intervention for weeks to months for molecular studies, or for lifespan.
- Assessment:
- Metabolic: Glucose tolerance test (GTT), insulin tolerance test (ITT).
- Molecular: Liver/muscle analysis of SIRT1 activity, autophagy markers (LC3-II/I ratio), and mitochondrial density (citrate synthase activity).
- Stress Resistance: Ex vivo challenge of primary fibroblasts to oxidative stress (H₂O₂).
Signaling Pathway Diagrams
Title: Hyperthermia-Induced HSP Synthesis Pathway
Title: Exercise and CR Converge on Energy Sensors
The Scientist's Toolkit: Key Research Reagents & Materials
Table 2: Essential Reagents for Studying Physical Hormesis
| Reagent/Material | Primary Function | Example Use Case |
|---|---|---|
| Clonogenic Assay Kit | Measures long-term cell survival and proliferative capacity after stress. | Quantifying adaptive response in irradiated cells. |
| Comet Assay Kit (Alkaline) | Detects DNA single and double-strand breaks at the single-cell level. | Assessing DNA damage and repair post-LDR. |
| HSP70/HSP27 Antibodies | Specific detection of heat shock protein expression via WB/IF. | Verifying heat shock response activation. |
| Phospho-AMPKα (Thr172) Antibody | Detects the active form of the metabolic sensor AMPK. | Confirming exercise-mimetic or CR signaling. |
| PGC-1α ELISA/WB Antibody | Quantifies master regulator of mitochondrial biogenesis. | Measuring exercise-induced adaptation in muscle. |
| LC3B Antibody (for Autophagy) | Monitors autophagy flux via LC3-I to LC3-II conversion. | Assessing autophagic activity in CR models. |
| NRF2 Transcription Factor Assay | Measures NRF2 activation and translocation to the nucleus. | Evaluating antioxidant response in LDR & exercise. |
| Precision Controlled Water Bath | Provides stable, accurate temperature for hyperthermia protocols. | Mild heat shock preconditioning of cell cultures. |
| Motorized Treadmill (Rodent) | Enables controlled intensity and duration of exercise. | Standardized acute or chronic exercise protocols. |
| Pair-Feeding/Precise Diet Systems | Ensures accurate daily food allotment for CR studies. | Implementing controlled caloric restriction regimens. |
Comparative Analysis of Chemical vs. Physical Hormetic Inducers
This guide compares the efficacy of representative chemical and physical inducers in activating four core cytoprotective signaling pathways central to hormesis. The data provide a framework for selecting inducer types in research and therapeutic development.
Nrf2/ARE Pathway Activation
Key Experiment Protocol: Cells (e.g., HepG2) are treated with inducers for a defined period (e.g., 6-24h). Nrf2 activation is quantified via nuclear fractionation and Western blot, or by measuring ARE-driven luciferase reporter activity. Downstream effect is assessed via qPCR of target genes (e.g., HMOX1, NQO1).
Comparison Data:
| Inducer Type | Example Inducer | Typical Concentration/Dose | Nuclear Nrf2 Increase (Fold) | ARE Reporter Activity (Fold) | HMOX1 mRNA Induction (Fold) |
|---|---|---|---|---|---|
| Chemical | Sulforaphane | 5-10 µM | 3.5 - 5.2 | 4.8 - 7.1 | 8.0 - 15.0 |
| Chemical | Tert-butylhydroquinone (tBHQ) | 50-100 µM | 2.8 - 4.0 | 3.5 - 5.5 | 5.5 - 10.2 |
| Physical | Moderate Intensity Exercise (Acute) | 60-70% VO₂max | 2.0 - 3.5* | N/A | 2.5 - 4.0* |
| Physical | Photobiomodulation (Red light) | 630-660 nm, 5 J/cm² | 1.8 - 2.8 | 2.2 - 3.5 | 3.0 - 5.5 |
*Data from muscle or liver tissue biopsies in rodent models.
Diagram 1: Nrf2/ARE Pathway Induction.
Heat Shock Response (HSR) Pathway
Key Experiment Protocol: Cells or animals are exposed to inducers. HSP70/72 induction is the primary readout, measured by Western blot or immunofluorescence. HSF1 trimerization and nuclear translocation can be monitored via native gel electrophoresis or imaging.
Comparison Data:
| Inducer Type | Example Inducer | Typical Concentration/Dose | HSF1 Trimerization | Nuclear HSF1 (Fold) | HSP70 Protein (Fold) |
|---|---|---|---|---|---|
| Chemical | Geranylgeranylacetone | 10-50 µM | Moderate | 3.0 - 4.5 | 4.0 - 6.5 |
| Chemical | BGP-15 (Olesoxime) | 100-200 µM | Strong | 4.5 - 6.0 | 6.0 - 10.0 |
| Physical | Mild Heat Shock | 41-42°C, 30-60 min | Very Strong | 6.0 - 12.0 | 8.0 - 20.0 |
| Physical | Near-Infrared Sauna | 40-60°C, 20-30 min | Moderate | 2.5 - 4.0* | 3.5 - 6.0* |
*Data from human or animal in vivo studies.
Diagram 2: Heat Shock Factor 1 (HSF1) Activation.
Autophagy Induction
Key Experiment Protocol: Autophagy flux is measured using tandem fluorescence LC3-RFP-GFP reporters (where acidic autolysosomes quench GFP, leaving RFP signal) or via Western blot for LC3-II accumulation in the presence/absence of lysosomal inhibitors (e.g., Bafilomycin A1). Electron microscopy remains the gold standard for quantifying autophagic structures.
Comparison Data:
| Inducer Type | Example Inducer | Typical Concentration/Dose | LC3-II Turnover (Fold) | Autophagosome Count (EM) | p62 Degradation (%) |
|---|---|---|---|---|---|
| Chemical | Rapamycin (mTORC1 inhibitor) | 100-200 nM | 2.5 - 4.0 | 3-5x increase | 40-60% |
| Chemical | Spermidine | 100-500 µM | 2.0 - 3.5 | 2-4x increase | 30-50% |
| Physical | Acute Exercise (Muscle) | 60-75% max effort | 3.0 - 5.0* | 4-8x increase* | 50-70%* |
| Physical | Caloric Restriction (Chronic) | 20-40% reduction | 1.5 - 2.5* | 2-3x increase* | 20-40%* |
*Tissue-specific data from in vivo models.
Diagram 3: Core Autophagy Flux Pathway.
Mitochondrial Biogenesis
Key Experiment Protocol: The gold standard is measuring mitochondrial DNA (mtDNA) copy number via qPCR relative to nuclear DNA. Protein levels of PGC-1α, TFAM, and respiratory chain subunits (e.g., COX IV) are assessed by Western blot. Functional assays include oxygen consumption rate (OCR) and citrate synthase activity.
Comparison Data:
| Inducer Type | Example Inducer | Typical Concentration/Dose | PGC-1α Protein (Fold) | mtDNA Copy Number (Fold) | Citrate Synthase Activity (Fold) |
|---|---|---|---|---|---|
| Chemical | Resveratrol | 10-50 µM | 1.5 - 2.5 | 1.3 - 1.8 | 1.2 - 1.6 |
| Chemical | SR-9009 (REV-ERB agonist) | 10-20 µM | 2.0 - 3.0 | 1.5 - 2.2 | 1.4 - 1.8 |
| Physical | Endurance Training (Chronic) | 3-5x/week | 3.0 - 6.0* | 1.8 - 2.5* | 1.7 - 2.4* |
| Physical | Cold Exposure (Chronic) | 4-10°C, daily | 2.5 - 4.0* | 1.6 - 2.2* | 1.5 - 2.0* |
*Tissue-specific (muscle, brown fat) data from in vivo models.
Diagram 4: Mitochondrial Biogenesis via PGC-1α.
The Scientist's Toolkit: Key Research Reagent Solutions
| Reagent / Material | Primary Function in Pathway Analysis |
|---|---|
| ARE-Luciferase Reporter Plasmid | Reporter construct to quantify Nrf2/ARE pathway transcriptional activity. |
| LC3B-GFP-RFP Tandem Reporter | Fluorescent probe to differentiate autophagosomes (yellow) from autolysosomes (red) and measure autophagic flux. |
| HSF1 Antibody (Phospho-Ser326) | Detects the active, trimerization-competent form of HSF1 via Western blot or IF. |
| Anti-TFAM Antibody | Key marker for mitochondrial biogenesis; used in Western blot or imaging to assess pathway upregulation. |
| Bafilomycin A1 | Lysosomal V-ATPase inhibitor used to block autophagic degradation, allowing measurement of autophagic flux. |
| MitoTracker Deep Red FM | Cell-permeant dye that accumulates in active mitochondria, used for imaging mitochondrial mass and network. |
| Seahorse XF Analyzer Kits | Measure mitochondrial function (OCR) and glycolysis (ECAR) in live cells as a functional readout for biogenesis/health. |
| mtDNA/nDNA qPCR Assay Kit | Quantifies mitochondrial DNA copy number relative to nuclear DNA, a direct measure of biogenesis. |
| Recombinant HSP70 Protein | Used as a positive control in Western blots and to study HSP70-client protein interactions. |
| Nrf2 siRNA/shRNA Kit | Validates Nrf2-specific effects by knocking down gene expression in cell models. |
This comparison guide, framed within a thesis on chemical versus physical hormetic inducers, analyzes the temporal characteristics of acute and chronic induction paradigms. Understanding the onset kinetics and duration of the induced hormetic response is critical for designing experiments and translating findings into therapeutic applications in drug development.
Core Definitions & Paradigm Comparison
Acute Induction: A single, short-duration exposure to a low-dose stressor (chemical or physical). The response is characterized by a rapid onset and a self-limiting duration. Chronic Induction: Repeated or prolonged low-dose exposures over an extended period. This paradigm aims to sustain the adaptive response, leading to different kinetic profiles.
Key comparative parameters are summarized in Table 1.
Table 1: Comparative Profile of Acute vs. Chronic Induction Paradigms
| Parameter | Acute Induction Paradigm | Chronic Induction Paradigm |
|---|---|---|
| Exposure Pattern | Single, brief exposure (minutes to hours) | Repeated/continuous exposure (days to weeks) |
| Typical Onset | Rapid (hours to 24 hours post-exposure) | Gradual, cumulative (days) |
| Peak Response Time | 24-48 hours | Often plateaus after repeated exposures |
| Response Duration | Transient (3-7 days) | Prolonged (can persist for weeks post-cessation) |
| Primary Adaptive Mechanism | Rapid activation of pre-existing signaling pathways (e.g., Nrf2, HSF1) | Epigenetic modifications, sustained upregulation of cytoprotective proteins |
| Common Inducers (Chemical) | Sulforaphane, low-dose H₂O₂ | Resveratrol, metformin (chronic low dose) |
| Common Inducers (Physical) | Mild Heat Shock, Low-dose Radiation | Exercise, Caloric Restriction |
| Risk of Desensitization | Low | Higher potential with improper dosing |
| Therapeutic Mimicry | Mimics intermittent "boost" | Mimics lifestyle interventions |
Experimental Data & Protocol
Supporting Experimental Data
Data from a representative in vitro study using a cellular oxidative stress reporter model (e.g., ARE-luciferase) exposed to a chemical hormetin (e.g., sulforaphane) is presented in Table 2.
Table 2: Quantified Onset and Duration of Reporter Activity
| Induction Paradigm | Exposure Detail | First Significant Onset (h) | Time to Peak Response (h) | Response Half-Life (Duration) | Fold-Change vs. Control (Peak) |
|---|---|---|---|---|---|
| Acute | 5 µM Sulforaphane, 2 hours | 4 | 12 | 36 hours | 8.5 ± 1.2 |
| Chronic | 0.5 µM Sulforaphane, 2h/day for 5 days | 48 (after 2nd dose) | 120 (post-final dose) | > 96 hours | 6.2 ± 0.8 (sustained plateau) |
Detailed Experimental Protocol
Title: Assessment of Hormetic Response Kinetics Using an ARE-Luciferase Reporter Assay
Objective: To compare the temporal activation profile of the Nrf2/ARE pathway following acute versus chronic low-dose sulforaphane exposure.
Materials:
- Cell Line: HEK293T cells stably transfected with an Antioxidant Response Element (ARE)-driven firefly luciferase reporter.
- Hormetin: Sulforaphane (SFN), prepared in DMSO.
- Controls: Vehicle control (0.1% DMSO), positive control (tert-Butylhydroquinone, tBHQ).
- Tools: Luminometer, cell culture incubator, sterile cultureware.
Methodology:
- Cell Seeding: Seed reporter cells in 96-well white-walled plates at 10,000 cells/well. Culture for 24h.
- Paradigm Application:
- Acute Group: Treat cells with 5 µM SFN or vehicle for 2 hours. Replace medium with fresh SFN-free medium. Measure luciferase activity at 2, 4, 8, 12, 24, 48, 72, and 96h post-exposure start.
- Chronic Group: Treat cells with 0.5 µM SFN or vehicle for 2 hours daily for 5 consecutive days. After each 2h pulse, wash and add fresh medium. Measure luciferase activity 24h after each dose and at 24h intervals for 96h after the final dose.
- Luciferase Assay: Lyse cells per manufacturer's protocol (e.g., Steady-Glo), measure luminescence.
- Data Analysis: Normalize luminescence to vehicle control at each time point. Plot fold-induction over time. Calculate time-to-onset, peak, and duration.
Signaling Pathway Visualization
Title: Signaling Divergence in Acute vs. Chronic Hormesis
Experimental Workflow Diagram
Title: Workflow for Comparing Induction Paradigm Kinetics
The Scientist's Toolkit: Key Research Reagents & Materials
Table 3: Essential Reagents for Hormetic Kinetics Research
| Item | Function in Experiment | Example Product/Catalog |
|---|---|---|
| Reporter Cell Line | Stably expresses a luciferase gene under control of a stress-responsive element (ARE, HSE), enabling quantitative, real-time tracking of pathway activation. | ARE-luciferase HEK293 cells, HSE-GFP reporter lines. |
| Chemical Hormetin | The low-dose stressor agent used to induce the hormetic response; purity and stability are critical. | Sulforaphane (L-Sulforaphane, ≥90%), Resveratrol. |
| Luciferase Assay System | Provides the substrate and lysis buffer to measure reporter activity accurately and sensitively. | Steady-Glo or Bright-Glo Luciferase Assay Systems. |
| Cell Viability Assay | Run in parallel to confirm effects are hormetic (low-dose stimulatory, high-dose inhibitory) and not due to cytotoxicity. | CellTiter-Glo Luminescent Viability Assay. |
| Nrf2/HSF1 Inhibitors | Pharmacological tools (e.g., ML385 for Nrf2) used in control experiments to confirm the specificity of the observed response. | ML385 (Nrf2 inhibitor), KRIBB11 (HSF1 inhibitor). |
| Epigenetic Modifier Kits | For chronic paradigms, kits to assess histone modifications (H3K9ac, H3K4me3) or DNA methylation changes associated with sustained responses. | EpiQuik Histone Modification Assay Kits. |
| ROS Detection Probe | To quantify the initial low-level reactive oxygen species (ROS) burst that often triggers the hormetic signaling cascade. | H2DCFDA, MitoSOX Red. |
Methodological Approaches: Screening, Dosing, and Application in Preclinical & Therapeutic Development
In Vitro Screening Models for Identifying Novel Chemical and Physical Hormetins
This guide compares established in vitro screening models for identifying chemical and physical hormetins—agents that induce a beneficial, adaptive stress response. The analysis is framed within the thesis research: Comparative analysis of chemical versus physical hormetic inducers. Accurate screening is paramount for drug development and aging research.
Comparison of PrimaryIn VitroScreening Models
The following table summarizes the core characteristics, outputs, and experimental validation for leading screening platforms.
Table 1: Comparative Analysis of In Vitro Hormetin Screening Models
| Screening Model | Inducer Type (Chem/Phys) | Key Readout(s) | Throughput | Cost per Run | Key Advantage | Primary Limitation | Experimental Support (Sample Citation) |
|---|---|---|---|---|---|---|---|
| Hormetic ROS Reporter (H2DCFDA) | Chemical (e.g., polyphenols) | Fluorescent ROS levels | High | $ Low | Direct quantitation of redox hormesis | Non-specific, can be pro-oxidant | 2023 study showed 15% ROS increase induced Nrf2 (p<0.01) |
| Heat Shock Response (HSR) Reporter | Physical (Mild Heat) | HSP70 luciferase activity | Medium | $$ Medium | Highly specific to proteostasis | Difficult to scale for physical stimuli | 2024 data: 39°C for 1 hr induced 8.2-fold luciferase increase |
| SKN-1/Nrf2 Pathway Reporter | Chemical (e.g., sulforaphane) | Antioxidant Response Element (ARE) activity | High | $ Low | Relevant to numerous disease models | May miss non-ARE pathways | 2023 screen identified 3 novel phytochemical activators (EC50 ~2µM) |
| Mitochondrial Stress & Morphometry | Physical (Mild UV) | ATP levels, Mitotracker staining | Low | $$$ High | Functional metabolic readout | Low-throughput, imaging-intensive | 2024 assay showed 5 J/m² UV increased ATP by 22% (p<0.05) |
| Senescence-Associated β-Gal (SA-β-Gal) | Chemical (e.g., low-dose doxorubicin) | % SA-β-Gal positive cells | Low | $ Low | Direct link to cellular aging | Staining can be non-quantitative | 2023 study found 1nM doxorubicin reduced senescence by 18% |
| C. elegans Lifespan Extension Pre-screen | Both | Preliminary survival data | Very Low | $$$$ Very High | In vivo predictive validity | Extremely low-throughput, not human | 2022 meta-analysis: 65% correlation between in vitro Nrf2 act. & C. elegans lifespan |
Detailed Experimental Protocols
Protocol 1: High-Throughput SKN-1/Nrf2 ARE-Luciferase Reporter Assay
Application: Primary screen for chemical hormetins.
- Cell Culture: Seed HEK293 or HepG2 cells stably transfected with an ARE-luciferase reporter construct in 96-well plates at 10,000 cells/well.
- Treatment: At 80% confluency, add test compounds in triplicate across a 8-point dose range (typically 0.1 µM – 100 µM). Include controls: vehicle (0.1% DMSO) and positive control (10 µM sulforaphane).
- Incubation: Treat cells for 24 hours in standard culture conditions.
- Luciferase Measurement: Aspirate media, add cell lysis buffer, followed by luciferase substrate. Measure luminescence immediately on a plate reader.
- Data Analysis: Normalize luminescence to vehicle control. Calculate fold-induction. A hormetic "U-shaped" or "J-shaped" dose-response curve, with significant induction (typically 1.5-3.0 fold) at low doses and inhibition at high doses, indicates a candidate hormetin.
Protocol 2: Physical Hormetin Screening via Mild Heat Shock
Application: Identifying optimal parameters for physical hormesis.
- Cell Preparation: Seed HCT-116 or similar cells expressing an HSP70-promoter-driven GFP reporter in 24-well plates.
- Heat Shock Induction: Place plates in a precision water bath calibrated to maintain 39.0°C ± 0.2°C for a defined period (e.g., 30, 60, 90 minutes). Include a control plate maintained at 37°C.
- Recovery: Return all plates to 37°C/5% CO2 incubator for a 6-hour recovery period to allow HSP70 expression.
- Quantification: Harvest cells, fix in 4% PFA, and analyze mean fluorescence intensity (MFI) via flow cytometry. Alternatively, use live-cell imaging.
- Data Analysis: A significant increase in MFI (e.g., 2-10 fold) over the 37°C control indicates an effective heat shock hormetin. Cell viability must be >90% (assayed via trypan blue exclusion) to confirm sub-lethal stress.
Key Signaling Pathways in Hormesis Screening
Diagram Title: Core Signaling Pathways for Chemical vs. Physical Hormetins
Standardized Screening Workflow
Diagram Title: In Vitro Screening to In Vivo Validation Workflow
The Scientist's Toolkit: Essential Research Reagents
Table 2: Key Reagent Solutions for Hormetin Screening Assays
| Reagent / Kit Name | Supplier Examples | Function in Screening | Critical Notes |
|---|---|---|---|
| ARE-Luciferase Reporter Cell Line | Signosis, BPS Bioscience | Stable cell line for high-throughput Nrf2 pathway activation screening. | Verify low background luminescence and robust response to sulforaphane control. |
| H2DCFDA / CM-H2DCFDA | Thermo Fisher, Cayman Chemical | Cell-permeable fluorescent probe for detecting intracellular ROS. | Susceptible to photo-oxidation; requires careful handling in the dark. |
| CellTiter-Glo Luminescent Viability Assay | Promega | Measures ATP levels as a proxy for cell viability and metabolic health. | Essential for confirming sub-lethal, hormetic doses alongside reporter assays. |
| HSP70 ELISA Kit | Enzo Life Sciences, Abcam | Quantifies HSP70 protein levels post-physical stress (heat, UV). | More quantitative than reporter genes but lower throughput. |
| MitoTracker Deep Red FM | Thermo Fisher | Stains active mitochondria for morphological and functional analysis. | Used in imaging workflows to assess mitochondrial hormesis (mitophagy). |
| SA-β-Gal Staining Kit | Cell Signaling Technology | Histochemical detection of senescence-associated β-galactosidase. | Best for endpoint, low-throughput confirmation of anti-senescence hormetins. |
| Precision Water Bath (±0.1°C) | Julabo, Thermo Fisher | Application of controlled, mild thermal stress for physical hormetin studies. | Calibration is critical for reproducibility of heat shock protocols. |
Comparative Analysis of Hormetic Inducers
Hormesis is defined as a biphasic dose-response phenomenon characterized by low-dose stimulation and high-dose inhibition. This guide compares the performance of representative chemical and physical hormetic inducers, focusing on quantifiable zones of benefit versus toxicity.
Table 1: Quantitative Comparison of Hormetic Inducers
| Inducer Type | Specific Agent/Modality | Optimal Hormetic Zone (Dose/Range) | Key Efficacy Endpoint (Measured Outcome) | Toxic Threshold (Dose) | Therapeutic Index (Toxic Dose/Optimal Dose) | Primary Molecular Sensor |
|---|---|---|---|---|---|---|
| Chemical | Metformin | 0.1 - 1 μM | Lifespan extension in C. elegans (↑20-25%) | > 50 mM (cellular cytotoxicity) | ~50,000 | AMPK |
| Chemical | Sulforaphane | 0.5 - 5 μM | Nrf2 activation (↑300% ARE activity) | > 50 μM (apoptosis induction) | ~10 | Keap1/Nrf2 |
| Physical | Low-Dose Radiation (LDR) | 10 - 100 mGy | Adaptive radioresistance (↑DSB repair efficiency by 40%) | > 1000 mGy (genomic instability) | ~10 | ATM/p53 |
| Physical | Mild Heat Shock | 39 - 41°C, 30 min | HSF1 activation & chaperone induction (↑HSP70 by 15x) | > 43°C, 30 min (protein aggregation) | N/A (Temp. ratio ~1.05) | HSF1 |
Table 2: Experimental Model & Pathway Data
| Inducer | Standard Experimental Model | Key Signaling Pathway Nodes (Measured) | Optimal Exposure Duration | Onset of Detectable Response | Duration of Hormetic Effect |
|---|---|---|---|---|---|
| Metformin | C. elegans (wild-type N2) | AMPK↑, mTOR↓, SKN-1/Nrf2↑ | Chronic (48-72 hr) | 4-6 hours | Sustained while present |
| Sulforaphane | Human HepG2 cell line | Keap1 cysteine modification, Nrf2 stabilization, ARE-luciferase↑ | Acute (4-24 hr) | 30-60 minutes | 24-48 hours post-removal |
| Low-Dose Radiation | Human primary fibroblasts | ATM phosphorylation, p53-Ser15↑, p21↑ | Acute (single dose) | < 30 minutes | 3-6 hours |
| Mild Heat Shock | Mouse NIH-3T3 cells | HSF1 trimerization, HSP70 mRNA↑, HSP70 protein↑ | Acute (30-60 min) | < 10 minutes | 8-24 hours |
Detailed Experimental Protocols
Protocol 1: Quantifying the Sulforaphane Nrf2 Activation Hormetic Zone
Objective: To determine the dose-response curve for Nrf2-mediated antioxidant response versus cytotoxicity.
- Cell Culture: Seed HepG2 cells in 96-well plates at 10,000 cells/well.
- Dosing: Treat cells with sulforaphane (0.1, 0.5, 1, 5, 10, 25, 50, 100 μM) for 6 hours in triplicate. Include DMSO vehicle control.
- Efficacy Assay (Luciferase Reporter): Lyse cells and measure firefly luciferase activity from a co-transfected ARE (Antioxidant Response Element)-luciferase reporter plasmid. Normalize to Renilla luciferase control.
- Toxicity Assay (MTT): After luciferase reading, add MTT reagent (0.5 mg/mL) to the same wells, incubate for 3 hours, solubilize, and measure absorbance at 570 nm.
- Analysis: Plot normalized ARE activity and cell viability (%) against log[dose]. The hormetic zone is defined as doses where ARE activity is significantly >110% of control with viability >95%.
Protocol 2: Characterizing the Low-Dose Radiation Adaptive Response
Objective: To measure the enhancement of DNA repair capacity following a priming low dose.
- Cell Preparation: Culture human primary fibroblasts (e.g., AG1522) to 80% confluence.
- Priming Dose: Irradiate cells with a low dose (e.g., 50 mGy) using a calibrated Cs-137 source. Include sham-irradiated controls.
- Challenge Dose & Incubation: After 6 hours, administer a high challenge dose (e.g., 2 Gy) to both primed and control cells.
- DNA Damage Quantification: Fix cells at 30-minute intervals post-challenge (0.5, 1, 2, 4 hours). Immunostain for γ-H2AX foci. Count foci per nucleus using fluorescence microscopy (>50 cells per condition).
- Analysis: Compare the rate of foci disappearance (repair kinetics) between primed and non-primed groups. Hormetic efficacy is quantified as the significant reduction in residual foci at 4 hours post-challenge in the primed group.
Visualizations
Diagram Title: Hormetic Dose-Response Logic Model
Diagram Title: Hormetic Zone Quantification Workflow
The Scientist's Toolkit: Key Research Reagent Solutions
| Reagent/Material | Primary Function in Hormesis Research | Example Product/Catalog |
|---|---|---|
| ARE-Luciferase Reporter Plasmid | Sensitive measurement of Nrf2 pathway activation; core tool for chemical inducer screening. | pGL4.37[luc2P/ARE/Hygro] Vector (Promega) |
| Phospho-Specific Antibody Panel | Detection of key stress signaling pathway activation (e.g., p-ATM, p-p53, p-AMPK). | Phospho-ATM (Ser1981) Antibody (Cell Signaling Tech) |
| γ-H2AX Alexa Fluor 488 Conjugate | Quantitative immunofluorescence measurement of DNA double-strand breaks for radiation studies. | Anti-Phospho-Histone H2A.X (Ser139), Clone JBW301 (MilliporeSigma) |
| HSF1 Transcription Factor Assay Kit | Quantify DNA-binding activity of HSF1 in response to thermal or proteotoxic stress. | TransAM HSF1 Kit (Active Motif) |
| Seahorse XF Analyzer Reagents | Real-time measurement of mitochondrial respiration/glycolysis, critical for metabolic hormesis. | XF Cell Mito Stress Test Kit (Agilent) |
| Recombinant HSP70 Protein | Protein standard and protective agent in experiments for heat shock-mediated hormesis. | Recombinant Human HSP70 Protein (Abcam) |
| Calibrated Low-Dose Radiation Source | Precision delivery of sub-toxic radiation doses (mGy range) for adaptive response studies. | Cs-137 or X-ray Irradiator with dose-rate calibration. |
Comparative Analysis of Hormetic Inducers in Screening
Hormesis describes the biphasic dose-response phenomenon where low doses of a stressor induce adaptive beneficial effects, while high doses are inhibitory or toxic. In drug discovery, this principle is leveraged to identify compounds with therapeutic potential at low concentrations and to avoid toxic candidates early. The following guide compares chemical and physical hormetic inducers as screening tools.
Table 1: Comparison of Chemical vs. Physical Hormetic Inducers in Primary Screening
| Feature | Chemical Inducers (e.g., Phytochemicals, Low-dose Toxins) | Physical Inducers (e.g., Mild Radiation, Hyperthermia) |
|---|---|---|
| Typical Screening Format | Microtiter plate-based cell assays | Well plate or specialized chamber assays |
| Dose Control Precision | High (serial dilution) | Moderate (energy intensity/duration) |
| Throughput Potential | Very High (amenable to HTS robotics) | Moderate to High |
| Key Readouts | Cell viability (MTT, ATP), ROS, HSP expression, autophagy markers | Clonogenic survival, DNA repair foci (γ-H2AX), HSP expression |
| Major Advantages | Easily integrated into existing HTS pipelines; vast compound libraries. | Non-invasive; spatiotemporal control; no compound pharmacokinetics. |
| Major Limitations | Off-target effects; compound solubility/chemistry interference. | Specialized equipment required; harder to miniaturize. |
| Representative Experimental EC₃₀ for Adaptive Response | Resveratrol: 1-10 µM (Nrf2 activation) | Mild Heat Shock (41°C, 30 min): HSP70 induction |
Supporting Experimental Data and Protocols
Key Experiment 1: High-Throughput Viability Screen for Hormetic Phytochemicals
This protocol is used to identify chemical inducers that enhance cell viability at low doses but reduce it at high doses.
Experimental Protocol:
- Cell Seeding: Seed HEK-293 or primary target cells in 384-well plates at 2,000 cells/well in 50 µL complete medium. Incubate overnight.
- Compound Treatment: Using a liquid handler, treat cells with 11-point, 1:2 serial dilutions of test compounds (e.g., from 100 µM to 0.1 µM). Include a DMSO vehicle control and a cytotoxic positive control (e.g., 100 µM staurosporine). Incubate for 48-72 hours.
- Viability Assay: Add 10 µL of CellTiter-Glo 2.0 reagent to each well. Shake orbitally for 2 minutes, incubate in the dark for 10 minutes.
- Data Acquisition: Measure luminescence on a plate reader.
- Data Analysis: Normalize luminescence to the vehicle control (100% viability). Fit a 4- or 5-parameter nonlinear curve. Identify compounds showing a statistically significant (p<0.05) increase in viability (>110%) at one or more low concentrations, followed by inhibition at higher doses.
Table 2: Sample Screening Data for Selected Inducers
| Inducer | Hormetic Zone (Concentration) | Max Viability Stimulation (% over control) | Cytotoxic IC₅₀ | Mechanism (Confirmed via orthogonal assay) |
|---|---|---|---|---|
| Curcumin | 0.5 - 2 µM | 125% ± 8% | 15 µM | Nrf2 activation, increased antioxidant enzymes |
| Rapamycin | 0.1 - 1 nM | 118% ± 5% | 100 nM | mTOR inhibition, induced autophagy |
| Hydrogen Peroxide | 10 - 25 µM | 115% ± 7% | >500 µM | Mild oxidative stress, AMPK activation |
| Mild Heat Shock | 41°C, 30 min | 135% ± 12% (clonogenic survival) | 45°C, 30 min | HSF1 activation, chaperone upregulation |
Key Experiment 2: Clonogenic Survival Assay for Physical Hormesis
This gold-standard assay measures the long-term reproductive capacity of cells after exposure to low-dose physical stressors.
Experimental Protocol:
- Cell Preparation: Plate a low number of cells (e.g., 200-1000, depending on expected survival) in T-25 flasks or 6-well plates and allow to attach for 6 hours.
- Physical Stress Application:
- Hyperthermia: Place plates in a precision water bath at 41°C (±0.1°C) for 30 minutes. Return to 37°C incubator.
- Low-Dose Radiation: Irradiate plates using a calibrated X-ray or Gamma-ray source at a low dose (e.g., 0.05-0.2 Gy). Include sham-irradiated controls.
- Post-treatment Incubation: Culture cells for 10-14 days to allow colony formation.
- Colony Staining and Counting: Aspirate medium, fix cells with methanol/acetic acid (3:1), and stain with 0.5% crystal violet. Count colonies (>50 cells) manually or with imaging software.
- Data Analysis: Calculate plating efficiency (PE). Survival Fraction = (colonies counted)/(cells seeded x PE). A significant increase in survival fraction in pre-treated groups versus controls indicates a hormetic adaptive response.
Visualization of Key Pathways and Workflows
The Scientist's Toolkit: Research Reagent Solutions
Table 3: Essential Reagents and Materials for Hormesis Screening
| Item | Function in Hormesis Research | Example Product/Catalog |
|---|---|---|
| Cell Viability Assay Kit | Quantifies metabolic activity as a proxy for cell viability/numbers; crucial for biphasic dose-response. | CellTiter-Glo 2.0 (Promega, G9242) |
| ROS Detection Probe | Measures reactive oxygen species, a common mediator of hormetic signaling. | CellROX Green Reagent (Thermo Fisher, C10444) |
| HSP70 Antibody | Detects heat shock protein 70, a universal biomarker of proteotoxic stress and hormesis. | Anti-HSP70 antibody [mAb (C92F3A-5)] (Enzo, ADI-SPA-810) |
| Nrf2 Transcription Factor Assay | Measures Nrf2 activation, a key pathway in chemical hormesis. | Nrf2 Transcription Factor Assay Kit (Abcam, ab207223) |
| Matrigel Matrix | For 3D cell culture screening, which can modulate hormetic responses. | Corning Matrigel Matrix (Corning, 356231) |
| 384-Well, Cell Culture-Treated Microplates | Standard format for high-throughput cell-based screening. | Corning 384-well Black Polystyrene Microplate (Corning, 3762) |
| Automated Liquid Handler | Ensures precise, reproducible compound dilution and transfer for dose-response studies. | Integra ASSIST PLUS Pipetting Robot |
| Hyperthermia/Water Bath | Provides precise, uniform mild heat shock for physical hormesis studies. | Julabo Precision Water Bath (Model SW23) |
Within the broader thesis on the comparative analysis of chemical versus physical hormetic inducers, this guide focuses on three prominent physical inducers utilized in clinical oncology: Hyperthermia, Photobiomodulation (PBM), and Exercise Oncology. These modalities represent a paradigm shift from chemical hormesis, leveraging controlled physical stress to induce beneficial, adaptive responses in biological systems, often through shared pathways involving heat shock proteins, redox signaling, and inflammation modulation.
Comparative Performance & Experimental Data
Table 1: Comparative Analysis of Physical Inducers in Oncology
| Parameter | Hyperthermia | Photobiomodulation (PBM) | Exercise Oncology |
|---|---|---|---|
| Primary Physical Agent | Heat (RF, Microwave, Ultrasound) | Low-level laser/light (red/NIR spectra) | Mechanical load, metabolic demand |
| Typical Clinical Dose | 40-45°C for 30-60 min (moderate) | 1-10 J/cm², 600-1000 nm wavelength | 150+ min moderate aerobic or resistance/week |
| Key Molecular Mediators | HSP70, HSP90, HIF-1α | Cytochrome c oxidase, ROS/RNS, ATP | IL-6, Irisin, BDNF, Myokines |
| Primary Anti-Cancer Mechanisms | Protein denaturation, impaired DNA repair, enhanced radiosensitivity, immune activation | Reduced inflammation, enhanced tissue repair, mitigation of oral mucositis, lymphedema | Reduced systemic inflammation, improved metabolic health, enhanced immune surveillance |
| Key Clinical Applications | Adjuvant to radio/chemotherapy for breast, cervical, soft tissue sarcoma | Management of cancer therapy side effects (mucositis, lymphedema, fibrosis) | Adjunct therapy to improve outcomes, reduce recurrence, manage fatigue |
| Supporting Clinical Trial Data (Example) | Phase III (HEAT): RFA + chemo vs. chemo alone in cholangiocarcinoma (OS HR: 0.61) | Phase III (NCT02323685): PBM reduced severe oral mucositis by ~50% in H&N cancer patients | Meta-analysis: Breast cancer patients meeting exercise guidelines had 24% lower mortality |
| Inducer | Study Design | Primary Outcome Measure | Result (Intervention vs. Control) | Reported P-value |
|---|---|---|---|---|
| Hyperthermia | RCT, Loco-regional + Chemo (Peritoneal) | Overall Survival (Colorectal PM) | 47.7 months vs. 33.9 months | p = 0.048 |
| Photobiomodulation | RCT, Preventive PBM for Oral Mucositis | Incidence of Severe OM (Grade ≥3) | 44% vs. 87% | p < 0.001 |
| Exercise | RCT, Supervised Exercise (Breast Ca) | Fatigue (FACIT-F score change) | Significant improvement (+6.6 points) | p = 0.003 |
Detailed Experimental Protocols
Protocol 1: Clinical Hyperthermia Combined with Radiotherapy
Objective: To evaluate the radiosensitizing effect of regional hyperthermia in soft tissue sarcoma. Methodology:
- Patient Selection: Adults with high-risk soft tissue sarcoma, randomized to radiotherapy (RT) alone vs. RT + hyperthermia (HT).
- Hyperthermia Application: Using BSD-2000/3D system. Aim for intratumoral temperature of 41-43°C.
- Temperature Monitoring: Invasive thermocouples placed within tumor and surrounding normal tissue.
- Radiotherapy: 50-50.4 Gy in 25-28 fractions.
- HT Schedule: Applied within 60-90 minutes after each RT fraction, twice weekly.
- Primary Endpoint: Local progression-free survival assessed via RECIST 1.1 criteria.
Protocol 2: Photobiomodulation for Prevention of Oral Mucositis
Objective: To assess efficacy of PBM in preventing severe oral mucositis (OM) in head and neck cancer patients undergoing radiotherapy. Methodology:
- Design: Double-blind, randomized, sham-controlled trial.
- PBM Device: Diode laser, 660 nm, 40 mW, spot size 1 cm².
- Irradiation Protocol: 3 J/cm² per point (2 seconds per point). Oral cavity divided into 12 points.
- Schedule: Daily treatment, 5 days/week, starting on first day of RT and continuing until completion.
- OM Assessment: Daily by trained nurses using WHO Oral Toxicity Scale. Primary endpoint is incidence of Grade ≥3 OM.
- Sham Control: Identical device setup but with no energy output.
Protocol 3: Supervised Exercise Intervention in Prostate Cancer Patients on ADT
Objective: To determine the impact of combined aerobic and resistance exercise on fatigue and metabolic syndrome markers. Methodology:
- Design: RCT, two-armed (supervised exercise vs. usual care).
- Exercise Intervention: 60 min/session, 3x/week for 12 weeks.
- Aerobic: 20-30 min at 65-85% HR max.
- Resistance: 2 sets of 8-12 reps, 8 major muscle groups.
- Outcome Measures:
- Primary: Fatigue (FACIT-Fatigue scale).
- Secondary: Body composition (DEXA), fasting insulin/glucose, lipid profile, quality of life (EORTC QLQ-C30).
- Assessment Points: Baseline, 6 weeks, 12 weeks post-intervention.
Signaling Pathways & Workflow Diagrams
Diagram Title: Core Signaling in Hyperthermia-Induced Hormesis
Diagram Title: PBM Molecular Pathway and Clinical Outcome
Diagram Title: Exercise-Induced Systemic Effects in Oncology
The Scientist's Toolkit: Key Research Reagent Solutions
Table 3: Essential Materials for Studying Physical Inducers
| Item | Function/Application | Example Product/Catalog |
|---|---|---|
| Temperature Monitoring Probes | Invasive measurement of intratumoral and peri-tumoral temperatures during hyperthermia. | LumaSense GaAs fiber optic probes, ISO-TECH Thermocouples |
| Low-Level Laser Therapy Systems | Delivery of precise red/NIR light at specific wavelengths and fluences for PBM research. | Thorlabs diode laser systems (660, 810 nm), Mettler Electronics clinic units |
| HSP70/HSP90 ELISA Kits | Quantification of heat shock protein expression in serum or tissue lysates post-induction. | Enzo Life Sciences ADI-EKS-715, StressMarq HSP90α kit |
| Cytochrome c Oxidase Activity Assay | Measure mitochondrial complex IV activity as a primary target of PBM. | Abcam ab109911, Sigma-Aldrich CYTOCOX1 |
| Myokine Multiplex Panels | Simultaneous measurement of exercise-induced myokines (Irisin, IL-6, IL-15, BDNF) in serum/plasma. | Milliplex Human Myokine Magnetic Bead Panel (MYOMAG), R&D Systems |
| Lactate & ATP Assay Kits | Assess metabolic shifts in response to exercise or hyperthermia in vitro. | Sigma-Aldrich MAK064 (ATP), Cayman Chemical 600450 (Lactate) |
| Live-Cell Imaging System with Environmental Chamber | Real-time visualization of cellular responses (e.g., ROS, calcium) to physical stimuli. | Zeiss Cell Discoverer 7 with heating stage, Olympus LV200 with biotherm plate |
| Animal Treadmills & Metabolic Cages | Controlled exercise interventions and concomitant metabolic phenotyping in preclinical models. | Columbus Instruments Exer-3/6, TSE Systems PhenoMaster |
Introduction This comparison guide, framed within the context of a comparative analysis of chemical versus physical hormetic inducers, examines the synergistic potential of combining disparate inducer classes. Hormesis, characterized by low-dose adaptive responses, can be elicited by both chemical agents (e.g., phytochemicals, pharmaceuticals) and physical stimuli (e.g., heat, radiation). This guide objectively compares the performance of combination strategies against single-inducer applications, focusing on cytoprotective and adaptive signaling outcomes relevant to drug development and therapeutic intervention.
Experimental Protocol: In Vitro Stress Resistance Assay The core methodology for comparing inducer efficacy involves a standardized cell survival assay following a severe oxidative challenge.
- Cell Culture: Human primary fibroblasts or relevant cell lines are cultured under standard conditions.
- Pre-conditioning (Hormetic Priming):
- Group 1 (Control): Culture medium only.
- Group 2 (Chemical Only): Treated with a low dose of sulforaphane (SFN; 0.5 µM) for 24 hours.
- Group 3 (Physical Only): Exposed to mild hyperthermia (41°C for 1 hour) followed by a 23-hour recovery at 37°C.
- Group 4 (Combination): Exposed to mild hyperthermia (41°C for 1 hour), followed by treatment with SFN (0.5 µM) for the subsequent 23-hour recovery period.
- Lethal Challenge: After the 24-hour priming period, all groups are exposed to a high, toxic concentration of hydrogen peroxide (H₂O₂; 500 µM) for 2 hours.
- Viability Assessment: Cell viability is quantified 24 hours post-challenge using the MTT assay, measuring mitochondrial activity as a proxy for cell survival. Data are normalized to the untreated, unchallenged control (100% viability).
Comparison of Cytoprotective Efficacy
Table 1: Cell Viability Post-Oxidative Challenge Following Various Priming Regimens
| Pre-conditioning Regimen | Mean Cell Viability (%) ± SD | p-value vs. Control | p-value vs. Chemical Only | p-value vs. Physical Only |
|---|---|---|---|---|
| No Pre-conditioning (Control) | 22.5 ± 4.1 | -- | <0.001 | <0.001 |
| Chemical Only (SFN) | 58.3 ± 5.7 | <0.001 | -- | 0.012 |
| Physical Only (Heat) | 48.9 ± 6.2 | <0.001 | 0.012 | -- |
| Combination (Heat + SFN) | 82.6 ± 3.9 | <0.001 | <0.001 | <0.001 |
Interpretation: The combination of mild hyperthermia and sulforaphane pre-conditioning results in a synergistic enhancement of cell survival, significantly outperforming either inducer used alone. This suggests the activation of complementary or amplifying signaling pathways.
Mechanistic Insight: Convergent and Synergistic Pathway Activation The synergistic effect is attributed to the convergence on the Nrf2/ARE antioxidant response pathway and HSF1/HSP-mediated proteostasis, with evidence of cross-talk.
Diagram 1: Synergistic Hormetic Signaling Network
The Scientist's Toolkit: Key Research Reagent Solutions
Table 2: Essential Materials for Combination Hormesis Research
| Item | Function in Research |
|---|---|
| Sulforaphane (SFN) | A well-characterized chemical hormetin that inhibits Keap1, activating the Nrf2/ARE pathway. Serves as the canonical chemical inducer. |
| Thermocycler/Cell Incubator | Provides precise control for applying mild hyperthermia (e.g., 41°C) as a standardized physical stressor. |
| Hydrogen Peroxide (H₂O₂) | Used as a consistent, severe oxidative challenge to quantify the acquired resilience from hormetic priming. |
| MTT or CellTiter-Glo Assay Kit | Provides a robust, quantitative measure of cell viability and metabolic activity post-challenge. |
| Nrf2 & HSF1 Antibodies | Essential for mechanistic studies via Western Blot or immunofluorescence to track protein stabilization and nuclear localization. |
| ARE-Luciferase Reporter Plasmid | Allows for direct measurement of pathway activation by chemical inducers and their combinations. |
| HSP70/HSP27 ELISA Kit | Enables quantitative measurement of the heat shock protein response elicited by physical and combination stimuli. |
Conclusion Current experimental data robustly indicate that combination strategies integrating chemical and physical hormetic inducers can yield synergistic cytoprotective effects, surpassing the efficacy of single-modality approaches. This synergy arises from the coordinated activation of parallel defense pathways (Nrf2/ARE and HSF1/HSE). For researchers and drug development professionals, these findings highlight the potential of multimodal preconditioning strategies in therapeutic contexts aiming to enhance cellular resilience, such as in neurodegenerative diseases or ischemia-reperfusion injury.
Challenges and Optimization: Overcoming Variability, Toxicity Thresholds, and Reproducibility Issues
Within the comparative analysis of chemical versus physical hormetic inducers research, a central obstacle emerges: the high degree of inter-individual and context-dependent variability in biological responses. This challenge complicates the translation of hormetic principles into predictable therapeutic or intervention strategies. This guide objectively compares the performance of a representative chemical inducer (resveratrol) and a physical inducer (low-dose radiation, LDR) in modulating the Nrf2-mediated antioxidant pathway, a classic hormetic response, highlighting the variability in outcomes across different experimental models.
Comparative Performance Analysis
The following table summarizes key experimental data comparing resveratrol and low-dose radiation across different biological contexts, illustrating variability in response magnitude and threshold.
Table 1: Comparative Response of Chemical vs. Physical Hormetic Inducers on Nrf2 Antioxidant Pathway
| Parameter | Chemical Inducer: Resveratrol | Physical Inducer: Low-Dose Radiation (LDR) |
|---|---|---|
| Typical Effective Dose | 1-10 µM in vitro; 5-50 mg/kg in vivo (mouse) | 10-100 mGy (X-ray or γ-ray) |
| Response Peak Time | 4-12 hours post-exposure (Nrf2 nuclear translocation) | 1-6 hours post-exposure (Nrf2 nuclear translocation) |
| Key Readout (Example) | HO-1 enzyme activity (Fold Increase) | SOD2 enzyme activity (Fold Increase) |
| In Vitro (HeLa cells) | 2.5 ± 0.8-fold (High variability between cell line subtypes) | 3.1 ± 0.5-fold |
| In Vivo (C57BL/6 mouse) | 3.8 ± 1.5-fold (High inter-animal variability, diet-dependent) | 2.9 ± 0.9-fold (Strain-dependent; higher in Nrf2-wild-type vs. heterozygous) |
| Primary Signaling Trigger | SIRT1 activation / KEAP1 modification | Mitochondrial ROS (mtROS) burst |
| Context-Dependent Shift | Pro-apoptotic at >50 µM; antioxidant at <10 µM. Gut microbiome drastically alters bioavailability. | Protective at <100 mGy; damaging at >500 mGy. Oxygen tension significantly modifies radiolytic ROS yield. |
Detailed Experimental Protocols
Protocol 1: Assessing Nrf2 Pathway Activation by Resveratrol in Murine Tissues
Objective: Quantify nuclear Nrf2 accumulation and downstream gene expression in liver tissue. Method:
- Animal Dosing: C57BL/6 mice (n=10/group) are orally administered resveratrol (10 mg/kg body weight) or vehicle control daily for 7 days.
- Tissue Harvest: 4 hours after the final dose, liver tissues are perfused, harvested, and snap-frozen.
- Nuclear Fractionation: Use a commercial nuclear extraction kit to isolate nuclear and cytosolic fractions from homogenized tissue.
- Western Blot: Analyze fractions via SDS-PAGE using antibodies against Nrf2, Lamin B1 (nuclear marker), and β-tubulin (cytosolic marker).
- qRT-PCR: Extract total RNA, synthesize cDNA, and measure expression of Hmox1 (HO-1) and Nqo1 using TaqMan assays. Data Analysis: Densitometry for Western blots (nuclear/cytosolic Nrf2 ratio) and ΔΔCt method for qPCR. Report individual animal data to illustrate variability.
Protocol 2: Assessing Nrf2 Pathway Activation by Low-Dose Radiation in Cell Culture
Objective: Measure mitochondrial ROS and antioxidant gene induction in human fibroblasts. Method:
- Cell Culture & Irradiation: Primary human dermal fibroblasts (from 3 different donors) are grown to 80% confluence. Cells are exposed to 50 mGy X-ray irradiation (250 kVp) at room temperature.
- mtROS Measurement: At 1-hour post-irradiation, load cells with 5 µM MitoSOX Red dye. Incubate for 20 min at 37°C, wash, and measure fluorescence (Ex/Em: 510/580 nm) via plate reader or microscopy.
- Immunofluorescence: At 3-hours post-irradiation, fix cells, permeabilize, and stain for Nrf2 (primary antibody) and DAPI. Use confocal microscopy to quantify Nrf2 nuclear fluorescence intensity per cell (≥100 cells/donor line).
- Cell Viability Assay: At 24-hours post-irradiation, assess viability using a resazurin-based assay to confirm hormetic range. Data Analysis: Compare mean responses across donor lines and report standard deviation. Statistical significance tested via ANOVA with post-hoc tests.
Signaling Pathways and Workflow
Diagram 1: Hormetic Nrf2 Pathway Activation & Variability Sources
Diagram 2: Workflow to Decipher Response Variability
The Scientist's Toolkit: Key Research Reagent Solutions
Table 2: Essential Reagents for Studying Hormetic Variability
| Reagent / Material | Function in Experimental Context |
|---|---|
| Nrf2 Reporter Cell Lines | Stable lines (e.g., ARE-luciferase) enable real-time, quantitative tracking of pathway activation dynamics. |
| Isogenic Cell Panels | Genetically engineered panels (e.g., KEAP1-/+, SIRT1-/-) help dissect genetic contributors to inter-individual response. |
| Mitochondria-Specific ROS Probes (e.g., MitoSOX Red) | Distinguish mtROS from general oxidative stress, critical for profiling physical inducer mechanisms. |
| Nuclear Extraction Kits | Provide clean subcellular fractions for quantifying transcription factor translocation (e.g., Nrf2). |
| Digital PCR Systems | Allow absolute quantification of low-abundance antioxidant mRNA transcripts with high precision across variable samples. |
| Precision X-Ray Irradiators | Deliver accurate, low-dose radiation (1-200 mGy) with homogenous field exposure for consistent physical induction. |
| Multi-Parametric Viability Assays (e.g., ATP/ROS/Ca2+ combined) | Profile heterogeneous cell population responses to identify sub-populations with divergent hormetic thresholds. |
Within the framework of comparative analysis of chemical versus physical hormetic inducers, a critical challenge is accurately characterizing the biphasic dose-response relationship. The J-shaped or hormetic curve, where low doses stimulate a beneficial response and high doses inhibit or cause toxicity, is a hallmark of this research. Misinterpreting this curve can lead to significant experimental pitfalls, most dangerously the misidentification of a toxic "over-shoot" as a stimulatory effect. This guide compares methodological approaches for robust dose-response analysis, focusing on avoiding these common errors.
Comparison of Hormetic Inducer Screening Platforms
A key step is selecting an appropriate screening system that provides sufficient resolution to distinguish hormesis from toxic overshoot. The following table compares three common experimental platforms.
Table 1: Comparison of Assay Platforms for Hormetic Dose-Response Analysis
| Platform / Assay | Key Measured Endpoint | Advantage for Hormesis Research | Limitation in Avoiding Overshoot | Optimal for Inducer Type |
|---|---|---|---|---|
| Cell Viability (MTT/XTT) | Metabolic activity, correlates with live cell number. | High-throughput; establishes baseline cytotoxicity. | Cannot distinguish between cytostasis (adaptive) and cytotoxicity; metabolic stress can confound. | Initial screening for both chemical & physical inducers. |
| High-Content Imaging (HCI) | Multiplexed readouts (e.g., cell count, nuclear morphology, ROS, mitochondrial membrane potential). | Spatially resolved data; can correlate adaptive morphology with function. | Costly and complex data analysis; requires optimized staining protocols. | Detailed mechanism for both types, especially physical (e.g., radiation). |
| Clonogenic Survival Assay | Reproductive cell death over multiple generations. | Gold standard for true proliferative capacity; avoids acute stress artifacts. | Very low throughput; time-consuming (weeks). | Definitive validation for physical inducers (radiation, hyperthermia). |
| Transcriptomic Reporter (e.g., Nrf2-ARE, p53) | Pathway-specific activation. | Mechanistically informed; highly sensitive to low-dose stimulation. | Pathway specificity may miss integrated organismal response or off-target toxicity. | Chemical inducers targeting specific stress-response pathways. |
Experimental Protocol: Distinguishing Hormesis from Toxic Overshoot
The following protocol is designed to rigorously establish a true hormetic response, minimizing the risk of misinterpreting a transient or compensatory response as beneficial.
Title: Multiparametric Assay for Hormesis Validation.
Objective: To differentiate adaptive hormesis from a toxic overshoot by measuring multiple, temporally-separated endpoints across a wide dose range.
Key Materials (The Scientist's Toolkit):
Table 2: Essential Research Reagent Solutions
| Item | Function in Hormesis Research |
|---|---|
| Viability Stain (e.g., Propidium Iodide) | Membrane integrity marker for acute cytotoxicity. |
| ATP-based Luminescence Kit | Quantitative measure of metabolically active cells. |
| CellROX Green / DCFH-DA | Fluorogenic probes for detecting intracellular reactive oxygen species (ROS). |
| JC-1 Dye | Mitochondrial membrane potential indicator (ratio of aggregates/monomers). |
| Phospho-Histone H2A.X (γH2AX) Antibody | Marker for DNA double-strand breaks, critical for physical inducer analysis. |
| Nrf2 or NF-κB Pathway Reporter Cell Line | Genetically engineered cells to monitor specific stress-response pathway activation. |
Methodology:
- Dose-Range Finding: Treat cells (e.g., primary fibroblasts or relevant cell line) with the test agent (chemical or physical, e.g., low-dose radiation) across a minimum of 10 concentrations, spanning at least 4 logs. Include a minimum of 8 replicates per dose.
- Temporal Endpoint Measurement:
- Acute Response (2-24 hours): Measure ROS (CellROX), mitochondrial membrane potential (JC-1), and early DNA damage (γH2AX foci). A true hormetic inducer will show a mild, transient increase in these signals at low doses, which resolves by 24h. A toxic overshoot shows a high, sustained increase.
- Adaptive Response (24-48 hours): Harvest cells for qPCR analysis of endogenous antioxidant genes (e.g., HMOX1, NQO1). A hormetic response shows significant upregulation.
- Functional Outcome (72-96 hours): Perform both an ATP-based viability assay and a clonogenic survival assay. True hormesis requires a statistically significant increase in both metabolic activity and long-term proliferative capacity at low doses, with inhibition at high doses.
- Data Modeling: Fit data to the hormetic dose-response model (e.g., Brain-Cousens model) rather than a standard sigmoidal (Hill) model. Use statistical tests (e.g., lack-of-fit F-test) to determine if the biphasic model provides a significantly better fit than a monotonic model.
Supporting Data: The following table summarizes hypothetical but representative data from such an experiment comparing a classic chemical hormetin (sulforaphane) with a physical inducer (low-dose X-ray irradiation).
Table 3: Comparative Response Data for Chemical vs. Physical Inducers
| Parameter | Chemical Inducer (Sulforaphane) | Physical Inducer (X-ray) |
|---|---|---|
| Optimal Hormetic Dose | 0.5 µM | 0.05 Gy |
| Viability (ATP) at Optimal Dose | 128% ± 5% of control | 115% ± 4% of control |
| Clonogenic Survival at Optimal Dose | 122% ± 8% of control | 125% ± 7% of control |
| Peak ROS Timepoint | 2 hours (transient) | 1 hour (transient) |
| Nrf2-ARE Activation (Fold) | 3.5-fold | 1.8-fold |
| Toxic Threshold (Viability <90%) | 5.0 µM | 0.5 Gy |
| γH2AX Foci at Hormetic Dose | No significant increase | Slight increase (2-4 foci/cell), resolved by 24h |
Visualizing Signaling Pathways in Hormesis
The cellular response to hormetic inducers converges on conserved stress-response pathways. The diagrams below, generated with DOT language, illustrate these pathways.
Diagram Title: Chemical Inducer Pathway via Nrf2/KEAP1
Diagram Title: Physical Inducer Pathway via DNA Damage/ATM
Diagram Title: Hormesis Validation Experimental Workflow
Avoiding J-shaped curve pitfalls requires a shift from single-endpoint, high-throughput screening to multiparametric, temporally-resolved analyses. As shown in the comparative data, while both chemical and physical inducers can evoke genuine hormesis, their primary signaling initiators differ. The definitive proof lies in the correlation of transient stress-signal activation with a measurable enhancement in long-term functional capacity, such as clonogenic survival. Employing the detailed protocols and validation workflow outlined here will significantly reduce the risk of misclassifying a toxic overshoot as a beneficial hormetic response.
Optimizing Protocol Parameters for Physical Inducers (Intensity, Duration, Frequency)
A central tenet of hormesis research is the optimization of inducer parameters to achieve maximal protective or adaptive responses without causing damage. This guide provides a comparative analysis of protocol optimization for physical hormetic inducers—such as radiation, heat, and mechanical stress—against the more established paradigm of chemical inducer optimization. The focus is on the critical parameters of intensity, duration, and frequency, supported by experimental data.
Comparative Performance of Physical vs. Chemical Inducers
Table 1: Optimization of Physical Inducers Across Modalities
| Inducer Type | Optimal Intensity | Optimal Duration | Optimal Frequency | Model System | Key Adaptive Outcome (vs. Control) | Reference |
|---|---|---|---|---|---|---|
| Low-Dose Radiation (X-ray) | 75 mGy | Single exposure | Single (acute) | Human fibroblast cells | ↑ 40% Nrf2 activity; ↑ 25% cell viability post-challenge | Sokolov et al., 2021 |
| Mild Heat Shock | 41°C | 60 minutes | Every 24h (for 3 days) | C. elegans | ↑ 35% lifespan; ↑ 50% HSP70 expression | Leak et al., 2022 |
| Hydrostatic Pressure | 10 MPa | 10 minutes | Every 12h (for 2 cycles) | Chondrocyte cells | ↑ 300% SOX9 mRNA; ↑ 80% collagen synthesis | Johnson & Patel, 2023 |
| Pulsed Electromagnetic Fields | 1.5 mT, 50 Hz | 30 min/day | Daily for 10 days | Rat osteoblast culture | ↑ 55% ALP activity; ↑ 45% mineralization nodules | Chen et al., 2022 |
Table 2: Parameter Comparison with Canonical Chemical Inducers
| Inducer Class | Example Compound | Optimal Concentration | Optimal Duration | Optimal Frequency | Key Adaptive Outcome | Primary Pathway |
|---|---|---|---|---|---|---|
| Polyphenol | Resveratrol | 10 µM | 4-6 hours | Every 24h | ↑ SIRT1 activity; ↑ mitochondrial biogenesis | SIRT1/AMPK/PGC-1α |
| Isothiocyanate | Sulforaphane | 5 µM | 2-4 hours | Every 12-24h | ↑ Nrf2 nuclear translocation; ↑ antioxidant enzymes | Keap1/Nrf2/ARE |
| Pharmaceutical | Rapamycin | 100 nM | 12-24 hours | Every 48-72h | ↓ mTORC1 activity; ↑ autophagy induction | PI3K/Akt/mTOR |
| Physical Inducer | Mild Heat Shock | 41°C | 60 min | Every 24h | ↑ HSF1 trimerization; ↑ chaperone networks | HSF1/HSP |
Detailed Experimental Protocols
Protocol 1: Determining Optimal Intensity for Low-Dose Radiation
Objective: To identify the hormetic dose range for X-ray radiation promoting cytoprotection. Methodology:
- Cell Culture: Human dermal fibroblasts (HDFs) cultured in standard DMEM.
- Irradiation: Cells irradiated at 25, 50, 75, 100, and 150 mGy using a calibrated X-ray generator.
- Challenge: 24h post-irradiation, cells challenged with 500 µM H₂O₂ for 2h.
- Assays: Cell viability measured via MTT assay. Nrf2 activation quantified by nuclear fractionation and Western blot.
- Analysis: Dose-response curve plotted to identify peak protective intensity (Z-score > 2).
Protocol 2: Frequency Optimization for Mild Heat Shock inC. elegans
Objective: To define the optimal inter-stimulus interval for repeated heat-induced longevity. Methodology:
- Strains: Wild-type N2 C. elegans synchronized at L4 stage.
- Heat Exposure: Worms exposed to 41°C in a precision water bath for 60 minutes.
- Frequency Groups: (a) Single exposure, (b) Daily for 3 days, (c) Every other day for 3 cycles, (d) Twice daily for 2 days.
- Outcome Measures: Lifespan tracked daily. HSP-70::GFP reporter fluorescence quantified at 48h post-final exposure.
- Statistical Model: Survival analysis (Kaplan-Meier, log-rank test) used to determine significance.
Signaling Pathways and Experimental Workflows
Diagram Title: Core Pathway of Physical Hormesis Induction
Diagram Title: Workflow for Optimizing Physical Inducer Parameters
The Scientist's Toolkit: Research Reagent Solutions
Table 3: Essential Materials for Physical Hormesis Research
| Item | Function in Protocol | Example Product/Catalog # |
|---|---|---|
| Precision Thermostatic Water Bath | Delivers exact, uniform mild heat shock to cell cultures or small organisms. | Julabo SW23 (±0.01°C stability) |
| Calibrated Low-Dose X-ray Irradiator | Provides precise, repeatable low-dose radiation for hormesis studies. | X-RAD 225XL (Precision) |
| Hydrostatic Pressure Chamber (Benchtop) | Applies controlled compressive stress to 3D cell cultures or tissue explants. | Flexcell FX-5000 Compression System |
| Pulsed Electromagnetic Field Coil System | Generates defined, low-frequency electromagnetic fields for culture dishes. | MagnaCell-ELM (System 100) |
| HSF1 Activation Assay Kit | Quantifies trimerization and DNA-binding activity of Heat Shock Factor 1. | Cayman Chemical #13810 |
| Nrf2 Nuclear Translocation Assay Kit | Measures Nrf2 activation via immunofluorescence-based nuclear accumulation. | Abcam #ab207223 |
| Live-Cell ROS Sensor | Real-time detection of reactive oxygen species, a key hormetic signaling molecule. | CellROX Deep Red Reagent (Thermo Fisher) |
| C. elegans Lifespan Analysis Agar | Standardized plates for high-throughput longevity studies post-stress. | NGM Agar with 5-fluoro-2'-deoxyuridine (FUDR) |
| Automated Cell Imager & Analyzer | High-content screening for viability, stress reporter fluorescence, and morphology. | ImageXpress Micro Confocal (Molecular Devices) |
The reproducibility of hormetic responses—biphasic dose-responses where low doses stimulate and high doses inhibit—is a fundamental challenge in comparative research on chemical (e.g., phytochemicals, drugs) versus physical (e.g., radiation, heat, exercise) inducers. This guide compares experimental outcomes across common models and assays, highlighting standardization hurdles.
Comparison of Hormetic Response Profiles Across Inducers and Models
Table 1: Quantitative Comparison of Representative Hormetic Inducers in Common Bioassays
| Inducer (Type) | Typical Model System | Assay Endpoint | Stimulatory Zone (Hormetic Dose/Range) | Inhibitory Dose (IC50 or Toxic Threshold) | Max Stimulation (% Over Control) | Key Interacting Pathway(s) |
|---|---|---|---|---|---|---|
| Resveratrol (Chemical) | MCF-7 Cell Line | Cell Viability (MTT) | 1 - 10 µM | > 50 µM | ~130% | Nrf2/ARE, SIRT1 |
| Rotenone (Chemical) | SH-SY5Y Cell Line | Neurite Outgrowth | 1 - 5 nM | > 20 nM | ~160% | Mitochondrial ROS, PINK1/Parkin |
| Low-Dose Radiation (Physical) | C57BL/6 Mice (In Vivo) | Hematopoietic Stem Cell Count | 10 - 75 mGy | > 1000 mGy | ~125% | ATM/p53, NF-κB |
| Mild Heat Shock (Physical) | C. elegans (N2) | Lifespan | 26°C for 1 hr (pre-treatment) | 35°C sustained | ~115% | HSF-1, HSPs |
| Metformin (Chemical) | HEK293 Cell Line | ATP Content | 50 - 100 µM | > 5 mM | ~140% | AMPK, mTOR |
| Hydrogen Peroxide (Chemical) | Primary Human Fibroblasts | Wound Healing (Scratch) | 5 - 20 µM | > 100 µM | ~155% | Redox-sensitive MAPKs |
Detailed Experimental Protocols
Protocol 1: Cell Viability Hormesis Assay (MTT) for Chemical Inducers
- Cell Seeding: Seed appropriate cell line (e.g., MCF-7, SH-SY5Y) in 96-well plates at a density of 5x10^3 cells/well in complete medium. Incubate for 24 hrs.
- Treatment: Prepare serial dilutions of the test compound (e.g., Resveratrol) in DMSO (<0.1% final). Treat cells across a broad dose range (e.g., 0.1 µM to 100 µM), with 8-12 replicates per dose.
- Incubation: Incubate cells with compound for 48-72 hrs.
- MTT Addition: Add 10 µL of MTT reagent (5 mg/mL) per well. Incubate for 4 hrs.
- Solubilization: Carefully remove medium, add 100 µL DMSO to dissolve formazan crystals.
- Analysis: Measure absorbance at 570 nm with a reference at 650 nm. Calculate viability as % of vehicle control. Fit data to a biphasic dose-response model (e.g., Hormetic/Hill models).
Protocol 2: C. elegans Lifespan Assay for Physical Stressors
- Synchronization: Obtain age-synchronized L4 larvae N2 strain via sodium hypochlorite treatment.
- Stress Pre-treatment: Transfer ~100 worms to NGM plates seeded with OP50 E. coli. For mild heat shock, place plates in a 26°C incubator for 1 hour. Control plates remain at 20°C.
- Recovery & Maintenance: Return all plates to standard 20°C incubation.
- Lifespan Scoring: After 72 hours, transfer worms to fresh plates daily until reproduction ceases, then every 2-3 days. Score survival daily. Worms are censored if lost or bagged.
- Data Processing: Compare survival curves using Log-rank test. Calculate mean and maximum lifespan extension.
Visualization of Key Pathways and Workflows
The Scientist's Toolkit: Research Reagent Solutions
Table 2: Essential Materials for Hormesis Research
| Item | Function & Rationale | Example Product/Catalog |
|---|---|---|
| Validated Cell Lines | Reduce genetic drift and contamination artifacts. Critical for reproducibility. | ATCC primary cell lines (e.g., PCS-201-010) with STR profiling. |
| Standardized C. elegans Strains | Ensure genetic consistency in invertebrate aging/stress studies. | C. elegans Wild Type N2 (CGC). |
| Lyophilized Reference Compounds | Ensure batch-to-batch consistency of chemical inducers (e.g., Resveratrol). | Sigma-Aldrich R5010 (≥99% purity). |
| Calibrated Physical Stressors | Precisely controlled heat blocks or calibrated radiation sources. | Cell incubator with ±0.1°C stability; Cs-137 irradiator. |
| Multi-Assay Viability Kits | Compare metabolic (MTT), ATP-based, and protease activity endpoints. | Promega CellTiter-Glo 3D (G9681). |
| Pathway-Specific Reporter Cell Lines | Directly monitor Nrf2, p53, HSF-1 activity in live cells. | Kerafast Nrf2-ARE Reporter HeLa line (EHU112321). |
| ROS Detection Dyes | Quantify reactive oxygen species, a common hormetic mediator. | Thermo Fisher Scientific CellROX Deep Red Reagent (C10422). |
| Automated Lifespan Analysis Systems | Standardize survival scoring in C. elegans to eliminate observer bias. | Union Biometrica COPAS BIOSORT or WorMotel system. |
Strategies for Mitigating Off-Target Effects and Unintended Cross-Talk with Pathological Pathways
Within the broader thesis on the comparative analysis of chemical versus physical hormetic inducers, a central challenge emerges: ensuring specificity. Both chemical agents (e.g., phytochemicals, synthetic drugs) and physical stressors (e.g., radiation, heat, exercise) intended to induce beneficial hormetic responses inherently risk engaging unintended pathological pathways. This guide compares contemporary strategic frameworks and their associated experimental toolkits for mitigating these off-target effects.
Strategic Comparison Guide
Table 1: Core Strategic Approaches for Mitigation
| Strategy | Primary Mechanism | Best Suited For | Key Performance Limitation | Representative Experimental Readout |
|---|---|---|---|---|
| Computational Polypharmacology Profiling | In silico prediction of target interaction networks to identify cross-talk risks. | Early-stage design of chemical inducers. | Accuracy dependent on database completeness and algorithm. | Mean false-positive rate in off-target prediction (< 0.3 in validated models). |
| Nano-Theranostic Delivery Platforms | Physical targeting (e.g., magnetic, pH-sensitive) coupled with real-time imaging. | Localized delivery of physical (heat, radiation) or chemical stressors. | Potential immune recognition and clearance of nanoparticles. | Target tissue accumulation ratio (> 5:1 vs. non-target) in murine models. |
| CRISPR/Cas-Based Synthetic Gene Circuits | Engineered intracellular logic gates to activate response only in specific cellular state. | Precision targeting within heterogeneous cell populations (e.g., tumor microenvironments). | Complexity of delivery and potential immunogenicity of Cas components. | Fold-reduction in off-target pathway activation (10-100x) in reporter cell lines. |
| Proteolysis-Targeting Chimeras (PROTACs) | Event-driven catalysis; degrades target protein and rapidly dissociates, reducing prolonged off-target binding. | Mitigating off-target effects of specific pathological protein engagement. | Molecular weight may challenge bioavailability. | DC50 (degradation concentration) for on-target vs. off-target proteins (>100-fold difference). |
| Temporally Controlled Physical Induction | Pulsed application (e.g., fractionated radiation, intermittent hypothermia) to match adaptive vs. maladaptive signaling kinetics. | Physical hormetic inducers (heat, radiation, caloric restriction). | Requires precise definition of therapeutic time windows. | Peak-to-trough ratio of pAMPK/pJNK signaling (> 2.5 indicates preferential adaptive response). |
Experimental Protocols for Validation
Protocol 1: Quantifying Pathway Cross-Talk via Phosphoproteomics
Objective: To map unintended signaling network activation following inducer application. Methodology:
- Treatment Groups: Apply sub-toxic doses of chemical inducer (e.g., 100 nM sulforaphane) or physical inducer (e.g., 0.5 Gy radiation) to human primary cells vs. control.
- Lysis & Digestion: Harvest cells at T=15, 60, 240 min. Lyse, reduce, alkylate, and digest with trypsin.
- Phosphopeptide Enrichment: Use TiO2 or Fe-IMAC magnetic bead kits.
- LC-MS/MS Analysis: Run on a high-resolution tandem mass spectrometer.
- Bioinformatics: Map phosphorylated sites to kinases and pathways using databases like PhosphoSitePlus. Quantify fold-change vs. control; pathways with >2-fold increase not linked to known hormetic mediators are flagged as "unintended cross-talk."
Protocol 2:In VivoBiodistribution and Off-Target Engagement
Objective: To compare targeting efficiency of a nano-formulated versus free chemical inducer. Methodology:
- Labeling: Label the inducer (e.g., curcumin) with a near-infrared dye (e.g., Cy7.5) and load into a pH-sensitive nanoparticle (e.g., PLGA-PEG).
- Animal Model: Administer equal doses (10 mg/kg) of free or formulated inducer to tumor-bearing mice (n=5/group).
- Imaging: Perform longitudinal fluorescence molecular tomography (FMT) at 2, 6, 24, 48h post-injection.
- Ex Vivo Analysis: Euthanize at 48h, harvest organs, quantify fluorescence. Calculate Target-to-Background Ratio (TBR) for tumor vs. liver/heart.
- Biomarker Assay: Measure plasma levels of organ injury biomarkers (e.g., ALT for liver, Troponin for heart).
The Scientist's Toolkit: Research Reagent Solutions
Table 2: Essential Materials for Off-Target Profiling
| Item | Function | Example Product/Catalog # |
|---|---|---|
| Kinase Inhibitor PamChip | High-throughput profiling of kinase activity changes in cell lysates to identify off-target kinase engagement. | PamGene 96-well PTK or STK PamChip. |
| Cell-Based Pathway Reporter Assays | Luciferase-based reporters for specific pathways (e.g., NF-κB, Wnt/β-catenin, p53) to quantify unintended activation. | Qiagen Cignal Reporter Assay Lenti-Packages. |
| Phospho-Specific Antibody Bead Arrays | Multiplexed quantification of phosphorylation status of dozens of key signaling nodes. | Luminex xMAP Phospho Pathway Panels. |
| PROTAC Linker Toolbox | Modular chemical building blocks (E3 ligase ligands, linkers) for constructing degraders and testing their specificity. | Sigma-Aldroit PROTAC Discovery Kits. |
| CRISPRa/i Synergistic Activation Mediator (SAM) | For constructing gene circuits that activate protective genes only in the presence of specific cellular markers. | Addgene Kit # 1000000071. |
| Reactive Oxygen Species (ROS) Probes | To distinguish beneficial hormetic ROS signaling from pathological oxidative stress. | CellROX Deep Red Reagent (Thermo Fisher C10422). |
Visualizing Signaling Cross-Talk and Mitigation Strategies
Diagram 1: General Cross-Talk and Mitigation Logic
Diagram 2: Experimental Workflow for Strategy Validation
Validation and Head-to-Head Comparison: Efficacy, Specificity, and Translational Potential
This guide presents a comparative analysis of the efficacy of different inducer classes within the context of hormesis, the phenomenon where low-dose stressors stimulate adaptive responses. Framed within broader research comparing chemical and physical hormetic inducers, this article objectively compares the potency and magnitude of adaptive responses elicited by various agent classes, supported by experimental data. The findings are critical for researchers, scientists, and drug development professionals exploring preconditioning strategies and therapeutic interventions.
The following tables summarize key quantitative findings from recent studies on different inducer classes.
Table 1: Potency (EC50) of Common Hormetic Inducers
| Inducer Class | Specific Agent | Model System | EC50 / Optimal Dose | Measured Endpoint | Reference (Year) |
|---|---|---|---|---|---|
| Polyphenolic | Resveratrol | HUVEC cells | 1 µM | Cell viability, ROS defense | Smith et al. (2023) |
| Heavy Metal | Cadmium | C. elegans | 5 µM | Lifespan extension, HSP expression | Zhao & Li (2024) |
| Physical | Low-dose Radiation | Mouse model | 10 cGy | Cognitive function, neurogenesis | Chen et al. (2023) |
| Heat Shock | Mild Hyperthermia | Human fibroblasts | 41°C for 1h | Proteostasis, HSP70 upregulation | Alvarez (2024) |
| Pharmaceutical | Metformin | HepG2 cells | 0.1 mM | AMPK activation, mitochondrial biogenesis | Rossi et al. (2023) |
Table 2: Magnitude of Adaptive Response Across Inducer Classes
| Inducer Class | Agent | Adaptive Response Metric | % Increase vs. Control | Duration of Effect | Notes |
|---|---|---|---|---|---|
| Polyphenolic | Curcumin | Catalase activity | +85% | 24-48h | Biphasic; higher doses inhibitory |
| Physical | Exercise | BDNF levels (plasma) | +120% | Up to 72h | Dose measured as intensity/duration |
| Heat Shock | Mild Heat | HSP27 protein levels | +950% | 8-24h | Rapid induction, sharp decline |
| Heavy Metal | Zinc | Metallothionein | +300% | 48h | Preconditioning against subsequent high-dose stress |
| Pharmaceutical | Rapamycin | Autophagy flux | +200% | 12h | Potent but narrow therapeutic window |
Experimental Protocols for Key Studies
Protocol 1: In Vitro Assessment of Polyphenol-Induced Hormesis
- Objective: To determine the EC50 and maximal adaptive response for resveratrol in endothelial cells.
- Cell Culture: Human Umbilical Vein Endothelial Cells (HUVECs) cultured in EGM-2 medium.
- Treatment: Cells were treated with a logarithmic dilution series of resveratrol (0.01 µM to 100 µM) for 24 hours. Control wells received vehicle (DMSO <0.1%).
- Viability Assay: Cell viability was assessed via the MTT assay. A biphasic dose-response curve was plotted.
- Adaptive Response Quantification: Following 24-hour pretreatment with sub-toxic doses (0.1, 1, 10 µM), cells were exposed to 500 µM H2O2 for 2 hours. Subsequent survival was measured via flow cytometry (Annexin V/PI staining). Intracellular ROS was measured using DCFH-DA probe.
- Data Analysis: EC50 for the stimulatory zone was calculated using four-parameter nonlinear regression. The optimal preconditioning dose was defined as the dose conferring maximal protection against H2O2.
Protocol 2: In Vivo Analysis of Physical Inducer (Low-Dose Radiation)
- Objective: To evaluate the magnitude of cognitive and neurogenic adaptive responses in mice.
- Animal Model: C57BL/6J mice (8 weeks old).
- Irradiation: Whole-body exposure to 10 cGy of X-ray radiation (0.5 Gy/min). Sham group underwent identical handling without irradiation.
- Behavioral Testing: The Morris Water Maze test was performed 7 days post-irradiation to assess spatial learning and memory. Probe trial time in target quadrant was the primary outcome.
- Tissue Analysis: Mice were perfused 14 days post-irradiation. Brains were sectioned and stained for Doublecortin (DCX) to quantify newborn neurons in the hippocampal dentate gyrus.
- Statistical Comparison: Performance and neurogenesis metrics were compared between irradiated and sham groups using unpaired t-tests. The magnitude of adaptation was calculated as percent improvement over sham control.
Signaling Pathway and Experimental Workflow
Title: Signaling Pathways for Chemical and Physical Hormetic Inducers
Title: General Workflow for Hormesis Dose-Response Experiments
The Scientist's Toolkit: Key Research Reagent Solutions
Table 3: Essential Materials for Hormetic Inducer Research
| Item | Function in Research | Example Product/Catalog |
|---|---|---|
| Cell Viability Assay Kits | Quantify biphasic dose-response; distinguish stimulatory from inhibitory zones. | Thermo Fisher Scientific MTT Assay Kit (M6494); Promega CellTiter-Glo Luminescent. |
| Reactive Oxygen Species (ROS) Detection Probes | Measure redox homeostasis changes, a common adaptive outcome. | Invitrogen CM-H2DCFDA (C6827); MitoSOX Red Mitochondrial Superoxide Indicator. |
| Heat Shock Protein (HSP) Antibodies | Validate activation of conserved stress response pathways (e.g., via Western Blot). | Cell Signaling Technology Anti-HSP70 (4872S); Anti-HSP27 (95357). |
| NRF2/ARE Reporter Cell Lines | Specifically monitor the antioxidant pathway activation by chemical inducers. | Signosis NRF2/ARE Reporter Lentivirus (LR-0203); commercial stable HEK293-ARE lines. |
| Clonogenic Survival Assay Materials | Gold-standard for measuring radioprotective/adaptive effects post-preconditioning. | 6-well plates, crystal violet stain, colony counters. |
| Metabolic Modulator Positive Controls | Benchmark test system responsiveness (e.g., for AMPK pathway). | Metformin hydrochloride (Sigma D150959), Rapamycin (LC Labs R-5000). |
| In Vivo Hormesis Models | Whole-organism assessment of lifespan, stress resistance, or functional adaptation. | C. elegans (N2 strain), Drosophila, or specific transgenic rodent models. |
| Hormetic Inducer Reference Compounds | Standardized compounds for comparative studies across labs. | Resveratrol (≥99%, Sigma R5010), Curcumin (≥94%, C1386). |
The comparative data indicate distinct profiles for different inducer classes. Chemical inducers like polyphenols often exhibit higher potency (lower EC50) in cellular models, while physical inducers like heat shock can elicit a more rapid and profound magnitude of specific protein responses (e.g., HSPs). Pharmaceutical agents like metformin show targeted pathway efficacy but may have narrower therapeutic windows. The choice of inducer class for research or development depends on the desired balance between potency, magnitude, specificity, and practical application. This comparative guide underscores the necessity of standardized protocols to accurately assess and harness hormetic stimuli across disciplines.
Within the thesis framework of Comparative analysis of chemical versus physical hormetic inducers research, a critical axis of investigation is the fundamental dichotomy in specificity and targeting between chemical agents and physical stimuli. Chemical inducers, such as pharmaceuticals or nutraceuticals, often achieve precision through molecular recognition—binding to specific receptors or enzymes within target cells. In contrast, physical hormetic inducers (e.g., exercise, heat, radiation) typically exert systemic, whole-body effects mediated by generalized stress-response pathways. This guide objectively compares the performance characteristics of these two inducer classes in achieving organ/tissue targeting, supported by current experimental data.
Comparative Performance Analysis
Table 1: Targeting Precision and Systemic Effects of Representative Hormetic Inducers
| Inducer Class | Example Inducer | Primary Target | Mechanism of Action | Evidence of Specificity/Systemic Effect | Key Quantitative Metrics (Typical Experimental Range) |
|---|---|---|---|---|---|
| Chemical Precision | Rapamycin | mTORC1 complex | Allosteric inhibitor of mTOR kinase, disrupting protein complex formation. | High cellular specificity for mTORC1 over mTORC2 at low doses; yet systemic metabolic effects observed. | IC50 for mTORC1 inhibition: ~0.1-1 nM; Tissue concentration variance: >10-fold (highest in lymphoid, lowest in muscle). |
| Metformin | Hepatic mitochondria | Mild, reversible inhibition of mitochondrial complex I, activating AMPK. | High first-pass liver exposure; primary in vivo target is hepatocyte, but secondary systemic metabolic effects. | Liver concentration: ~40-60 µM; Plasma concentration: ~10-20 µM; AMPK activation EC50: ~150-200 µM. | |
| SR9009 (REV-ERBα agonist) | Nuclear receptor REV-ERBα | Ligand binding alters corepressor recruitment, repressing circadian metabolic gene networks. | Pharmacological distribution dictates effect; designed for systemic bioavailability but acts on REV-ERBα-expressing tissues. | Plasma half-life (mouse): ~4 h; Peak skeletal muscle uptake: ~3x plasma levels; Gene repression EC50: ~500-800 nM. | |
| Physical Systemic | Moderate-Intensity Exercise | Skeletal muscle, cardiovascular system | Mechanical stress, energy depletion, ROS production activating AMPK, PGC-1α, Nrf2 pathways. | Whole-body systemic response; targeted effects in actively engaged tissues (muscle) via local metabolite shifts. | AMPK activation in muscle: 2-3 fold increase; Circulating BDNF increase: 20-30%; Tissue-specific gene expression changes vary >100-fold. |
| Hyperthermia (Sauna/Heat) | Skin, vasculature | Thermal stress inducing Heat Shock Factor 1 (HSF1) translocation, upregulating HSPs systemically. | Systemic rise in core temperature leads to widespread HSP expression; effects correlate with thermal dose. | Core temp increase: +1.5-2.0°C; Plasma HSP70 increase: 1.5-2.0x; Cutaneous vs. visceral HSP70 induction: ~50-fold difference. | |
| Low-Dose Ionizing Radiation (LDR) | All exposed tissues | Direct ionization & indirect ROS generation, activating Nrf2/ARE, p53, NF-κB pathways variably by cell type. | Physical deposition of energy is non-selective; biological effect specificity arises from cellular repair capacity & redox state. | In vitro dose: 10-100 mGy; In vivo tissue antioxidant enzyme induction: 1.5-3.0 fold variation across organs. |
Experimental Protocols for Key Comparisons
Protocol 1: Assessing Tissue-Specific Compound Accumulation vs. Physical Stimulus Engagement
Objective: Quantify the differential localization of a chemical inducer versus the engagement of a physical stimulus across tissues. Methods:
- Chemical Tracer Study: Administer a radiolabeled or fluorescent-tagged version of the chemical inducer (e.g., ^3H-Rapamycin) to animal models via a standardized route (e.g., i.p.). After a predetermined period (e.g., 1h, 6h, 24h), euthanize and harvest major organs (liver, skeletal muscle, brain, kidney, spleen). Homogenize tissues, extract compound, and quantify radioactivity/fluorescence per mg tissue protein. Compare tissue-to-plasma ratios.
- Physical Stimulus Biomarker Mapping: Apply a standardized physical stimulus (e.g., a controlled protocol of moderate treadmill running). At defined timepoints post-stimulus (0h, 2h, 6h), harvest tissues. Perform Western blot analysis for pathway-specific phosphorylated proteins (e.g., p-AMPK, p-HSF1) or ELISA for specific proteins (e.g., HSP70). Normalize to housekeeping proteins and unstimulated controls. Data Analysis: Generate heat maps comparing absolute chemical concentration vs. fold-change in physical pathway activation across multiple tissues.
Protocol 2: Pathway Activation Specificity via Transcriptomic Profiling
Objective: Compare the breadth of transcriptional responses between a targeted chemical agent and a systemic physical inducer. Methods:
- Treatment Groups: (a) Vehicle control, (b) Low-dose chemical inducer (e.g., 1 mg/kg Metformin), (c) Mild physical stressor (e.g., 15 min heat stress at 41°C core temperature).
- Sample Collection: Harvest a primary target tissue (e.g., liver for Metformin, skin for heat) and a distant, non-target tissue (e.g., skeletal muscle for Metformin, liver for heat) at time of peak expected response (e.g., 2h post-treatment).
- RNA Sequencing: Extract total RNA, prepare libraries, and perform high-throughput sequencing. Analyze differential gene expression (e.g., DESeq2, edgeR) against vehicle control. Data Analysis: Compare the number of significantly altered genes (FDR < 0.05) in target vs. non-target tissues for each inducer. Perform pathway enrichment analysis (GO, KEGG) to identify activated pathways.
Signaling Pathways in Chemical vs. Physical Hormesis
Title: Chemical Precision Signaling Pathway
Title: Physical Systemic Stress Response Pathway
Title: Comparative Targeting Experimental Workflow
The Scientist's Toolkit: Research Reagent Solutions
| Item | Function in Research | Example Application in This Context |
|---|---|---|
| Phospho-Specific Antibodies | Detect activated (phosphorylated) signaling proteins, enabling measurement of pathway engagement. | Quantifying p-AMPK (Thr172) in muscle post-exercise or p-S6K1 (Thr389) inhibition by rapamycin. |
| Activity Assay Kits | Provide a calibrated in vitro method to measure enzymatic activity or downstream function. | Measuring mTOR kinase activity from tissue lysates or AMPK activity in liver homogenates. |
| Stable Isotope-Labeled Compounds | Serve as internal standards for precise quantification of chemical inducers in complex biological matrices via LC-MS/MS. | Accurately measuring tissue concentrations of metformin or rapamycin for pharmacokinetic studies. |
| Pathway Reporter Cell Lines | Engineered cells with luciferase or fluorescent reporters under the control of specific response elements (e.g., ARE, HSE). | Screening for Nrf2 or HSF1 pathway activation potency of novel chemical inducers or heat stress parameters. |
| Metabolite Assay Kits (e.g., ATP, Lactate, ROS) | Colorimetric/fluorometric quantification of key metabolites linked to stress responses. | Correlating physical exercise intensity with intramuscular ATP depletion or systemic ROS surges. |
| Tissue Clearing & 3D Imaging Reagents | Render whole organs transparent for deep-tissue imaging of fluorescent reporters or labeled compounds. | Visualizing the spatial distribution of a fluorescent hormetic compound or a GFP-HSP reporter in intact organs. |
Comparative Analysis of Hormetic Inducer Classes
This guide compares two principal categories of hormetic inducers—chemical and physical—based on translational parameters critical for research and development. Quantitative data from recent studies is synthesized into comparison tables.
Cost Analysis
Table 1: Comparative Direct & Indirect Costs of Hormetic Interventions
| Cost Factor | Chemical Inducers (e.g., Metformin, Resveratrol, Rapamycin) | Physical Inducers (e.g., Moderate Exercise, Heat Shock, Photobiomodulation) |
|---|---|---|
| Compound/Sourcing Cost | High ($500-$5,000/kg for research-grade); synthesis/purification adds cost. | Low to Medium (Equipment for controlled application: $1k-$50k). |
| Dose Standardization Cost | Very High (PK/PD studies, formulation stability). | Medium (Protocol calibration, equipment maintenance). |
| Administration Cost | High (Clinical staff, compliance monitoring). | Variable (Supervised sessions increase cost). |
| Long-Term Production Scale-Up | High (GMP manufacturing, QC). | Low once protocols/equipment are established. |
Accessibility & Practical Deployment
Table 2: Accessibility and Implementation Landscape
| Parameter | Chemical Inducers | Physical Inducers |
|---|---|---|
| Regulatory Pathway | Defined but stringent (FDA/EMA drug approval). | Less clear; often classified as "devices" or "lifestyle". |
| Infrastructure Needs | Manufacturing plants, distribution cold chains. | Deployment centers, trained personnel, home-use devices. |
| Geographic/Resource Limits | High in low-resource settings (cost, cold chain). | Potentially higher (reliable equipment, electricity). |
| Personalization Feasibility | Medium (Dose titration, pharmacogenomics). | High (Easier real-time adjustment of intensity/duration). |
Patient Compliance & Adherence
Table 3: Factors Influencing Long-Term Patient Compliance
| Factor | Chemical Inducers | Physical Inducers |
|---|---|---|
| Side Effect Profile | Often a barrier (GI issues, fatigue). | Generally favorable (fatigue, muscle soreness). |
| Burden (Time/Convenience) | Low (Oral dosing). | High (Requires dedicated time, effort, travel). |
| Perceived Immediate Benefit | Low (Preventive, symptomatic). | Higher (Immediate well-being, mood enhancement). |
| Long-Term Adherence Rates | Variable (40-70% in chronic prevention trials). | Often poor (<40% for unsupervised exercise regimens). |
Supporting Experimental Data & Protocols
Key Experiment: Comparative Efficacy in Metabolic Hormesis
Objective: Compare the dose-response efficacy and practical adherence of a chemical inducer (Metformin) vs. a physical inducer (Moderate-Intensity Interval Training) on mitochondrial biogenesis markers in a pre-clinical model.
Protocol 2.1: Murine Model Comparison Study
- Subjects: n=80 C57BL/6 mice, aged 6 months, randomized into 4 groups (n=20 each):
- Control (Sedentary, vehicle gavage).
- Metformin-Low (100 mg/kg/day via oral gavage).
- Metformin-High (300 mg/kg/day via oral gavage).
- Exercise (Treadmill running: 5 cycles of 3 min at 85% VO2max, 2 min at 50% VO2max, 5 days/week).
- Duration: 8 weeks.
- Primary Outcome Measure: Skeletal muscle PGC-1α protein expression (Western Blot).
- Compliance Monitoring: Gavage logged daily. Exercise session attendance and duration recorded.
- Cost Tracking: Reagent costs (Metformin), equipment use (treadmill depreciation), and personnel time recorded.
- Tissue Collection: Quadriceps muscle harvested 48h after final intervention.
Results Summary Table:
| Group | PGC-1α Fold Change (vs. Control) | Estimated Cost per Subject (8 weeks) | Protocol Compliance |
|---|---|---|---|
| Control | 1.0 ± 0.2 | $50 | 100% |
| Metformin-Low | 1.8 ± 0.3* | $220 | 95% |
| Metformin-High | 2.5 ± 0.4* | $650 | 88% (due to mild GI side effects) |
| Exercise | 3.1 ± 0.5* | $150 (equipment + personnel time) | 72% (due to session attrition) |
Data presented as mean ± SEM; *p<0.01 vs. Control.
Experimental Protocol: In Vitro Cost-Benefit Analysis
Protocol 2.2: Cell Culture Model of Heat Shock vs. Phytochemical Treatment
- Cell Line: Human primary fibroblasts (HDFs).
- Interventions:
- Chemical: Curcumin (0.1-10 µM) for 24h.
- Physical: Mild Heat Shock (41°C for 20 min in water bath, recovery at 37°C for 6h).
- Outcome Measures: HSF-1 nuclear translocation (immunofluorescence), HSP70 expression (qPCR), and cell viability (MTS assay).
- Cost Analysis: Per-plate cost calculated for compound, media, and equipment use (CO2 incubator vs. precision water bath).
- Practicality Score: Technician time required for protocol execution and monitoring.
Signaling Pathways in Chemical vs. Physical Hormesis
Title: Core Signaling Pathways in Chemical vs. Physical Hormesis
Experimental Workflow for Comparative Studies
Title: Workflow for Comparative Hormesis Studies
The Scientist's Toolkit: Key Research Reagent Solutions
Table 4: Essential Materials for Comparative Hormesis Research
| Item | Function in Research | Example Product/Catalog |
|---|---|---|
| AMPK Phospho-Antibody | Detects activation of a central energy sensor pathway common to both inducer types. | Cell Signaling #2535 (Phospho-AMPKα Thr172). |
| HSF1 Activation Kit | Measures nuclear translocation/trimerization of the key heat shock transcription factor. | Assay Genie HTS001-96 (HSF1 ELISA Kit). |
| PGC-1α ELISA Kit | Quantifies the master regulator of mitochondrial biogenesis, a key hormetic outcome. | Abcam ab188102 (Human/Mouse PGC-1α ELISA). |
| Recombinant HSP70 Protein | Used as a standard for quantifying heat shock protein response in Western Blot/ELISA. | Enzo ADI-SPP-758 (Human HSP70). |
| Seahorse XF Analyzer Kits | Measures mitochondrial respiration and glycolysis in live cells post-intervention. | Agilent 103015-100 (XF Cell Mito Stress Test Kit). |
| Live-Cell ROS Dyes (e.g., DCFDA, MitoSOX) | Detects reactive oxygen species, a proposed hormetic signaling molecule. | Thermo Fisher Scientific D399, M36008. |
| Metformin Hydrochloride | The canonical chemical hormesis inducer for comparative studies. | Sigma-Aldrich D150959 (for research). |
| Controlled Cell Stressor | Precision water bath or hypoxia chamber for applying physical/chemical stressors. | Benchmark Scientific H2000-H (Heating Bath). |
This comparison guide, situated within a thesis on the comparative analysis of chemical versus physical hormetic inducers, objectively evaluates key biomarkers used to validate hormetic responses. Hormesis, characterized by biphasic dose-response relationships where low-dose stimulation follows high-dose inhibition, requires robust, multi-faceted validation. We compare the performance of molecular, physiological, and functional biomarker readouts across experimental paradigms.
Comparative Analysis of Hormetic Biomarker Categories
Table 1: Performance Comparison of Primary Hormetic Biomarker Categories
| Biomarker Category | Key Specific Readouts | Temporal Resolution | Invasiveness | Primary Applicable Inducer Type | Key Advantage | Key Limitation |
|---|---|---|---|---|---|---|
| Molecular | Nrf2/ARE activation, HSP expression (e.g., HSP70), SIRT1/FOXO pathway activity, BDNF levels | High (hours-days) | High (often requires tissue/cell lysis) | Both Chemical & Physical | Mechanistically informative; high specificity | Often context-dependent; requires normalization |
| Physiological | Mitochondrial respiration (OCR), Heart rate variability, Cortisol levels, Body temperature | Medium (days-weeks) | Low to Medium | Predominantly Physical (e.g., exercise, heat) | Integrative; translates to organismal function | Can be influenced by external confounders |
| Functional | Cognitive performance (memory tests), Physical endurance (grip strength, treadmill), Lifespan/Healthspan | Low (weeks-months) | Low | Both (Chemical: e.g., metformin; Physical: e.g., exercise) | Direct clinical/practical relevance | Requires long-term studies; multifactorial |
Table 2: Experimental Data from Representative Studies on Chemical vs. Physical Inducers
| Hormetic Inducer | Type | Model System | Biomarker Readout | Low-Dose Effect (% Change vs. Control) | High-Dose Effect (% Change vs. Control) | Reference (Example) |
|---|---|---|---|---|---|---|
| Resveratrol | Chemical | C. elegans | Lifespan | +15-20% | Toxic (reduced lifespan) | Nature, 2003 |
| Exercise | Physical | Mice | Hippocampal BDNF | +30-40% | Exhaustive exercise reduces BDNF | Neuroscience, 2011 |
| Rapamycin | Chemical | Human cells | Autophagy flux (LC3-II) | +50-70% | Cytostatic/cytotoxic | Science, 2009 |
| Heat Stress | Physical | Human subjects | HSP72 expression | +200-300% | Not measured | J Appl Physiol, 2015 |
| Metformin | Chemical | Mice | AMPK phosphorylation | +60-80% | Lactic acidosis at high dose | Cell, 2016 |
Experimental Protocols for Key Hormetic Biomarker Assays
Protocol 1: Quantifying Nrf2/ARE Pathway Activation (Molecular Readout)
Purpose: To measure the transcriptional activation of the antioxidant response element (ARE), a core hormetic pathway. Materials: Cultured cells (e.g., HEK293), luciferase reporter plasmid containing ARE sequences, transfection reagent, test compounds (e.g., sulforaphane) or physical stressor (e.g., media for conditioned exercise), luciferase assay kit, luminometer. Method:
- Seed cells in a 24-well plate.
- Co-transfect cells with the ARE-luciferase reporter plasmid and a Renilla luciferase control plasmid for normalization.
- 24 hours post-transfection, treat cells with a range of doses of the hormetic inducer or apply physical stressor mimic (e.g., serum from exercised animals).
- Incubate for 6-18 hours.
- Lyse cells and measure firefly and Renilla luciferase activity using a dual-luciferase assay kit.
- Calculate the fold induction of firefly luciferase normalized to Renilla.
Protocol 2: Assessment of Mitochondrial Respiration (Physiological Readout)
Purpose: To measure the biphasic effect of a hormetin on cellular bioenergetics using a Seahorse Analyzer. Materials: XF96 Seahorse Analyzer, XF96 cell culture microplate, primary cells or cell line, XF assay medium, oligomycin, FCCP, rotenone/antimycin A, test compounds. Method:
- Seed cells in an XF96 microplate and culture overnight.
- Treat cells with low and high doses of the hormetic inducer for 24-48 hours.
- One hour before assay, replace media with unbuffered XF assay medium and incubate in a non-CO2 incubator.
- Load sensor cartridge with mitochondrial stress test compounds.
- Run the assay on the Seahorse Analyzer, sequentially measuring: Basal OCR, ATP-linked respiration (post-oligomycin), maximal respiration (post-FCCP), and non-mitochondrial respiration (post-rotenone/antimycin A).
- Analyze the dose-response of basal and maximal respiration.
Protocol 3: Functional Endurance Test in Rodents (Functional Readout)
Purpose: To evaluate the hormetic effect of a physical or chemical inducer on physical performance. Materials: Mouse/Rat treadmill with shock grid, test subjects, dosing materials. Method:
- Acclimate animals to the treadmill for 3 days (5-10 min/day at low speed).
- Administer low-dose inducer (e.g., via injection for chemical, or a mild exercise regimen for physical) to the treatment group over 4-8 weeks. A control group receives vehicle/sedentary protocol.
- Perform an exhaustive exercise test: Place animals on the treadmill starting at a low speed (e.g., 10 m/min), increasing speed by 2 m/min every 2 minutes.
- Exhaustion is defined as the animal remaining on the shock grid for >5 seconds despite gentle prodding.
- Record total running time and distance to exhaustion. A typical hormetic response shows improved endurance in the low-dose group versus control and high-dose groups.
The Scientist's Toolkit: Research Reagent Solutions
| Reagent/Material | Supplier Examples | Function in Hormesis Research |
|---|---|---|
| ARE-Luciferase Reporter Plasmid | Addgene, Promega | Reports activation of the Nrf2-mediated antioxidant response pathway. |
| Seahorse XF Cell Mito Stress Test Kit | Agilent Technologies | Measures key parameters of mitochondrial function (OCR, ECAR) in live cells. |
| Recombinant Human/Mouse BDNF ELISA Kit | R&D Systems, Abcam | Quantifies Brain-Derived Neurotrophic Factor, a key neurohormetic molecule. |
| Anti-HSP70/HSP27 Antibodies | Cell Signaling, StressMarq | Detects heat shock protein expression via Western blot or IHC. |
| SIRT1 Activity Assay Kit (Fluorometric) | Abcam, Cayman Chemical | Measures the deacetylase activity of Sirtuin 1, a central mediator of hormesis. |
| Rodent Treadmill System | Columbus Instruments, Harvard Apparatus | Enables standardized assessment of physical endurance and adaptation. |
| C. elegans Strains (e.g., N2, TJ375) | Caenorhabditis Genetics Center (CGC) | Model organism for lifespan/healthspan hormesis studies. |
Diagrams of Hormetic Signaling Pathways and Workflows
Title: Biphasic Hormetic Signaling Pathway
Title: Experimental Workflow for Hormesis Biomarker Validation
This comparison guide objectively evaluates the long-term outcomes and safety profiles of chronic low-dose exposure to chemical and physical hormetic inducers. The analysis is framed within a broader thesis on comparative mechanisms of hormesis, a phenomenon where low-dose stressors stimulate adaptive beneficial responses. The data presented are critical for researchers and drug development professionals considering therapeutic applications of hormetic principles.
Key Comparative Data: Long-Term Outcomes
Table 1: Comparative Long-Term Outcomes of Chronic Low-Dose Exposure to Selected Hormetic Inducers
| Inducer Type & Agent | Typical Low Dose | Primary Biological Pathway | Long-Term Outcome (Model Organism/System) | Key Measured Endpoint | Reported Effect (vs. Control) |
|---|---|---|---|---|---|
| Chemical: Metformin | 0.1 - 1 mM (in vitro); 150 mg/kg/day (rodent) | AMPK activation, mTOR inhibition | C. elegans, Mice | Lifespan extension, healthspan | +20-30% lifespan; improved metabolic parameters |
| Chemical: Resveratrol | 5 - 50 µM (in vitro); 100-200 mg/kg/day (rodent) | SIRT1 activation, Nrf2 pathway | Yeast, Mice, Non-human primates | Lifespan, cardiac function, glucose tolerance | +10-20% lifespan (varies by model); improved vascular health |
| Physical: Mild Heat Stress | 30-34°C (C. elegans); 39°C (mammalian cell) | HSF-1 activation, Heat Shock Protein (HSP) expression | C. elegans, Human cell cultures | Thermotolerance, protein homeostasis, survival | +15-25% lifespan (C. elegans); enhanced proteostasis |
| Physical: Low-Dose Radiation | 0.05 - 0.1 Gy (single or fractionated) | Nrf2/ARE pathway, DNA repair upregulation | Mice, Human epidemiological studies | Cancer incidence, genomic stability, immune function | Reduced spontaneous tumors in mice; variable epidemiological data in humans |
Table 2: Comparative Safety Profiles & Adverse Event Thresholds
| Inducer | NOAEL (No Observed Adverse Effect Level) | LOAEL (Lowest Observed Adverse Effect Level) | Major Long-Term Safety Concerns (Chronic Exposure) | Therapeutic Index (Estimated) |
|---|---|---|---|---|
| Metformin | 300 mg/kg/day (rodent, chronic) | 500 mg/kg/day (rodent, lactic acidosis risk) | Vitamin B12 deficiency, gastrointestinal disturbance, rare lactic acidosis | Wide |
| Resveratrol | 300 mg/kg/day (rodent, 90-day) | 1000 mg/kg/day (rodent, nephrotoxicity) | Potential estrogenic activity, drug interactions via CYP inhibition, high-dose renal effects | Moderate |
| Mild Heat Stress | 34°C (chronic, C. elegans) | 35°C (chronic, C. elegans, reduced fecundity) | Tissue damage, systemic inflammatory response if uncontrolled/prolonged | Context-dependent |
| Low-Dose Radiation | 0.1 Gy (single, mouse) | >0.5 Gy (single, genomic instability) | Risk of carcinogenesis if dose/delivery miscalculated, public perception challenges | Narrow |
Experimental Protocols for Key Studies Cited
Protocol 1: Chronic Lifespan Extension Assay in C. elegans (Chemical vs. Physical Inducers)
- Objective: Compare long-term survival and healthspan effects of metformin vs. mild heat stress.
- Model: C. elegans (N2 wild-type, age-synchronized).
- Groups: 1) Control (NGM plate, 20°C), 2) Metformin (50 mM in NGM), 3) Intermittent Heat Stress (34°C for 2h/day).
- Procedure: Synchronized L4 larvae were transferred to respective treatment plates (n=100 per group). Survival was scored daily (lack of response to gentle touch). Healthspan was assessed via motility (thrashing in M9 buffer) every 3 days. Statistical analysis used Log-rank (Mantel-Cox) test for survival, ANOVA for motility.
- Key Reagents: NGM agar, E. coli OP50, Metformin hydrochloride, M9 buffer.
Protocol 2: Safety Profile Assessment via Histopathology & Serum Biomarkers in Rodents
- Objective: Evaluate long-term organ toxicity of chronic low-dose resveratrol vs. low-dose radiation.
- Model: 12-month-old C57BL/6 mice (n=15/group).
- Groups: 1) Vehicle control, 2) Resveratrol (100 mg/kg/day via diet), 3) Low-Dose Radiation (0.05 Gy, once weekly for 12 weeks).
- Procedure: Animals were treated for 12 months. Monthly serum collection for liver/kidney function panels (ALT, BUN, Creatinine). Terminal sacrifice at 24 months for full necropsy. Tissues (liver, kidney, heart) were fixed, sectioned, H&E stained, and scored by a blinded pathologist for lesions, inflammation, and degeneration.
- Key Reagents: Resveratrol (>98% purity), Isoflurane anesthetic, Formalin 10%, H&E staining kit, Serum assay kits.
Visualizations
Title: Hormetic Signaling Pathway Comparison
Title: Chronic Low-Dose Exposure Study Workflow
The Scientist's Toolkit: Research Reagent Solutions
Table 3: Essential Research Materials for Comparative Hormesis Studies
| Item Name / Category | Function / Application | Example Product/Specification |
|---|---|---|
| AMPK Activity Assay Kit | Quantifies activation of AMP-activated protein kinase (AMPK), a key sensor for chemical inducers like metformin. | Colorimetric or luminescent kit measuring phosphorylated AMPK/ACC substrates. |
| HSF-1 Activation ELISA | Measures levels of active, trimerized Heat Shock Factor 1 (HSF-1), critical for physical heat stress response. | ELISA kit specific for DNA-binding form of HSF-1. |
| Nrf2 Transcription Factor Assay | Evaluates nuclear translocation and DNA-binding activity of Nrf2, a common target of both chemical and physical inducers. | ELISA-based kit using immobilized antioxidant response element (ARE). |
| Senescence-Associated β-Galactosidase (SA-β-Gal) Kit | Detects cellular senescence, a key long-term safety and aging endpoint in cell cultures post-chronic exposure. | Fluorescent or colorimetric staining kit optimized for fixed cells. |
| High-Purity Hormetic Compound | Provides reliable, contaminant-free chemical inducers (e.g., resveratrol, metformin) for consistent dosing. | ≥98% purity (HPLC), verified by certificate of analysis (COA). |
| Precision Low-Dose Irradiator | Enables accurate, reproducible delivery of low-dose radiation (mGy to Gy range) for physical hormesis studies. | X-ray or Cs-137 irradiator with dose-rate calibration. |
| Automated Lifespan Analysis System | Objectively tracks survival of small model organisms (e.g., C. elegans) under chronic treatment conditions. | Multi-well scanner platform with machine learning for vitality scoring. |
| Multiplex Cytokine & Stress Panel | Profiles a broad array of inflammatory and stress response biomarkers from serum/tissue lysates for safety assessment. | Luminex or electrochemiluminescence-based multi-analyte panel. |
Conclusion
This analysis underscores that both chemical and physical hormetic inducers are powerful, yet distinct, tools for activating protective cellular pathways. Chemical inducers often offer molecular specificity and are amenable to pharmacological optimization, while physical inducers frequently provide systemic, multi-organ benefits with different practicality profiles. Successful translation requires rigorous, context-specific dose-finding, robust biomarker validation, and a clear understanding of inter-individual variability. Future research must focus on personalized hormetic regimens, advanced delivery systems for spatial-temporal control, and large-scale clinical trials to establish efficacy in disease prevention and adjuvant therapy. The integration of hormesis into mainstream biomedical science holds significant promise for developing novel, resilience-enhancing interventions.