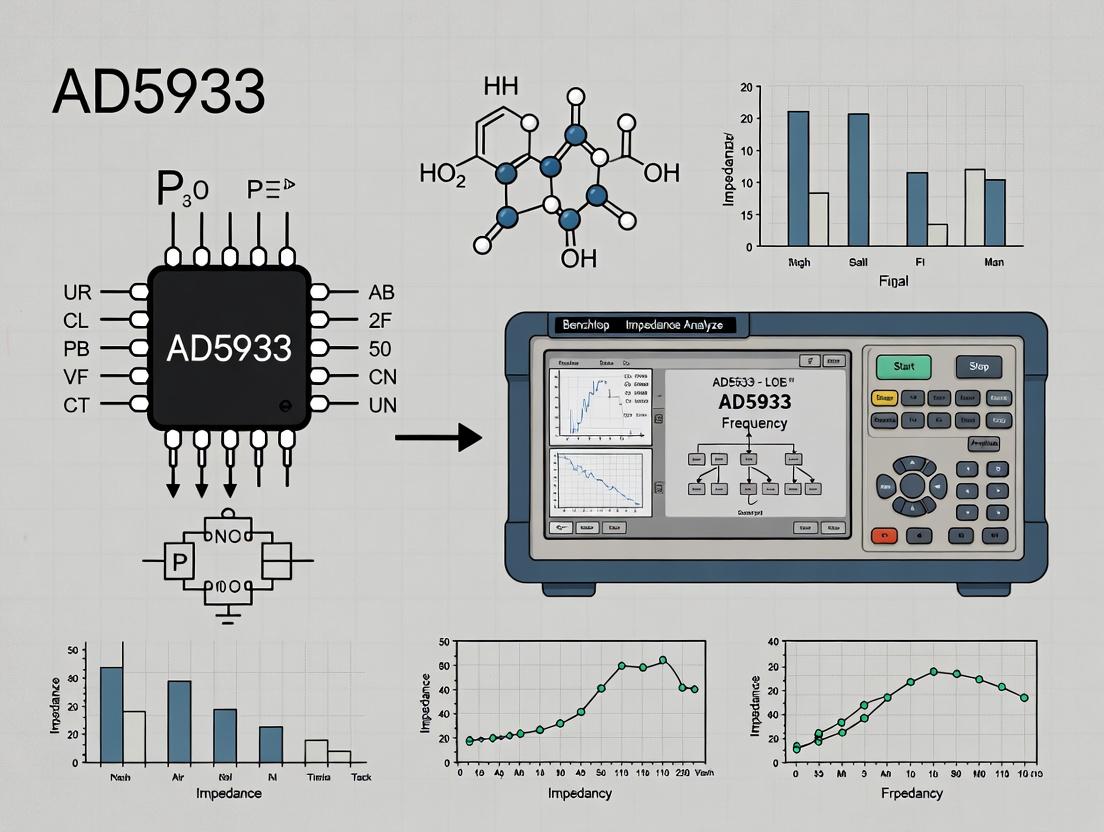
AD5933 vs. Benchtop Impedance Analyzers: A Lab Scientist's Complete Guide to Biosensor & Cell Analysis Tools
This article provides a comprehensive comparison of the AD5933 integrated circuit-based impedance measurement system and traditional benchtop impedance analyzers for biomedical research and drug development applications.
AD5933 vs. Benchtop Impedance Analyzers: A Lab Scientist's Complete Guide to Biosensor & Cell Analysis Tools
Abstract
This article provides a comprehensive comparison of the AD5933 integrated circuit-based impedance measurement system and traditional benchtop impedance analyzers for biomedical research and drug development applications. We explore foundational principles, from basic impedance theory to device architectures, and detail practical methodologies for biosensing, cell monitoring, and electrochemical analysis. The guide addresses critical troubleshooting for accuracy, calibration, and noise reduction, and presents a rigorous validation framework comparing cost, precision, frequency range, and usability. Designed for researchers and scientists, this analysis clarifies when to choose a low-cost, customizable AD5933 solution versus a high-performance benchtop instrument for specific lab workflows.
Impedance Analysis 101: Core Principles, Architectures, and Key Specifications Decoded
This whitepaper elucidates the core principles of electrical impedance—resistance, capacitance, and phase—within biological contexts. It provides the theoretical foundation for evaluating the AD5933 impedance converter network against benchtop analyzers for laboratory research in biosensing, cell biology, and drug development. Accurate impedance measurements are critical for characterizing cellular morphology, adhesion, and metabolic activity in real-time, label-free assays.
Core Principles of Impedance in Biological Systems
Electrical impedance (Z) is a complex, frequency-dependent measure of opposition to current flow in a circuit or material. In biological systems, it quantifies the passive electrical properties of tissues, cell suspensions, or monolayers.
The Impedance Triangle: Resistance, Reactance, and Phase
The total impedance (Z) is a vector sum of resistance (R) and reactance (X). Resistance represents the dissipative, in-phase component, converting electrical energy to heat. Reactance (X) is the out-of-phase, energy-storing component, originating from capacitance (C) and inductance (L). In biological tissues, inductive effects are typically negligible at low frequencies (<10 MHz); thus, reactance is dominated by capacitive elements.
- Magnitude: |Z| = √(R² + Xc²)
- Phase Angle: θ = arctan(-Xc / R)
- Capacitive Reactance: Xc = -1 / (2πfC), where f is frequency.
Biological cells in suspension or adhered to electrodes can be modeled by equivalent circuits. The most common is the Randles circuit, which includes solution resistance (Rs), cell membrane capacitance (Cm), and intracellular or paracellular resistance (Rp).
Biological Origins of Impedance Components
- Resistance (R): In a typical cell-based assay using microelectrodes, the measured resistance primarily reflects ionic flow through paracellular pathways (tight junctions between adherent cells) or the conducting culture medium. An increase in cell layer confluency or barrier integrity increases the measured resistance.
- Capacitance (C): The cell membrane acts as a dielectric capacitor, separating conductive intracellular and extracellular fluids. Changes in membrane surface area, morphology, or composition alter the measured capacitance.
- Phase (θ): The phase shift between applied voltage and measured current provides critical information about the system's dominant behavior (resistive vs. capacitive) at a given frequency. It is a sensitive indicator of changes in cell state.
AD5933 vs. Benchtop Impedance Analyzers: A Technical Comparison for Lab Research
The selection between an integrated circuit like the AD5933 and a full benchtop impedance analyzer hinges on the specific requirements of the biological experiment.
Table 1: Comparative Analysis of AD5933 and Benchtop Impedance Analyzers
| Feature | AD5933-Based System | Benchtop Impedance Analyzer (e.g., Keysight E4990A, Zurich Instruments MFIA) |
|---|---|---|
| Frequency Range | Typically 1 Hz to 100 kHz (practical limits). | 1 mHz to 1 GHz+ (depending on model). |
| Impedance Range | Limited (e.g., 1 kΩ to 10 MΩ), requires calibration for specific range. | Very wide (e.g., 1 mΩ to 1 TΩ), auto-ranging. |
| Measurement Accuracy | Moderate (~0.5% typical). Highly dependent on calibration, PCB layout, and external components. | High (<0.1% typical). Stable, factory-calibrated. |
| Excitation Voltage | Fixed, typically 1.98 Vpp (programmable in on-chip DDS). | Precisely programmable (mV to V levels). |
| Data Output | Real/Imaginary or Magnitude/Phase data via I²C. | Full complex impedance, with advanced parameter extraction. |
| Key Advantage | Low cost, compact size, customizable for embedded or point-of-care systems. | High precision, accuracy, versatility, and advanced analytical software. |
| Primary Limitation | Limited performance, requires significant design effort for stable measurements. | High cost, bulky, not suitable for portable applications. |
| Ideal Use Case | Prototyping, low-cost multi-well systems, portable or long-term monitoring where ultimate precision is secondary. | Fundamental research, method validation, quality control, and measurements requiring traceable accuracy. |
Thesis Context: For a research lab, the choice is application-specific. Benchtop analyzers are superior for method development and validation, where accurate characterization of a novel bio-impedance signal is paramount. The AD5933 is advantageous for scaling up validated assays into higher-throughput, customized platforms (e.g., a 96-well plate reader built in-house) or for integrating impedance sensing into organ-on-a-chip perfusion systems.
Key Experimental Protocols for Cell-Based Impedance Assays
Protocol: Real-Time Cell Analysis (RTCA) for Monitoring Barrier Integrity
Objective: To monitor the formation and perturbation of an endothelial or epithelial cell monolayer in real-time. Materials: See "The Scientist's Toolkit" below. Methodology:
- Electrode Preparation: Sterilize the gold-film or screen-printed electrode surface (e.g., in a specialized 96-well plate) via UV irradiation for 30 minutes.
- Baseline Measurement: Add culture medium alone (100 µL/well for a 96-well format) to wells. Acquire impedance spectra (e.g., at 10 kHz single frequency or a sweep from 1 kHz to 100 kHz) using the chosen analyzer. This establishes the background (Rb).
- Cell Seeding: Seed cells at an optimized density (e.g., 50,000 cells/well for HUVECs) in complete growth medium.
- Continuous Monitoring: Place the plate in the incubator-connected station. Acquire impedance measurements at set intervals (e.g., every 15 minutes). The Cell Index (CI = (Zi - Rb) / Rb) is often calculated at a frequency sensitive to cell adhesion.
- Experimental Intervention: Once the CI plateaus (confluent monolayer, typically 24-48 hours), add the pharmacological agent (e.g., histamine for barrier disruption, a drug candidate for enhancement).
- Data Analysis: Normalize CI to the time point of intervention. A decrease in CI indicates increased paracellular flux (lower resistance) and barrier disruption.
Protocol: Single-Frequency vs. Multi-Frequency Analysis for Cell Health
Objective: To distinguish between cytotoxic (cell death) and cytostatic (cell cycle arrest) effects of a compound. Methodology:
- Baseline & Seeding: Follow steps 1-3 from Protocol 3.1.
- Control Measurement: After cells adhere (~4-8 hours), perform a full impedance spectrum sweep (e.g., 100 Hz to 100 kHz) on control wells. This "fingerprint" shows the frequency-dependent behavior of healthy cells.
- Compound Addition: Add test compounds across a range of concentrations.
- Time-Course Monitoring: Monitor at a single, low frequency (e.g., 100-400 Hz, sensitive to cell-electrode adhesion and barrier function) for rapid assessment.
- Endpoint Spectrum Analysis: At 24h and 48h, perform full spectral sweeps on all wells.
- Data Interpretation: A cytotoxic effect causes cells to detach, drastically reducing impedance at all frequencies. A cytostatic effect may show a reduced increase in low-frequency impedance (due to inhibited proliferation) but may preserve high-frequency impedance (related to membrane integrity/capacitance). The phase angle at high frequencies is particularly sensitive to membrane integrity.
Visualizing Impedance Concepts and Workflows
Electrical Impedance Vector Diagram
Cell Barrier Integrity Assay Workflow
The Scientist's Toolkit: Key Research Reagent Solutions
Table 2: Essential Materials for Bio-Impedance Experiments
| Item | Function & Application |
|---|---|
| Specialized Impedance Plates (e.g., ACEA xCelligence plates, Applied BioPhysics ECIS arrays) | Multi-well plates with integrated microelectrodes. Gold-film electrodes provide a stable, biocompatible surface for cell adhesion and long-term measurement. |
| Reference Electrodes (Ag/AgCl) | Provide a stable, known potential in the electrochemical cell, critical for accurate measurements in benchtop setups, less common in integrated 2-electrode plate systems. |
| Electrolyte Solution / Cell Culture Medium (e.g., PBS, DMEM with serum) | Conducting ionic solution necessary for current flow. Serum concentration can affect initial cell adhesion and must be kept consistent. |
| Cell Lines (e.g., HUVEC, MDCK-II, Caco-2) | Model barrier-forming or tissue-specific cells. Caco-2 cells spontaneously differentiate to form tight junctions, modeling the intestinal barrier. |
| Positive Control Reagents (e.g., Histamine, TNF-α, EGTA) | Pharmacological agents known to disrupt cell-cell junctions, validating assay sensitivity. |
| Impedance Analyzer Calibration Kits | Precision resistors and capacitors for calibrating benchtop analyzers, ensuring traceable measurement accuracy. |
| AD5933 Evaluation Board & Calibration Resistors | For prototyping systems based on the AD5933, requiring precise calibration at the specific measurement frequency and impedance range of interest. |
This whitepaper provides an in-depth technical analysis of benchtop and Integrated Circuit (IC)-based impedance analyzer architectures. The analysis is framed within a critical research thesis: evaluating the suitability of the AD5933 IC system versus traditional benchtop impedance analyzers for laboratory use in scientific research and drug development. The choice fundamentally impacts measurement accuracy, system flexibility, operational complexity, and cost, directly influencing experimental outcomes and research scalability.
Core Architectural Breakdown
Benchtop Impedance Analyzer Architecture
Benchtop analyzers (e.g., Keysight E4990A, Zurich Instruments MFIA) are self-contained, high-performance instruments. Their architecture is built around discrete, optimized subsystems:
- Signal Generation: A direct digital synthesizer (DDS) or high-stability oscillator generates a precise, programmable sine wave.
- Current-to-Voltage Conversion: A high-speed, low-noise transimpedance amplifier (TIA) converts the current from the Device Under Test (DUT) into a measurable voltage.
- Demodulation & Digitization: Sophisticated analog or digital demodulation (often using a phase-sensitive detector) extracts the in-phase (I) and quadrature (Q) components of the response signal, which are then digitized by high-resolution Analog-to-Digital Converters (ADCs).
- Processing & Control: A dedicated microprocessor or FPGA performs complex calculations (e.g., Fast Fourier Transform) to derive impedance magnitude and phase.
IC-Based System Architecture (Exemplified by AD5933)
The AD5933 is a System-on-Chip (SoC) that integrates key functions into a single package, requiring external components to form a complete system:
- On-Chip DDS: Generates an excitation frequency programmable from 1 Hz to 100 kHz.
- On-Chip ADC: A 12-bit, 1 MSPS ADC digitizes the response.
- Digital Signal Processing: An on-board DSP engine performs a Discrete Fourier Transform (DFT) on the sampled data for a single selected frequency point per measurement cycle.
- Critical External Components: Requires an external precision amplifier for current-to-voltage conversion and external calibration resistors to set the measurement range.
Quantitative Comparison Table
Table 1: Architectural & Performance Specification Comparison
| Parameter | Benchtop Analyzer (e.g., Keysight E4990A) | IC-Based System (e.g., AD5933) |
|---|---|---|
| Frequency Range | Typically 1 Hz to 120+ MHz | 1 Hz to 100 kHz |
| Impedance Range | Wide (e.g., 1 mΩ to 1 TΩ) | Limited (typically 1 kΩ to 10 MΩ), set by ext. components |
| Basic Accuracy | High (typically ~0.05% to 0.5%) | Moderate (system-dependent, ~1% to 5% typical) |
| Phase Accuracy | High (e.g., < 0.05°) | Lower (system-dependent, ~1° typical) |
| Measurement Speed | Very Fast (ms per full sweep) | Slow (ms to 100s of ms per frequency point) |
| Excitation Control | Excellent (programmable amplitude, automatic ranging) | Limited (fixed output amplitude, manual range setting) |
| System Integration | Standalone, turnkey. | Requires embedded design (PCB, microcontroller, firmware). |
| Form Factor | Large, fixed. | Highly flexible, can be miniaturized. |
| Typical Cost (Hardware) | $15,000 - $50,000+ | < $100 (IC + components) |
Table 2: Suitability for Laboratory Research Contexts
| Research Context | Recommended Architecture | Key Rationale |
|---|---|---|
| Method Development & Validation | Benchtop | Ultimate accuracy and validation capability. |
| High-Frequency Material Studies | Benchtop | Required frequency range. |
| Long-term, Stable Measurements | Benchtop | Superior temperature stability and drift performance. |
| Multi-sample, High-Throughput Screening | Context-Dependent | Benchtop for speed/accuracy; IC array for distributed, low-cost sensing. |
| In-situ, Portable, or Embedded Monitoring | IC-Based (AD5933) | Size, cost, and integration flexibility are paramount. |
| Educational & Prototyping Labs | IC-Based (AD5933) | Low cost, exposes fundamental principles. |
Experimental Protocols for Comparison
Protocol A: System Performance Benchmarking
Objective: Quantify accuracy, noise, and frequency response of an AD5933 system against a calibrated benchtop analyzer. Materials: Benchtop analyzer, AD5933 evaluation board, calibration resistors (100Ω, 1kΩ, 10kΩ, 100kΩ), precision capacitors (100pF, 10nF), breadboard, connecting cables. Methodology:
- Calibration: Perform full 2-point (open/short) or 3-point (open/short/load) calibration on the benchtop analyzer. For the AD5933, perform a gain factor calibration using a known resistor at the target frequency.
- Resistive Sweep: Measure each calibration resistor from 100 Hz to the maximum frequency of the AD5933 (100 kHz) at a fixed voltage (e.g., 200 mV). Record magnitude and phase for both systems.
- RC Network Characterization: Measure a series RC circuit (e.g., 10kΩ resistor, 10nF capacitor) across the same frequency range.
- Noise Floor Analysis: With inputs open and shorted, record the measured impedance magnitude over time at a fixed mid-range frequency (e.g., 10 kHz) to determine short-term stability and noise.
- Data Analysis: Calculate % deviation of AD5933 readings from benchtop reference. Plot Bode plots (magnitude/phase vs. frequency) for both systems.
Protocol B: Biological Application - Cell Monolayer Integrity (TEER)
Objective: Monitor Transepithelial Electrical Resistance (TEER) of a cell culture monolayer over time. Materials: Cell culture insert, electrodes, cell culture media, incubator, benchtop analyzer, AD5933-based custom system with electrode interface. Methodology:
- Setup: Seed cells on permeable insert membrane. Place electrodes in apical and basolateral chambers.
- Benchtop Measurement: At each time point, remove insert, place in measurement station, and measure impedance at a single low frequency (e.g., 10-100 Hz) using the benchtop analyzer. Return to incubator.
- IC-Based In-situ Measurement: Use a miniaturized, sterilizable AD5933 system integrated into the incubator or culture plate lid. Program it to measure at the same frequency automatically at set intervals.
- Comparison: Compare the TEER trend curves from both systems, noting any discrepancies caused by moving the culture for benchtop measurement versus in-situ stability.
Visualization Diagrams
The Scientist's Toolkit: Key Research Reagent Solutions & Materials
Table 3: Essential Materials for Impedance-Based Experiments
| Item | Function in Experiment |
|---|---|
| Precision Calibration Resistors (e.g., 0.1% tolerance) | Provides known reference impedance for system calibration and validation of measurement accuracy. |
| Low-ESR Capacitors & Inductors | Used to construct known RC/LC networks for testing analyzer frequency response and phase accuracy. |
| Electrode Systems (e.g., Ag/AgCl, gold, IDEs) | Transduce ionic current in biological/chemical samples into measurable electronic current. Choice depends on application and frequency. |
| Electrolyte Solutions (e.g., PBS, KCl) | Standardized ionic media for electrochemical cell measurements, ensuring consistent and reproducible conditions. |
| Cell Culture Inserts (e.g., Transwell) | Permeable supports for growing cell monolayers used in TEER measurements for barrier function studies. |
| Faraday Cage / Shielded Enclosure | Minimizes external electromagnetic interference (EMI), crucial for low-current and high-impedance measurements. |
| Low-Noise, Shielded Cables & Connectors | Preserves signal integrity by reducing capacitive pickup and cable-induced artifacts, especially at higher frequencies. |
| Temperature Control Chamber | Maintains constant sample temperature, as impedance of materials and biological samples is highly temperature-sensitive. |
This technical guide provides an in-depth analysis of the AD5933, a precision impedance converter system-on-chip, within the research context of evaluating its suitability as an alternative to benchtop impedance analyzers in laboratory settings, particularly for drug development and biomedical research. The assessment focuses on core operational principles, key capabilities, and practical implementation against the benchmark of traditional benchtop instruments.
The primary thesis framing this analysis is: "Determining the viability of the AD5933 integrated circuit as a cost-effective, space-efficient, and sufficiently accurate alternative to traditional benchtop impedance analyzers for specific, well-defined laboratory applications in research and drug development." This evaluation is critical for labs seeking to decentralize testing, create portable assays, or reduce capital equipment costs without sacrificing essential data integrity for lower-frequency impedance measurements.
How the AD5933 Works: System Architecture
The AD5933 is a complex mixed-signal device that performs a discrete frequency sweep to measure impedance. Its operation can be broken down into a core signal chain and digital control pathway.
Core Signal Chain and Digital Control
Diagram Title: AD5933 Impedance Measurement Signal Flow
Process Workflow:
- Frequency Generation: A Direct Digital Synthesizer (DDS) core generates a precise digital sine wave representation based on user-programmed start frequency, increment, and number of points.
- Excitation: The digital waveform is converted to an analog voltage (VOUT) by the on-board 12-bit DAC. This signal excites the unknown impedance (Z) connected in series with a known current-sensing feedback resistor (R_FB).
- Signal Conditioning: The resulting current through the network creates a voltage across R_FB, which is amplified by the Programmable Gain Amplifier (PGA).
- Digitization and Analysis: The conditioned signal is digitized by a 12-bit ADC. The digital samples are processed by an on-chip Discrete Fourier Transform (DFT) engine at the excitation frequency.
- Output: The DFT outputs the in-phase (Real) and quadrature (Imaginary) components of the response. An external microcontroller computes the complex impedance using calibration data.
Critical Calibration Workflow
Accurate measurement requires a two-point calibration against a known calibration resistor.
Diagram Title: AD5933 Two-Point Calibration Protocol
Core Capabilities: Quantitative Specifications vs. Benchtop Analyzers
Table 1: AD5933 vs. Typical Benchtop Impedance Analyzer Specifications
| Parameter | AD5933 (On-a-Chip) | Typical Benchtop Analyzer (e.g., Keysight E4990A) | Implication for Research |
|---|---|---|---|
| Frequency Range | 1 Hz to 100 kHz | 1 Hz to 3 GHz (Wideband) | AD5933 suitable for electrochemical, biosensor, material characterization at low frequencies. Benchtop required for RF components or high-speed kinetics. |
| Impedance Range | 1 kΩ to 10 MΩ (optimal with R_FB selection) | 1 mΩ to 1 TΩ (with multiple ranges) | Benchtop offers vastly broader range. AD5933 requires careful matching of R_FB to expected Z, limiting dynamic range in a single setup. |
| Measurement Accuracy | ±0.5% typical (after calibration, at optimal Z) | ±0.05% to ±0.1% typical | Benchtop provides higher precision critical for detecting subtle changes (e.g., small molecule binding). AD5933 adequate for larger-scale effects. |
| Output Excitation | 1.98 Vp-p max, fixed waveform (sine) | Variable amplitude (mV to V), arbitrary waveforms | Benchtop allows optimization for sensitive samples (low voltage) or nonlinear materials. AD5933 is less flexible. |
| Data Throughput | ~30 ms per frequency point (typical) | < 1 ms per point (high speed) | Benchtop superior for high-resolution sweeps or time-series monitoring of fast processes. |
| Form Factor & Cost | ~$30 (IC), PCB-based system | $20,000 - $100,000+ | AD5933 enables multiplexed, portable, or embedded systems at a fraction of the cost. |
| Interface & Control | I²C Digital Interface | GPIB, LAN, USB, extensive front-panel | AD5933 is software-driven, ideal for integration into automated, custom lab setups. Benchtop offers standalone usability. |
Table 2: AD5933 System-Level Performance Summary
| Characteristic | Specification / Value | Notes for Experimental Design |
|---|---|---|
| Frequency Resolution | 27-bit DDS (0.1 Hz at 100 kHz clock) | Allows fine-grained sweeps for detailed dispersion analysis. |
| Clock Source | Onboard 16.776 MHz oscillator or external | External clock recommended for precise frequency generation and system synchronization. |
| Power Supply | 2.7 V to 5.5 V, ~20 mA active | Enables battery-powered and portable measurement systems. |
| Temperature Range | -40°C to +85°C (industrial) | Suitable for environmental chambers or non-climate-controlled lab spaces. |
| Key Limitation | Single-ended, grounded measurement | Not suitable for floating or fully differential measurements without external circuitry. |
Experimental Protocols for Key Applications
Protocol: Characterizing a Biosensor in a Microfluidic Well
Objective: Monitor the change in electrochemical impedance of a functionalized electrode surface upon protein binding in real-time at a single frequency.
The Scientist's Toolkit:
| Research Reagent / Material | Function in Experiment |
|---|---|
| AD5933 Evaluation Board | Provides the core measurement hardware with accessible terminals. |
| Custom PDMS Microfluidic Cell | Houses the biosensor electrode and controls fluidic delivery of samples. |
| Gold Working Electrode | Functionalized surface for biomolecule immobilization. |
| Phosphate Buffered Saline (PBS) | Provides a consistent ionic strength and pH for biochemical reactions. |
| Target Protein Solution | The analyte of interest which binds to the sensor surface. |
| Blocking Agent (e.g., BSA) | Used to passivate non-specific binding sites on the sensor. |
| Precision Feedback Resistor (R_FB) | Selected (e.g., 10 kΩ) to match the expected sensor impedance (10-100 kΩ). |
| Calibration Resistor Set | Precision resistors (e.g., 10kΩ, 100kΩ) for initial system calibration. |
| Microcontroller (e.g., Arduino, PSoC) | Programs the AD5933 and streams data to a PC for analysis. |
Methodology:
- System Setup: Connect the biosensor working electrode to VOUT and the counter electrode to the R_FB/input node. Place the cell in PBS.
- Calibration: Replace the sensor with a precision 10 kΩ resistor. Perform a sweep from 100 Hz to 10 kHz to determine the system's Gain Factor (GF) at the target monitoring frequency (e.g., 1 kHz).
- Baseline Measurement: Reconnect the sensor. Flow PBS to stabilize. Measure and record the impedance magnitude and phase at 1 kHz every 5 seconds for 5 minutes to establish a stable baseline (Z_baseline).
- Introduce Analyte: Switch flow to the target protein solution. Continue monitoring impedance at the same interval for 15-30 minutes.
- Data Analysis: Calculate the normalized impedance change ΔZ/Z = (Z(t) - Zbaseline) / Zbaseline. Plot ΔZ/Z vs. time to obtain a binding kinetic curve.
Protocol: Multi-Frequency Sweep of Battery Electrode Material
Objective: Obtain a Nyquist plot of a lithium-ion coin cell half-cell to estimate charge-transfer resistance and Warburg diffusion element.
Methodology:
- Cell Connection: Connect the AD5933 system to a coin cell test fixture. A potentiostat circuit may be required to bias the cell at its open-circuit voltage.
- Sweep Configuration: Program a logarithmic frequency sweep from 10 kHz down to 1 Hz with 10 points per decade.
- Calibration: Perform calibration with a resistor close to the expected cell impedance (e.g., 100 Ω) at multiple spot frequencies across the band.
- Measurement: Execute the sweep, collecting real (R) and imaginary (I) data at each frequency.
- Model Fitting: Plot -Imaginary vs. Real (Nyquist plot). Fit the curve to an equivalent circuit model (e.g., Randles circuit) using software like ZView to extract parameters like solution resistance (Rs), charge-transfer resistance (Rct), and double-layer capacitance (C_dl).
Within the defined thesis, the AD5933 presents a compelling alternative to benchtop analyzers for low-frequency (≤100 kHz), moderate-accuracy, and cost- or space-sensitive applications. Its core capability lies in transforming complex analog measurement into a digital system integration problem. For drug development, this enables high-throughput, multiplexed impedance-based assays (e.g., for cell monitoring or immunosensing) at a dramatically lower per-station cost. However, for research requiring the highest accuracy, ultra-wide impedance or frequency ranges, or advanced analysis features (like built-in equivalent circuit fitting), a traditional benchtop impedance analyzer remains indispensable. The choice is not one of outright replacement but of strategic tool selection based on specific research requirements and constraints.
In the context of academic and industrial lab research, selecting the appropriate impedance measurement tool involves a critical evaluation of performance specifications against practical needs. This whitepaper, framed within a broader thesis comparing the integrated circuit AD5933 to traditional benchtop impedance analyzers, provides a detailed technical guide for researchers and development professionals in fields like biosensing and drug development.
Core Specification Analysis
The choice between a compact solution like the AD5933 and a full benchtop analyzer hinges on four interdependent key specifications.
1. Frequency Range This defines the spectrum of alternating current (AC) test frequencies an instrument can generate and measure. It determines the type of information that can be extracted, as biological systems and materials exhibit frequency-dependent impedance.
- AD5933: Operates within a limited range, typically 1 Hz to 100 kHz (dependent on external clock and system design). This covers the β-dispersion region relevant for many cell-based assays, where cellular membrane properties and intracellular conductivity are probed.
- Benchtop Analyzers (e.g., Keysight, Zurich Instruments): Offer vastly broader ranges, from µHz to GHz. This enables the study of very slow electrochemical processes (µHz) and very fast dielectric relaxations or material properties (MHz-GHz).
2. Accuracy Accuracy quantifies how close a measurement result is to the true impedance value. It is affected by systematic errors, calibration quality, and inherent circuit limitations.
- AD5933: Moderate accuracy, typically around 5-10% of reading for a well-calibrated system. Accuracy is highly dependent on a stable, known calibration resistor close to the unknown impedance value and is best within a limited impedance magnitude range (e.g., 1 kΩ to 1 MΩ).
- Benchtop Analyzers: High accuracy, often 0.1% or better of reading. They incorporate advanced auto-calibration routines, error compensation models (open/short/load), and sophisticated electronics to minimize systematic errors across a wide impedance and frequency span.
3. Resolution Resolution is the smallest change in impedance magnitude or phase that the instrument can detect and display. It is crucial for monitoring subtle, real-time changes in biological samples.
- AD5933: Resolution is fundamentally limited by its 12-bit analog-to-digital converter (ADC) for the response signal and the stability of its on-board oscillator. Phase resolution is particularly limited.
- Benchtop Analyzers: Feature high-resolution (e.g., 24-bit) ADCs and precision signal sources, enabling detection of minute changes in both magnitude and phase angle.
4. Measurement Speed Speed refers to how quickly a single impedance measurement or a frequency sweep can be completed. This is critical for high-throughput screening or kinetic studies.
- AD5933: Offers relatively fast single-frequency point measurements (milliseconds). However, sweeping across many frequencies involves software-controlled steps and settling time delays, slowing full sweeps.
- Benchtop Analyzers: Extremely fast, leveraging dedicated hardware processors for real-time analysis. Can perform high-speed sweeps or continuous monitoring at thousands of points per second.
Quantitative Data Comparison
The table below summarizes typical specification ranges for the AD5933 system and a representative mid-range benchtop impedance analyzer.
| Specification | AD5933-Based System | Representative Benchtop Analyzer (e.g., Keysight E4990A) |
|---|---|---|
| Frequency Range | 1 Hz – 100 kHz | 10 µHz – 120 MHz |
| Basic Accuracy | ~5% (Magnitude, system-dependent) | 0.08% (Magnitude) |
| Impedance Range | ~100 Ω to 10 MΩ (optimal) | 1 mΩ to 1 TΩ |
| Measurement Resolution | 12-bit ADC (limited phase resolution) | 24-bit ADC, 0.01° phase resolution |
| Sweep Speed | Moderate (software-controlled settling) | Very Fast (<1 ms per point in fast mode) |
| Key Advantage | Low cost, portability, integration | High accuracy, speed, broad frequency range |
Experimental Protocols for Validation
To quantitatively compare these platforms in a lab research context, the following experimental methodologies can be employed.
Protocol 1: Stability and Accuracy Assessment Using Calibrated Passive Components
- Objective: Determine baseline accuracy and drift over time.
- Materials: Precision resistors (e.g., 1kΩ, 10kΩ, 100kΩ ±0.1%), calibrated reference capacitors.
- Method:
- Connect a 10kΩ precision resistor to the measurement terminals.
- For the AD5933, perform a system calibration at 1 kHz using a calibration resistor matching the unknown's expected value.
- For the benchtop analyzer, perform a full open/short/load calibration at the measurement plane.
- Measure the impedance magnitude and phase at 1 kHz every 60 seconds for 60 minutes under controlled temperature.
- Repeat for multiple frequencies (100 Hz, 10 kHz) and different component values.
- Data Analysis: Calculate mean measured value, standard deviation, and % error from the known nominal value. Plot drift over time.
Protocol 2: Characterizing a Biological Model System (e.g., Electrolyte Solution)
- Objective: Evaluate performance in a realistic, low-impedance research scenario.
- Materials: Potassium chloride (KCl) solutions (e.g., 0.1M, 0.01M), two-electrode or four-electrode electrochemical cell.
- Method:
- Prepare KCl solutions with known conductivity.
- Fill the electrochemical cell and connect to the analyzer.
- For the benchtop unit, use a dedicated conductivity fixture or a four-terminal pair connection for optimal accuracy.
- For the AD5933, implement a suitable front-end circuit for electrode interfacing.
- Perform a frequency sweep from 100 Hz to 100 kHz.
- Record the impedance spectrum.
- Data Analysis: Fit the obtained spectrum to an equivalent circuit model (e.g., a solution resistance in series with a constant phase element for the electrode interface). Compare the extracted solution resistance (and thus calculated conductivity) to the expected value.
Protocol 3: Kinetic Monitoring of a Dynamic Process
- Objective: Assess measurement speed and resolution for time-sensitive applications.
- Materials: A slowly hydrating polymer film or a model redox couple solution (e.g., Ferri/Ferrocyanide).
- Method:
- Initialize the measurement at a single, optimal frequency (e.g., the frequency of maximum phase change for the system).
- Trigger the dynamic process (e.g., add solvent, apply a voltage step).
- Record impedance magnitude and phase in continuous time-lapse mode.
- Configure the benchtop analyzer for its highest measurement speed setting.
- Configure the AD5933 for continuous polling of its output registers.
- Data Analysis: Plot impedance parameters vs. time. Compare the temporal resolution (data points per second) and the signal-to-noise ratio of the captured transient.
Visualizing the Decision Workflow
Decision Flow: Selecting an Impedance Measurement Tool
AD5933 System Architecture & Data Flow
The Scientist's Toolkit: Key Research Reagent Solutions
The table below lists essential materials for impedance-based research, particularly in bio-applications.
| Item | Function in Impedance Research |
|---|---|
| Phosphate-Buffered Saline (PBS) | Standard electrolyte solution for maintaining physiological ionic strength and pH in cell-based assays. Provides a stable baseline impedance. |
| Tetrapolar Electrochemical Cell | A cell with four electrodes: two for current injection, two for voltage sensing. Mitigates electrode polarization effects for accurate solution conductivity measurement. |
| Interdigitated Electrode (IDE) Array | Microfabricated sensor with interlaced fingers. Provides high sensitivity for surface binding events and localized electric fields for cell monitoring. |
| Calibrated Precision Resistors | High-accuracy (±0.1% or better) resistors used as known references for system calibration and validation of instrument accuracy. |
| Faraday Cage | A shielded enclosure that blocks external electromagnetic fields, reducing environmental noise for low-current, high-impedance measurements. |
| Equivalent Circuit Modeling Software | Software (e.g., ZView, EC-Lab) used to fit experimental impedance spectra to theoretical circuit models, extracting physiochemical parameters. |
This technical guide explores the core applications of impedance analysis in biomedical laboratories, framed within the context of evaluating the viability of the integrated circuit-based AD5933 impedance analyzer versus traditional benchtop impedance analyzers for research purposes.
Impedance analysis is a cornerstone technique in biomedical research, enabling non-invasive, label-free, and real-time monitoring of biophysical properties. The choice between a low-cost, portable system like the AD5933 and a high-performance benchtop analyzer hinges on the specific requirements of precision, frequency range, and analytical complexity for each primary use case.
Impedance Analyzers: AD5933 vs. Benchtop Systems
A comparative analysis is essential for researchers selecting an appropriate tool.
Table 1: Specifications Comparison: AD5933 vs. Typical Benchtop Analyzer
| Parameter | AD5933-Based System | Benchtop Impedance Analyzer (e.g., Keysight E4990A) |
|---|---|---|
| Frequency Range | 1 Hz to 100 kHz | 1 mHz to 3 / 30 / 120 MHz (model dependent) |
| Impedance Range | ~1 kΩ to 10 MΩ (circuit dependent) | Wide range, e.g., 1 mΩ to 1 TΩ |
| Measurement Accuracy | Moderate (0.5% typical, heavily circuit/calib. dependent) | High (0.05% to 0.1% typical) |
| Cost | Low (Component cost < $50) | High ($20,000 - $100,000+) |
| Portability | Excellent (can be embedded) | Poor (rack-mounted or large desktop unit) |
| Ease of Use & Software | Requires custom firmware/UI development | Comprehensive, vendor-supported software |
| Primary Advantage | Cost, portability, customization for a single task | Accuracy, reliability, broad frequency & impedance range |
| Ideal Use Context | Dedicated, narrow-range monitoring systems | R&D, characterization, multi-application labs |
Core Laboratory Use Cases & Experimental Protocols
Electrode Characterization and Functionalization
Objective: To quantify the interfacial properties of biosensor electrodes (e.g., gold, ITO, carbon) before and after surface modification (e.g., with self-assembled monolayers or capture antibodies).
Protocol:
- Setup: Place the bare electrode in a controlled electrolyte (e.g., 1x PBS or 5 mM K₃[Fe(CN)₆]/K₄[Fe(CN)₆]).
- Measurement: Perform an electrochemical impedance spectroscopy (EIS) sweep (e.g., 0.1 Hz to 100 kHz) at the open circuit potential with a small AC perturbation (10 mV).
- Functionalization: Chemically modify the electrode surface (e.g., incubate in 1 mM thiol solution for 2 hours).
- Post-Modification Measurement: Repeat the EIS sweep in the same electrolyte.
- Analysis: Fit Nyquist plots to an equivalent circuit model (e.g., Randles circuit with a constant phase element) to extract parameters like charge transfer resistance (Rct) and double-layer capacitance (Cdl), which indicate modification success.
Table 2: Electrode Characterization Results Example
| Electrode State | Rct (kΩ) | Cdl (nF) | Notes |
|---|---|---|---|
| Bare Gold | 1.2 ± 0.2 | 120 ± 15 | Low barrier to redox probe electron transfer. |
| SAM-Modified | 45.3 ± 5.1 | 18 ± 3 | High Rct confirms successful insulating monolayer formation. |
| Antibody-Coated | 68.7 ± 7.5 | 15 ± 2 | Further increase confirms protein binding. |
Toolkit Applicability: Benchtop analyzers provide superior resolution for detailed interfacial studies. The AD5933 can be used for basic quality control of electrode batches within its frequency limits.
Cell Culture Monitoring (e.g., Electric Cell-Substrate Impedance Sensing - ECIS)
Objective: To monitor in real-time cell proliferation, morphology changes, and barrier function (in endothelial or epithelial layers) non-invasively.
Protocol:
- Seeding: Seed cells onto a specialized cultureware containing integrated microelectrodes.
- Baseline: Measure impedance (often at multiple frequencies, e.g., 400 Hz, 2 kHz, 10 kHz) immediately after seeding in media.
- Continuous Monitoring: Place the cultureware in a standard incubator connected to an impedance monitoring system. Take readings every 1-15 minutes.
- Perturbation (Optional): Introduce a compound (drug, toxin) and monitor the impedance response over time.
- Analysis: Track impedance magnitude or the derived parameter "normalized cell index." Low frequencies are sensitive to cell number and barrier function, while higher frequencies are more sensitive to cell morphology.
Toolkit Applicability: AD5933-based systems are ideal for creating custom, multi-well, real-time monitoring setups at a fraction of the cost of commercial ECIS instruments, though with less precision. Benchtop analyzers are used for foundational research and developing new assay models.
Diagram 1: ECIS Impedance Response to Cell Coverage
Biomolecular Sensing and Diagnostic Assays
Objective: To detect the presence and concentration of a target analyte (DNA, protein, pathogen) via impedance change upon binding on a functionalized electrode.
Protocol (Sandwich Immunoassay Example):
- Capture: Immobilize capture antibodies on the electrode surface.
- Blocking: Apply a blocking agent (e.g., BSA) to prevent non-specific binding.
- Baseline Measurement: Record impedance in buffer.
- Incubation: Introduce the sample containing the target antigen. Incubate, then wash.
- Secondary Binding: Introduce a labeled detection antibody. Incubate, then wash.
- Signal Generation (if labeled): If using an enzyme label (e.g., HRP), add a substrate that generates an insoluble precipitate on the electrode, dramatically increasing Rct.
- Final Measurement: Record impedance. The change in Rct (ΔRct) correlates with analyte concentration.
Toolkit Applicability: The AD5933 excels in developing low-cost, point-of-care diagnostic prototypes. Benchtop analyzers are critical for assay development, optimization, and characterizing binding kinetics with high resolution.
The Scientist's Toolkit: Key Research Reagent Solutions
Table 3: Essential Materials for Impedance-Based Bioassays
| Item | Function / Role in Experiment |
|---|---|
| Interdigitated Electrode (IDE) Chips | Standardized microelectrodes for consistent electric field generation, used in ECIS and biosensing. |
| Redox Probe (e.g., [Fe(CN)₆]³⁻/⁴⁻) | Provides a measurable electron transfer pathway; changes in its efficiency indicate surface modifications or blocking events. |
| Thiolated Molecules (e.g., 11-MUA) | Form self-assembled monolayers (SAMs) on gold electrodes, providing a stable, functionalizable surface for biomolecule attachment. |
| NHS/EDC Crosslinker Kit | Activates carboxyl groups on SAMs or surfaces for covalent coupling of proteins (antibodies, peptides). |
| Blocking Agents (BSA, Casein) | Minimize non-specific adsorption of proteins to the sensor surface, improving assay specificity and signal-to-noise ratio. |
| Specific Antibody Pairs (Capture/Detection) | Form the core of immunoassays, providing high specificity for the target antigen. |
| Cell Culture Media & Supplements | Maintain cell viability and normal physiology during long-term impedance monitoring experiments. |
| Trypsin-EDTA Solution | Detaches adherent cells from surfaces, used for standardizing cell seeding densities in ECIS experiments. |
The selection between an AD5933-based system and a benchtop impedance analyzer is not a matter of superiority, but of appropriate application. For high-precision characterization, method development, and work requiring wide frequency ranges, benchtop analyzers remain indispensable. For developing dedicated, cost-effective, and portable monitoring systems for specific tasks like cell culture health or point-of-care diagnostics, the AD5933 offers a powerful, flexible alternative that can democratize access to impedance-based techniques in biomedical labs.
Hands-On Protocols: Implementing AD5933 and Benchtop Analyzers for Biosensing & Cell Studies
This guide provides an in-depth technical framework for electrode setup, a critical and often overlooked variable in comparative impedance analysis studies. The methodologies herein are framed within a broader research thesis evaluating the performance of the integrated circuit-based AD5933 impedance converter against traditional benchtop impedance analyzers (e.g., Keysight, Zurich Instruments) for laboratory use in bio-impedance applications, such as monitoring cell culture or biomolecular interactions in drug development. Consistent, well-designed measurement setup is paramount for generating valid comparative data between these two classes of instruments.
Core Principles of Electrode Design for Bio-Impedance
The electrode is the transducer between the electrical measurement system and the ionic conductive sample. Its design dictates the current distribution, sensitivity, and signal-to-noise ratio.
Two-Electrode vs. Three/Four-Electrode Configurations:
- Two-Electrode: Each electrode serves as both current-injecting and voltage-sensing. Simple but susceptible to errors from electrode polarization impedance, especially at low frequencies. More suitable for the AD5933 in basic configurations.
- Three/Four-Electrode: Separate current-injecting and voltage-sensing electrodes. The sensing electrodes measure the voltage drop in the sample with minimal current flow, effectively negating the polarization impedance at the sensing interface. Essential for accurate, low-frequency measurements and the preferred method for benchtop analyzers.
Material Selection: Choice affects conductivity, polarizability, and biocompatibility.
- Geometry and Surface Area: Determines current density and the interface impedance. Consistent geometry is critical for reproducibility.
Quantitative Comparison: AD5933 vs. Benchtop Analyzer Requirements
The system choice imposes different constraints and optimizations on the setup design.
Table 1: Electrode & Fixturing Requirements by System
| Parameter | AD5933-Based System | Benchtop Impedance Analyzer | Rationale & Impact |
|---|---|---|---|
| Optimal Electrode Config | Primarily 2-Electrode. 4-Electrode possible with external circuitry. | Native support for 2, 3, and 4-Electrode configurations. | AD5933's on-chip signal chain is designed for a simple unknown impedance between two nodes. Benchtop units have separate, isolated meters. |
| Excitation Voltage | Typically fixed (e.g., 1.98 Vpp). Limited programmability. | Widely programmable (mV to V range). | AD5933's fixed voltage can drive significant current in low-Z samples, causing nonlinearity or sample damage. Benchtop allows optimization for sensitivity and sample health. |
| Frequency Range | 1 Hz - 100 kHz (typical with accurate clock source). | 1 mHz - 10+ MHz. | Electrode polarization is severe at low frequencies (<100 Hz). A 4-electrode setup is often necessary for AD5933 to access its lower range accurately. |
| Input Impedance | ~10 MΩ on VIN pin. | >1 GΩ (on voltage sensing channels). | Lower input impedance on AD5933 can cause signal loading in high-Z measurements, requiring buffer amplifiers for reliable cell culture monitoring. |
| Fixturing Needs | Critical. Requires custom PCB or shielded fixture for stable connections. | Standardized coaxial cables (e.g., BNC, SMA) to probe stations. | AD5933 is sensitive to stray capacitance; benchtop analyzers use active guarding and sophisticated cable compensation routines. |
Experimental Protocols for Comparative Studies
Protocol 4.1: Characterizing Electrode Polarization Impedance
Objective: Quantify the contribution of the electrode-electrolyte interface to the total measured impedance. Materials: Test electrolyte (e.g., 0.1M PBS), electrode pair, measurement system (AD5933 fixture and benchtop analyzer). Method:
- Fabricate electrode pairs with identical material but different surface areas (e.g., 0.5 cm² and 0.25 cm²).
- Immerse both pairs in the same PBS bath under identical conditions.
- Using a benchtop analyzer in a 2-electrode mode, perform an impedance sweep from 1 Hz to 100 kHz.
- Fit the resulting spectra to an equivalent circuit model (e.g., a series resistor with a constant phase element (CPE) for the interface). The CPE parameters model the polarization.
- Repeat with the AD5933 system. Compare the extracted parameters, noting the frequency range where polarization dominates (>50% of phase shift).
Protocol 4.2: Validating a 4-Electrode Adapter for AD5933
Objective: Implement a 4-electrode measurement using the AD5933 to reduce polarization error. Materials: AD5933 evaluation board, dual current-feedback op-amp (e.g., AD811), precision instrumentation amplifier (e.g., INA128), passive components, four identical electrodes. Method:
- Build Circuit: Construct the circuit as per the diagram below. The current source drives the outer electrodes (C1, C2). The voltage sense amplifier measures the differential potential between the inner electrodes (P1, P2).
- Calibrate: Use precision resistors (100Ω, 1kΩ, 10kΩ) placed at the sample position to calibrate the AD5933 system. The calibration must account for the gain of the external amplifiers.
- Validate: Measure the impedance of a standardized electrolyte (known conductivity) across a range of frequencies. Compare results against a benchtop analyzer in 4-terminal mode.
Diagram 1: 4-Electrode System for AD5933 (60 chars)
The Scientist's Toolkit: Essential Research Reagent Solutions
Table 2: Key Materials for Impedance Biosensor Setup
| Item | Function & Relevance | Example/Specification |
|---|---|---|
| Gold Planar Electrodes | Low chemical reactivity, easily functionalized for biosensing. Standard for cell culture substrates. | 250 nm Au on 10 nm Ti adhesion layer on glass slide. |
| Ag/AgCl Pellets | Reversible, non-polarizable electrode. Essential for stable reference potential in 3/4-electrode setups. | BASi brand, filled with 3M KCl electrolyte gel. |
| Phosphate Buffered Saline (PBS) | Standard physiologically conductive medium for baseline testing and calibration. | 0.01M, pH 7.4, sterile filtered. |
| Cell Culture Media | Conductive growth medium for in vitro experiments. Impedance changes indicate cell adhesion/proliferation. | DMEM with 10% FBS, phenol-red free for optical clarity. |
| ECIS Electrode Arrays | Commercial, standardized 8-well slides with interdigitated electrodes for high-throughput cell monitoring. | Applied BioPhysics, 10W10E+ models. |
| Conductive Silver Epoxy | For making reliable, low-resistance connections between electrode substrates and wires. | Epoxy Technology, H20E. |
| Faraday Cage | Enclosure to shield sensitive, high-impedance measurements (esp. AD5933) from ambient EM noise. | DIY with grounded aluminum mesh or sheet. |
Fixturing and Connection Best Practices
- Shielding and Guarding: Enclose the AD5933 circuit and electrode leads in a grounded metallic enclosure (Faraday cage). Use guard traces on PCBs to reduce parasitic capacitance.
- Cable Management: Use short, rigid connections. For benchtop analyzers, always perform open/short/load compensation at the exact point where the sample connects.
- Sample Chamber: Ensure geometric stability. Use O-rings or gaskets to define a consistent electrode area and sample volume. Temperature control is highly recommended.
- Connection Sequence: Always connect the ground/shield first, then the signal lines, before applying power or excitation to the sample.
Diagram 2: Measurement Setup Decision Workflow (76 chars)
This guide provides a detailed configuration protocol for the Analog Devices AD5933 impedance converter system, framed within a broader research thesis comparing its performance against traditional benchtop impedance analyzers for laboratory use. The thesis hypothesis posits that while benchtop analyzers (e.g., Keysight E4990A, Zurich Instruments MFIA) offer superior accuracy and frequency range, a properly configured AD5933 system provides a cost-effective, customizable, and "good-enough" solution for specific, repetitive lab measurements in fields like drug development and biosensing.
Core System Components & Quantitative Comparison
Table 1: AD5933 System vs. Benchtop Analyzer Key Specifications
| Parameter | AD5933-Based System | Typical Benchtop Analyzer (e.g., Keysight E4990A) | Implication for Lab Use |
|---|---|---|---|
| Frequency Range | 1 Hz to 100 kHz | 1 Hz to 3 GHz | AD5933 suitable for bio-impedance (≤100 kHz). |
| Impedance Range | 1 kΩ to 10 MΩ (with front-end) | 1 mΩ to 1 TΩ | AD5933 requires front-end design for specific range. |
| Accuracy (Typical) | 0.5% to 5% (system dependent) | 0.05% to 0.1% | Benchtop superior for absolute measurements. |
| Excitation Voltage | Programmable, typ. 0.2 to 2 V p-p | Programmable, up to ±20 V | AD5933 limited for high-impedance materials. |
| Measurement Speed | ~30 ms per point (system dependent) | ~1-10 ms per point | Comparable for low-point-count sweeps. |
| Cost | ~$50-$500 (components) | $15,000 - $50,000+ | AD5933 enables high accessibility. |
| Customization | High (open firmware, front-end) | Low (closed, vendor-defined) | AD5933 allows application-specific optimization. |
Step-by-Step Configuration Protocol
Hardware Configuration
A. Microcontroller Interface
- MCU Selection: Use an MCU with a robust I²C interface and sufficient GPIO. Common choices include:
- Arduino Uno/Nano (ATmega328P): For simplicity and prototyping.
- STM32 Nucleo (ARM Cortex-M): For higher performance and DMA.
- Raspberry Pi Pico (RP2040): For dual-core processing and custom PIO.
- Wiring Protocol:
- Connect AD5933
VDDto +3.3V. DO NOT USE 5V. - Connect
GNDto common ground. - Connect
SCLandSDAto MCU I²C pins with 4.7 kΩ pull-up resistors to 3.3V. - Connect
MCLKto an MCU-generated square wave (2.5-5 MHz) for the internal system clock.
- Connect AD5933
B. Front-End (Analog) Design The critical stage for lab-ready measurements. A basic transimpedance amplifier (TIA) is required.
Table 2: Essential Research Reagent Solutions & Materials (The Scientist's Toolkit)
| Item | Function in AD5933 Experiment | Typical Example / Specification |
|---|---|---|
| AD5933 Evaluation Board | Quick-start platform for initial validation. | Analog Devices EVAL-AD5933EBZ. |
| Precision Op-Amp | Core of the front-end TIA; determines bandwidth and noise. | OPA2188 (low noise, low offset). |
| Calibration Resistor Kit | Set of high-precision, low-inductance resistors for system calibration. | 1 kΩ, 10 kΩ, 100 kΩ, 1 MΩ, 0.1% tolerance. |
| Electrochemical Cell or DUT Fixture | Holds the Device Under Test (DUT). | Custom PCB with Kelvin clips or a glass cell with gold electrodes. |
| Low-EMF Cabling | Minimizes noise in low-signal measurements. | Shielded coaxial or twisted-pair cables. |
| Buffer Solution (e.g., PBS) | For biosensor measurements, provides stable ionic environment. | 1X Phosphate Buffered Saline, pH 7.4. |
| Reference Electrolyte | For electrochemical impedance spectroscopy (EIS) validation. | 5 mM Potassium Ferricyanide in 1M KCl. |
| Stable Voltage Regulator | Provides clean 3.3V and 5V rails to analog and digital components. | LT3042 (low noise LDO). |
Experimental Protocol 1: TIA Front-End Assembly & Calibration
- Assemble Circuit: Build a TIA using a precision op-amp. Connect the AD5933's
VOUTto the TIA input via a current-limiting resistor (~100Ω). The DUT connects between TIA input and virtual ground. - Calibrate Gain Resistor (
Rfb):- Replace DUT with a precision calibration resistor (
Rcal). - Run an impedance sweep. The AD5933 returns a complex value (real
R, imaginaryI). - Calculate gain factor:
GF = 1 / (Rcal * sqrt(R² + I²)). StoreGFfor this frequency. - Repeat for all frequencies in the sweep to create a frequency-dependent
GFarray.
- Replace DUT with a precision calibration resistor (
- Validate: Measure a known resistor (different value from
Rcal). Calculate impedance:Z = 1 / (GF * sqrt(R² + I²)). Accuracy should be within <1% error for the mid-impedance range.
Title: AD5933 Front-End Signal Path & Calibration Switching
Software & Firmware Configuration
Experimental Protocol 2: Microcontroller Firmware Setup
- Initialize I²C & Clock: Configure MCU's I²C at 400 kHz. Generate a stable
MCLK(e.g., 4 MHz) using a timer or PLL. - AD5933 Register Setup (Key Steps):
- Reset: Write to Control Register (0x80).
- Set Start Frequency: Write 3 bytes to registers 0x82, 0x83, 0x84.
f_start = (freq_word * MCLK) / 2^27. - Set Frequency Increment: Registers 0x85, 0x86, 0x87.
- Set Number of Increments: Registers 0x88, 0x89.
- Set Output Voltage & PGA: Register 0x80. Example:
0x11for 2.0 V p-p, PGA gain x1.
- Measurement Loop:
- Issue Start Frequency Sweep command (0x10).
- Poll Status Register (0x8F) for Valid Data bit.
- Read Real and Imaginary data registers (0x94-0x97).
- Apply calibration data (
GF) to calculate impedance. - Issue Increment Frequency command, repeat.
Title: AD5933 System Firmware Workflow Logic
System Validation Experiment
Experimental Protocol 3: Comparative Performance Analysis (AD5933 vs. Benchtop)
- Objective: Quantify accuracy and noise performance of the configured AD5933 system against a reference benchtop analyzer.
- Materials: Configured AD5933 system, Keysight E4990A, calibration resistor kit, RC network board (100Ω + 100nF).
- Method:
- Resistor Sweep: Measure impedance magnitude (|Z|) and phase (θ) of resistors (1kΩ, 10kΩ, 100kΩ) from 100 Hz to 50 kHz using both systems.
- RC Network Sweep: Measure the series RC network across the same range to assess frequency response.
- Noise Floor: Short the DUT terminals and measure the standard deviation of |Z| over 100 readings at 1 kHz.
- Data Analysis: Calculate percent error relative to the benchtop analyzer's value or the component's nominal value. Plot Bode plots (|Z| and θ vs. f) for both systems.
Table 3: Example Validation Results (Hypothetical Data)
| DUT | Frequency | Benchtop | Z | (Ω) | AD5933 | Z | (Ω) | Error (%) | Benchtop Phase (°) | AD5933 Phase (°) | Phase Error (°) |
|---|---|---|---|---|---|---|---|---|---|---|---|
| 10.00 kΩ Resistor | 1 kHz | 10000.5 | 10015.2 | +0.15% | -0.01 | -0.5 | -0.49 | ||||
| 100.0 kΩ Resistor | 10 kHz | 100001 | 98650 | -1.35% | -0.02 | -1.8 | -1.78 | ||||
| 100Ω + 100nF RC | 5 kHz | 361.2 | 358.9 | -0.64% | -56.31 | -55.1 | +1.21 | ||||
| Noise Floor (Short) | 1 kHz | 0.05 Ω (std dev) | 2.1 Ω (std dev) | N/A | N/A | N/A | N/A |
This guide provides a replicable protocol for configuring a lab-ready AD5933 measurement system. The validation data demonstrates that while a well-configured AD5933 system can achieve sub-2% error for mid-range impedances near its calibration point, it exhibits higher noise and phase error compared to a benchtop analyzer. This supports the thesis that the AD5933 is a viable, low-cost tool for specific lab applications where absolute precision is secondary to relative changes (e.g., sensor kinetics, cell growth monitoring). However, for characterization of novel materials or validation of sensors requiring traceable accuracy, a benchtop impedance analyzer remains the indispensable laboratory standard.
This Standard Operating Procedure (SOP) provides a comprehensive guide for operating a modern benchtop impedance analyzer, detailing each step from initialization to data export. The protocol is framed within a research thesis comparing integrated circuit solutions like the AD5933 with full-featured benchtop analyzers for laboratory use in biosensing and material characterization. While IC-based systems offer portability and cost benefits, benchtop analyzers provide superior accuracy, measurement flexibility, and advanced analytical software, making them indispensable for critical research and drug development applications where data integrity is paramount.
Safety & Pre-Operational Checklist
2.1 Personal Protective Equipment (PPE): Wear appropriate lab coat, safety glasses, and nitrile gloves. 2.2 Workspace: Ensure a stable, vibration-free benchtop. Verify power source (100-240 VAC, 50/60 Hz) and proper grounding. 2.3 Analyzer Inspection: Check for visible damage to the unit, front-panel connectors, and test leads. 2.4 Calibration Status: Confirm the instrument's calibration is current per the lab's quality control schedule.
Detailed Step-by-Step Operating Procedure
System Warm-up & Initialization
- Power On: Press the main power switch on the rear panel. Allow the instrument to boot completely.
- Stabilization Period: Let the analyzer warm up for a minimum of 60 minutes to ensure thermal stability of internal oscillators and circuitry. This is critical for achieving specified accuracy.
- Initial State: After warm-up, press the
Localkey on the front panel to ensure remote operation (if used) is disabled.
Test Setup & Cable Connection
- Fixture Selection: Choose the appropriate test fixture (e.g., 2-terminal, 4-terminal pair, or a dedicated electrode fixture) for your Device Under Test (DUT).
- Connection: Securely connect the fixture cables to the analyzer's designated
HIGHandLOWcurrent and potential ports. For 4-terminal measurements, ensureHIGHandLOWpotential leads are connected inside the current leads on the DUT. - DUT Mounting: Place or connect the DUT (e.g., a sensor in a flow cell, a battery cell, a material sample) to the fixture. Ensure secure, stable contacts.
Basic Measurement Configuration
Access the MEASURE menu and configure the core parameters as detailed in Table 1.
Table 1: Core Measurement Parameter Configuration
| Parameter | Typical Setting | Purpose & Notes | ||
|---|---|---|---|---|
| Measurement Function | Impedance ( | Z | and θ) | Core output. May also select admittance (Y). |
| Frequency Range | User-defined (e.g., 1 Hz – 1 MHz) | Sets start (Fstart) and stop (Fstop) frequencies. | ||
| Number of Points | 10 per decade (or 101 points logarithmic) | Determines measurement resolution. | ||
| AC Signal Level | 10 mV (for electrochemical cells) | Applied test voltage. Must be within DUT's linear range. | ||
| DC Bias | 0 V (unless specified) | Superimposed DC potential. | ||
| Averaging Factor | 3 to 5 | Reduces random noise at the cost of speed. | ||
| Integration Time / Bandwidth | Medium (or 3 Hz) | Sets measurement speed/accuracy trade-off. |
Advanced Setup: Equivalent Circuit Analysis
For in-situ analysis, configure the analyzer's built-in model fitting:
- Navigate to
ANALYSIS>EQUIVALENT CIRCUIT. - Select a predefined model (e.g.,
R_s + (C_dl || R_ct)for a simple electrode-electrolyte interface). - Initiate the fitting routine. The analyzer will output fitted parameter values (e.g., Rct, Cdl).
Measurement Execution & Data Validation
- Open/Short/Load Compensation: Perform this correction after fixture connection but before DUT measurement.
- Measure known
OPEN,SHORT, and standardLOAD(e.g., 1 kΩ resistor) conditions. - The analyzer stores error terms (stray capacitance, lead inductance, residual impedance) to correct subsequent DUT data.
- Measure known
- Run Measurement: Press
SingleorRunto initiate the frequency sweep. - Real-Time Monitor: Observe the Nyquist (Cole-Cole) or Bode plots on screen for obvious anomalies (e.g., open circuit arcs, excessive scatter).
Data Export Protocol
- Storage: Save the data file to the instrument's internal memory or a connected USB drive.
- Export Format: Select multi-column ASCII text (
.txtor.csv) for maximum compatibility with external software (e.g., ZView, Origin, Python). - Data Structure: Ensure the exported file includes at minimum: Frequency (Hz), |Z| (Ω), Phase (θ, degrees), Zreal (Ω), Zimag (Ω).
- Transfer: For networked instruments, use SCPI commands or vendor software to transfer data directly to a laboratory server.
Experimental Protocol: Impedance-Based Monitoring of Cell Barrier Integrity
This protocol, frequently cited in drug development, highlights the analyzer's application.
Objective: To monitor the formation and perturbation of a monolayer of Madin-Darby Canine Kidney (MDCK) cells cultured on a porous membrane using a benchtop analyzer.
Materials: See "The Scientist's Toolkit" below. Method:
- Setup: Insert the cell culture-transwell insert with electrodes into the customized holder connected to the analyzer.
- Baseline: Measure the impedance spectrum (e.g., 100 Hz to 100 kHz) of the cell-free coated membrane in culture medium. Record as Day 0 control.
- Monitoring: Seed cells on the membrane. Perform a brief, low-resolution impedance measurement (e.g., at a single representative frequency like 400 Hz or 1 kHz) daily to track monolayer growth without stressing the cells.
- Full Characterization: On days of interest (e.g., pre-confluent, confluent, post-treatment), perform a full multi-frequency sweep.
- Perturbation Experiment: At confluence, add a compound under investigation (e.g., a candidate drug, an inflammatory cytokine). Measure impedance at the single frequency every 5-15 minutes and full spectra at baseline and endpoint.
- Data Analysis: Calculate the Normalized Cell Index or Transendothelial Electrical Resistance (TEER) using the analyzer's math function:
R_cell = R_total - R_blank, where R is derived from the real component of impedance at the selected frequency.
Diagram Title: Workflow for Impedance-Based Cell Barrier Assay
Benchtop Analyzer vs. AD5933: Key Performance Data
Table 2: Comparative Analysis of Benchtop Analyzer vs. AD5933 IC Solution
| Feature | Benchtop Analyzer (e.g., Keysight E4990A) | AD5933-Based System | Impact on Research |
|---|---|---|---|
| Frequency Range | 1 Hz to 3/10/30/120 MHz (model dependent) | 1 kHz to 100 kHz | Benchtop enables dielectric spectroscopy & wide dispersion analysis. |
| Impedance Range | 1 mΩ to 100 MΩ (extended with fixtures) | ~1 kΩ to 10 MΩ | Benchtop handles batteries (low Z) and insulators (high Z). |
| Basic Accuracy | ±0.05% to ±0.8% typical | ~5% to 10% (system dependent) | Critical for quantitative model fitting and publication. |
| Excitation Control | Precisely variable AC voltage/current, DC bias | Fixed AC voltage range, no DC bias | Benchtop allows linearity checks and electrochemistry. |
| Built-in Analysis | Full equivalent circuit fitting, graphing | Raw impedance & phase data only | Drastically reduces post-processing time for researchers. |
| Automation | Full SCPI command set, LAN/GPIB/USB | Limited I2C commands for data fetch | Benchtop integrates into automated high-throughput workflows. |
The Scientist's Toolkit: Key Reagent Solutions & Materials
Table 3: Essential Materials for Impedance-Based Cellular Assays
| Item | Function & Rationale |
|---|---|
| Cell Culture-Transwell Inserts | Polyester/Collagen-coated porous membranes (0.4-3.0 µm pores) that serve as the scaffold for cell growth and are compatible with electrode integration. |
| Gold-plated or ITO Electrodes | Provide stable, biocompatible, and low-impedance electrical interfaces for transepithelial/transendothelial measurements. |
| Cell Culture Medium | Standard growth medium (e.g., DMEM + FBS) for maintaining cell viability during experiments. Phenol-red free medium is recommended for optical clarity if combining with microscopy. |
| Trypsin-EDTA Solution | For detaching and passaging cells prior to seeding on inserts. |
| Paracellular Tracer Molecules | (e.g., Fluorescein isothiocyanate–dextran) Used in parallel experiments to validate impedance data with a direct measure of permeability. |
| Positive Control Compounds | (e.g., Histamine, EGTA, TNF-α) Known disruptors of barrier function used to calibrate assay sensitivity and instrument response. |
| Electrode Cleaning Solution | (e.g., 70% ethanol, Hellmanex solution) For decontamination and removal of protein/biofilm buildup from electrodes between experiments. |
Diagram Title: Key Components in a Cell Barrier Impedance Assay
Routine Maintenance & Shutdown
- Daily: Power down the analyzer after use if not in frequent service. Disconnect test fixtures and store them properly.
- Weekly: Clean the instrument's exterior and cooling vents with a soft, dry cloth.
- Monthly: Perform a basic verification using a known precision resistor (e.g., 1 kΩ ±0.01%).
- Annual/As Recommended: Schedule professional calibration and performance verification with the manufacturer or certified metrology lab.
Troubleshooting Guide
- Noisy/Erratic Data: Check cable connections, increase averaging, reduce AC signal level, ensure DUT stability, verify proper warm-up.
- Impedance Out of Expected Range: Verify open/short/load compensation was performed, check for poor DUT contact, confirm fixture compatibility.
- Communication Error with PC: Verify cable/port settings, check instrument is in
REMOTEmode, reinstall/update driver software.
This SOP, when followed meticulously, ensures the generation of high-fidelity impedance data. Within the thesis context, it underscores that while the AD5933 serves well for dedicated, narrow-range applications, the benchtop impedance analyzer remains the gold standard for rigorous, flexible, and publication-ready research in pharmaceutical development and advanced materials science.
Abstract: This whitepaper provides an in-depth technical examination of Transendothelial/Epithelial Electrical Resistance (TEER) as the gold standard for real-time, non-destructive monitoring of cell layer integrity. Framed within a broader research thesis comparing the utility of the integrated circuit AD5933 impedance analyzer against traditional benchtop systems for laboratory research, this guide details protocols, data analysis, and practical implementation strategies for researchers in drug development and basic biology.
In modern cell biology and drug development, real-time quantification of cell layer health and barrier function is paramount. TEER measurement is a critical technique for assessing the formation and breakdown of tight junctions in endothelial and epithelial monolayers (e.g., blood-brain barrier, intestinal lining). The core instrument for this is an impedance analyzer.
The research thesis central to this discussion posits that while traditional benchtop impedance analyzers offer high precision and broad frequency ranges, compact, lower-cost solutions centered on chips like the Analog Devices AD5933 can provide sufficient accuracy, greater accessibility, and superior integration potential for long-term, automated culture monitoring. This guide explores TEER implementation through both paradigms.
Core Principles of TEER Measurement
TEER quantifies the ionic flow resistance across a confluent cell layer cultured on a porous membrane insert. As tight junctions form, resistance increases; upon insult (e.g., cytotoxic compounds, inflammatory cytokines), resistance drops. The measured resistance (Ω) is normalized by the membrane's surface area (cm²) to calculate TEER (Ω·cm²).
- Key Formula:
TEER (Ω·cm²) = (R_total - R_blank) × Effective Membrane AreaR_total: Measured resistance of cell layer + membrane + medium.R_blank: Resistance of blank membrane + medium (background).- Effective Membrane Area: Area of the porous membrane (e.g., 0.33 cm² for common 24-well inserts).
System Comparison: AD5933 vs. Benchtop Analyzer
The table below summarizes the quantitative comparison central to the overarching thesis.
Table 1: Technical Comparison of TEER Measurement Systems
| Feature | Benchtop Impedance Analyzer (e.g., Keysight, Zurich Instruments) | AD5933-Based Custom System |
|---|---|---|
| Typical Frequency Range | 1 Hz – 50+ MHz | 1 Hz – 100 kHz |
| Impedance Accuracy | High (±0.1% typical) | Moderate (±5% typical, depends on calibration) |
| Measurement Channels | Typically 1-2, expandable with multiplexers at high cost | Easily scalable to multi-well arrays via multiplexing ICs |
| Cost per Channel | Very High ($5k - $20k+) | Very Low ($10 - $50 per channel for core electronics) |
| Integration Potential | Stand-alone unit, limited by proprietary software. | High. Can be integrated into incubators, controlled via Arduino/Raspberry Pi. |
| Primary Research Use Case | High-precision, single-experiment characterization; broad-spectrum EIS. | Long-term, real-time kinetic studies; high-throughput screening; custom bioreactor integration. |
| Key Advantage | Ultimate precision, stability, and support. | Accessibility, scalability, and customization for kinetic monitoring. |
Experimental Protocols
Protocol 1: Standardized TEER Measurement for Barrier Integrity Assessment
Objective: To monitor the formation and cytokine-induced disruption of a Caco-2 intestinal epithelial monolayer.
Materials (Scientist's Toolkit): Table 2: Essential Research Reagent Solutions for TEER Assays
| Item | Function & Explanation |
|---|---|
| Caco-2 Cells | Human colorectal adenocarcinoma cell line; gold standard for intestinal barrier models. |
| DMEM, High Glucose | Culture medium providing essential nutrients for cell growth. |
| Fetal Bovine Serum (FBS) | Serum supplement providing growth factors and adhesion proteins. |
| Transwell Polyester/Collagen Inserts | Permeable supports with defined pore size (e.g., 0.4 μm) for cell polarization. |
| TNF-α & IL-1β Cytokines | Pro-inflammatory cytokines used to experimentally induce barrier dysfunction. |
| EVOM2 or CellZScope (Benchmark) | Commercial benchtop TEER meters for validation of custom system data. |
| Sterile Electrodes (Ag/AgCl) | Non-cytotoxic electrodes for reliable, stable measurements. |
| Custom AD5933 Board w/ MUX | For scalable, real-time data acquisition (core thesis component). |
Methodology:
- Cell Seeding: Seed Caco-2 cells at high density (e.g., 1x10^5 cells/cm²) onto collagen-coated Transwell inserts. Place inserts in a 24-well plate with medium in both apical and basolateral chambers.
- Monitoring Growth: Measure TEER daily using either a benchtop system (for periodic checks) or a continuously measuring AD5933 array placed inside the incubator.
- Experimental Insult: Once TEER plateaus (typically >300 Ω·cm²), add a cocktail of TNF-α (10 ng/mL) and IL-1β (5 ng/mL) to the basolateral chamber.
- Kinetic Measurement: Record TEER every 15-30 minutes for 24-48 hours using the AD5933 system. Validate key timepoints with a benchtop meter.
- Data Normalization: Subtract the average resistance of blank inserts from all values. Multiply by the insert's effective membrane area. Plot as TEER (Ω·cm²) vs. Time.
Protocol 2: System Calibration for AD5933-based Measurement
Objective: To ensure accurate impedance readings from a custom AD5933 circuit.
Methodology:
- Circuit Setup: Implement a 4-terminal (2-probe) connection to the cell culture insert. Include a multiplexer for multi-well reading.
- Calibration with Known Resistors: Over the expected measurement range (e.g., 50Ω to 2kΩ), measure a series of precision resistors (1% tolerance) in the measurement fixture.
- Gain Factor Calculation: Use the AD5933's internal calibration routine to compute a gain factor for each frequency point of interest (typically a single low frequency, e.g., 100 Hz - 10 kHz for TEER).
- Validation with RC Network: Measure a known resistor-capacitor parallel network to verify phase and magnitude accuracy across the frequency sweep.
Signaling Pathways in Barrier Dysfunction
Inflammatory cytokine-induced TEER reduction is mediated through defined intracellular signaling pathways.
Diagram 1: Cytokine-Induced Barrier Disruption Signaling
Experimental Workflow for Comparative Thesis Research
The logical flow for a study validating an AD5933 system against a benchtop analyzer.
Diagram 2: Thesis Validation Workflow
Real-time TEER monitoring is indispensable for barrier function research. Benchtop analyzers provide reference-standard data, validating the AD5933's capability to deliver reliable, kinetically rich data at a fraction of the cost and with superior scalability. For longitudinal studies, high-throughput screens, and customized microenvironment integration, an AD5933-based system presents a compelling, research-grade alternative, shifting the thesis from pure performance comparison to one of optimal tool application.
This technical guide explores the application of electrochemical impedance spectroscopy (EIS) in biosensor development, specifically framed within a comparative research context: employing a cost-effective, integrated impedance analyzer like the AD5933 versus a traditional benchtop impedance analyzer for laboratory research. The primary thesis investigates whether the AD5933, with its limitations in frequency range and precision, can yield sufficiently reliable data for the characterization of electrochemical biosensors, particularly in proof-of-concept and early-stage development phases where accessibility and cost are constraints. The target is to define the suitability envelope for each tool.
Core Principles of Electrochemical Biosensors
Electrochemical biosensors transduce a biological recognition event (e.g., antibody-antigen binding, DNA hybridization, enzymatic reaction) into a quantifiable electrical signal. EIS is a powerful, non-destructive technique for characterizing the step-by-step fabrication of these sensors and for monitoring biomolecular interactions in real-time. It measures the complex impedance (Z) of an electrochemical cell as a function of frequency.
Key Electrical Components in an EIS Biosensor Model: The electrode-solution interface is commonly modeled using the Randles equivalent circuit, which includes:
- Solution Resistance (R_s): Resistance of the electrolyte.
- Charge Transfer Resistance (R_ct): Resistance to electron transfer across the electrode interface. This is the most critical parameter for biosensing, as it increases significantly upon the binding of insulating biomolecules (e.g., proteins) to the electrode surface.
- Double Layer Capacitance (C_dl): Capacitance of the ionic double layer at the electrode interface.
- Warburg Impedance (W): Resistance related to mass diffusion of redox species.
Biomolecular binding events primarily increase Rct and modify Cdl, which can be sensitively tracked via EIS.
Diagram Title: Biosensor Signaling Cascade from Binding to Impedance Signal
Diagram Title: Randles Circuit Model and Corresponding Physical Interface
Experimental Protocol: Biosensor Fabrication and EIS Characterization
This protocol details a standard sandwich-format immunosensor for detecting a model protein (e.g., C-Reactive Protein).
Materials & Reagent Solutions
The Scientist's Toolkit: Essential Research Reagents & Materials
| Item | Function & Explanation |
|---|---|
| Gold Disk Electrode (2mm dia.) | Standard working electrode substrate. Gold allows for easy chemical functionalization via thiol-gold chemistry. |
| Potassium Ferri/Ferrocyanide | Redox probe ([Fe(CN)₆]³⁻/⁴⁻). Essential for EIS measurements, its electron transfer efficiency is modulated by surface binding events. |
| Phosphate Buffered Saline (PBS) | Standard physiological buffer for biomolecule immobilization and binding assays. Maintains pH and ionic strength. |
| 11-Mercaptoundecanoic acid (11-MUA) | Self-assembled monolayer (SAM) forming molecule. Creates a stable, carboxyl-terminated interface for subsequent biomolecule immobilization. |
| N-(3-Dimethylaminopropyl)-N'-ethylcarbodiimide (EDC) / N-Hydroxysuccinimide (NHS) | Crosslinking agents. Activate carboxyl groups on the SAM for covalent coupling to amine groups on capture antibodies. |
| Capture Antibody (Anti-target) | The primary biorecognition element. Immobilized on the electrode to specifically bind the target analyte. |
| Target Protein Antigen | The analyte of interest to be detected and quantified. |
| Detection Antibody (Labeled) | Secondary antibody that binds to a different epitope on the captured target, often used in sandwich assays for signal amplification. |
| Bovine Serum Albumin (BSA) | Used as a blocking agent to passivate unreacted sites on the electrode surface, minimizing non-specific adsorption. |
| Potentiostat with EIS Capability | Core instrument. Applies potential and measures current/impedance. Benchmark device for comparison. |
| AD5933 Evaluation Board | Integrated circuit impedance analyzer. Device under evaluation for its performance vs. benchtop potentiostat. |
Step-by-Step Fabrication & Measurement Methodology
- Electrode Pretreatment: Polish gold electrode with 0.3 µm and 0.05 µm alumina slurry sequentially. Rinse with ethanol and DI water. Electrochemically clean in 0.5 M H₂SO₄ via cyclic voltammetry (CV) until a stable CV profile is obtained.
- SAM Formation: Immerse the clean electrode in a 1 mM ethanolic solution of 11-MUA for 12 hours at room temperature to form a monolayer. Rinse with ethanol.
- Antibody Immobilization: Incubate the SAM-modified electrode in a 1:1 mixture of 40 mM EDC and 10 mM NHS in PBS for 30 min to activate carboxyl groups. Rinse with PBS. Immediately incubate with 50 µg/mL capture antibody in PBS (pH 7.4) for 1 hour. Rinse.
- Blocking: Incubate the electrode in 1% (w/v) BSA in PBS for 30 minutes to block non-specific sites. Rinse thoroughly.
- Target Binding (Assay): Incubate the functionalized electrode with a sample containing the target antigen at varying concentrations (e.g., 0.1 pg/mL to 100 ng/mL) for 45 minutes. Rinse.
- EIS Measurement: Perform EIS in a solution of 5 mM K₃[Fe(CN)₆]/K₄[Fe(CN)₆] (1:1) in 0.1 M PBS. Apply identical parameters on both analyzers: DC bias at formal potential of redox probe (~0.22 V vs Ag/AgCl), AC amplitude of 10 mV, frequency range from 100 kHz to 0.1 Hz. Record Nyquist plots.
Diagram Title: Experimental Workflow for Biosensor Development and EIS Testing
Data Comparison: AD5933 vs. Benchtop Impedance Analyzer
Data synthesized from recent comparative studies (2023-2024) on model biosensor systems.
Table 1: Technical Specifications and Performance Comparison
| Parameter | AD5933-Based System | High-End Benchtop Impedance Analyzer (e.g., Gamry, Autolab) |
|---|---|---|
| Frequency Range | 1 Hz - 100 kHz | 10 µHz - 32 MHz |
| Impedance Range | ~1 kΩ to 10 MΩ | 10 µΩ to >1 TΩ |
| Phase Accuracy | ±0.5° typical (degrades at frequency extremes) | ±0.01° or better |
| Measurement Speed | Slower due to sequential frequency sweeps & calibration needs | Very fast, parallel processing |
| Excitation Control | Fixed 1.98 V p-p excitation, external op-amp needed for biosensor currents | Fully programmable voltage/current excitation with precise biasing |
| Cost | Very Low (< $100 for IC) | Very High ($15,000 - $50,000+) |
| Primary Advantage | Extreme cost-effectiveness, portability, customizability for dedicated systems. | Unmatched accuracy, precision, wide dynamic range, and advanced software for modeling. |
| Best Suited For | Proof-of-concept, educational use, fixed-point monitoring, systems where cost is the primary constraint. | Fundamental research, publication-grade data, complex interface characterization, wide-frequency studies. |
Table 2: Representative Experimental Data from a Model Immunosensor Assay (Simulated data reflecting trends from current literature)
| Target Concentration | Benchtop Analyzer | AD5933 System | % Deviation in R_ct | ||
|---|---|---|---|---|---|
| Measured R_ct (kΩ) | Fitted Error (%) | Measured R_ct (kΩ) | Fitted Error (%) | ||
| 0 (Blank) | 5.2 ± 0.1 | 1.2 | 5.5 ± 0.4 | 5.8 | +5.8% |
| 1 pg/mL | 8.1 ± 0.2 | 1.5 | 8.7 ± 0.6 | 6.5 | +7.4% |
| 10 pg/mL | 12.7 ± 0.3 | 1.3 | 13.5 ± 0.9 | 6.1 | +6.3% |
| 100 pg/mL | 21.5 ± 0.4 | 1.0 | 22.8 ± 1.2 | 5.0 | +6.0% |
| 1 ng/mL | 35.6 ± 0.6 | 1.1 | 36.9 ± 1.8 | 4.7 | +3.6% |
| 10 ng/mL | 48.3 ± 0.7 | 0.9 | 49.1 ± 2.1 | 4.2 | +1.7% |
Within the thesis context, the AD5933 proves to be a viable tool for qualitative and semi-quantitative biosensor development when used within its operational constraints. It reliably tracks the increasing trend in R_ct with target concentration, which is often sufficient for initial feasibility studies, sensor optimization, or educational demonstrations. The key deviations from benchtop data occur at very low frequencies (<10 Hz) and for very high impedance values (>1 MΩ), where its accuracy diminishes.
Recommendation: Researchers developing novel biorecognition chemistries or sensor architectures can use the AD5933 for rapid, low-cost iterative testing. However, for final validation, publication, or any study requiring precise kinetic or mechanistic insights from the EIS data, a benchtop analyzer remains the indispensable gold standard. The choice is not one of superiority but of appropriate application within the research and development pipeline.
This technical guide examines the application of electrochemical impedance spectroscopy (EIS) for characterizing materials and coatings used in biomedical devices, such as stents, orthopedic implants, and biosensors. The analysis is framed within a broader research thesis comparing the utility of the integrated circuit-based AD5933 impedance analyzer system against traditional benchtop impedance analyzers (e.g., from Keysight, Gamry, or Biologic) for laboratory research. For researchers and drug development professionals, the selection between a portable, cost-effective AD5933 solution and a high-performance, full-featured benchtop unit hinges on the specific requirements of material characterization—including frequency range, accuracy, and the complexity of equivalent circuit modeling.
Core Principles of Impedance Analysis for Biomaterials
The impedance of a biomaterial or coating, often measured in a physiologically relevant electrolyte (e.g., phosphate-buffered saline), reveals critical information about its:
- Barrier Properties: Corrosion resistance and ion permeability of protective coatings.
- Biocompatibility: Stability and rate of degradation in vitro.
- Biofouling: Formation of protein or cellular layers on the surface.
- Drug Elution: Kinetics from polymer-based coatings.
EIS measurements are typically represented by Nyquist or Bode plots, and data is fitted to electrical equivalent circuit (EEC) models that represent physical processes at the electrode-electrolyte interface.
Experimental Protocols for Coating Characterization
Protocol 1: Standard EIS for Coating Integrity
Objective: To assess the degradation and protective quality of a hydroxyapatite coating on a titanium alloy implant.
- Setup: A standard three-electrode cell is used: coated Ti alloy as the working electrode, platinum mesh as the counter electrode, and Ag/AgCl (in 3M KCl) as the reference electrode. The electrolyte is 0.9% NaCl at 37°C.
- Measurement: Using a benchtop analyzer, an AC sinusoidal perturbation of 10 mV RMS is applied across a frequency range of 100 kHz to 10 mHz at the open circuit potential.
- Analysis: The acquired Nyquist plot is fitted to a Randles circuit with a constant phase element (CPE) to account for coating heterogeneity. The coating resistance (Rcoat) and capacitance (Ccoat) are extracted.
Protocol 2: Long-Term Stability Monitoring
Objective: To monitor the impedance of a polymer-based drug-eluting stent coating over 30 days.
- Setup: The coated stent serves as the working electrode in a miniaturized flow cell simulating vascular conditions.
- Measurement: Using an AD5933-based system for its portability and ability to automate periodic measurements. A single-frequency (e.g., 1 kHz) or a limited multi-frequency sweep is taken every 6 hours.
- Analysis: The log of impedance modulus at 1 kHz is plotted versus time. A significant drop indicates coating failure or drug depletion.
Protocol 4: Data Acquisition & Equivalent Circuit Fitting
Title: EIS Data Analysis Workflow for Biomaterials
Protocol 3: Biofouling Assessment
Objective: To quantify protein adsorption (e.g., fibrinogen) on a hydrophobic polymer coating.
- Setup: Identical to Protocol 1. Baseline EIS is measured in PBS.
- Intervention: A known concentration of fibrinogen is introduced into the cell. The system is incubated for 1 hour.
- Measurement: EIS is repeated. The change in charge transfer resistance (derived from EEC fitting) is correlated to the degree of surface coverage.
AD5933 vs. Benchtop Analyzer: Critical Comparison for Biomaterial Analysis
The following table summarizes key performance parameters relevant to biomaterial testing, based on current device specifications and literature.
Table 1: Analyzer Comparison for Biomaterial EIS
| Parameter | AD5933-Based System | Typical Benchtop Analyzer (e.g., Gamry Interface 1010E) | Implication for Biomaterial Research |
|---|---|---|---|
| Frequency Range | 1 Hz - 100 kHz | 10 µHz - 1 MHz / 32 MHz | Benchtop essential for very low-freq polymer relaxation studies. |
| Impedance Range | ~1 kΩ to 10 MΩ | 10 mΩ to >1 TΩ (with booster) | Benchtop required for very high-Z, intact insulating coatings. |
| Accuracy (Typical) | Phase: ~1°, Magnitude: ~0.5% | Phase: <0.1°, Magnitude: <0.1% | Benchtop needed for precise, publication-grade kinetic models. |
| EEC Fitting Software | External (e.g., ZFit in MATLAB) | Integrated, advanced (e.g., Gamry Echem Analyst) | Benchtop offers streamlined, validated analysis workflows. |
| Portability / Cost | High / Low (< $500) | Low / High ($15k - $50k+) | AD5933 enables decentralized, high-throughput screening. |
| Best Use Case | Long-term stability monitoring, rapid screening of coating formulations. | Detailed characterization, publication data, low-frequency degradation studies. |
The Scientist's Toolkit: Key Research Reagent Solutions
Table 2: Essential Materials for Biomaterial Impedance Experiments
| Item | Function in Experiment |
|---|---|
| Phosphate-Buffered Saline (PBS) | Standard isotonic and pH-stable electrolyte simulating physiological conditions. |
| Simulated Body Fluid (SBF) | Ion concentration similar to blood plasma, used for testing bioactivity and apatite formation. |
| Potassium Ferricyanide/ Ferrocyanide | Standard redox probe ([Fe(CN)₆]³⁻/⁴⁻) for characterizing coating permeability and effective electrode area. |
| Bovine Serum Albumin (BSA) or Fibrinogen | Model proteins for studying non-specific protein adsorption and biofouling on surfaces. |
| Ag/AgCl Reference Electrode (3M KCl) | Provides a stable, reproducible reference potential in chloride-containing electrolytes. |
| Polystyrene or PTBE Cell Culture Wells | Multi-well plates for parallel, high-throughput EIS screening of multiple coating samples. |
| Equivalent Circuit Fitting Software (e.g., ZView, EC-Lab) | Deconvolutes EIS spectra into physically meaningful parameters (R, C, diffusion elements). |
Signaling Pathway in Biomaterial-Host Interaction
Title: Host Response to Implant & EIS Detection Points
Impedance analysis is a powerful, non-destructive tool for the development and quality assurance of biomedical device materials and coatings. The choice between an AD5933-based system and a benchtop analyzer is contingent on the research phase. Early-stage, high-throughput screening and long-term degradation monitoring are well-served by the AD5933's accessibility and automation. In contrast, definitive characterization, mechanistic studies requiring ultra-low frequencies, and validation for regulatory submissions necessitate the accuracy, dynamic range, and sophisticated software of a benchtop instrument. A hybrid approach, using the AD5933 for monitoring and the benchtop for pinpoint analysis, represents an efficient strategy for modern biomedical research labs.
Solving Common Pitfalls: Calibration, Noise, and Accuracy Optimization for Reliable Data
In the context of research comparing the AD5933 network analyzer chip against benchtop impedance analyzers for laboratory use, the calibration procedure is paramount. The AD5933, a lower-cost, integrated solution for impedance measurement, relies heavily on accurate calibration to approximate the performance of high-end benchtop instruments. This guide delves into the core Open/Short/Load (OSL) calibration methodology, its implementation, and its intrinsic limitations, providing researchers and drug development professionals with the technical depth necessary for critical experimental design.
The OSL Calibration Procedure: Theory and Implementation
Calibration is the process of characterizing systematic errors in a measurement system so they can be mathematically removed. For a two-port measurement device like an impedance analyzer, the OSL (also known as SOL) procedure is fundamental.
Core Principle: The analyzer measures known calibration standards—an Open, a Short, and a Load (typically 50Ω or 1kΩ). The discrepancies between the measured and ideal values of these standards define a 12-term error model (forward and reverse for six error terms each). Applying this model to subsequent Device Under Test (DUT) measurements yields corrected, accurate results.
Experimental Protocol for OSL Calibration
Pre-calibration Setup:
- Ensure the measurement system (AD5933 evaluation board or benchtop analyzer) and all cables are thermally stabilized (≥30 minutes post-power-on).
- Select the frequency sweep range and number of points relevant to the DUT (e.g., 1 kHz to 100 kHz for a biosensor).
Standard Measurements:
- Open Standard: Connect an open calibration standard (no component, just parasitic open-circuit characteristics) to the measurement port. Perform a full frequency sweep. The model assumes infinite impedance.
- Short Standard: Connect a short calibration standard (a high-quality, low-inductance short) to the measurement port. Perform a sweep. The model assumes zero impedance.
- Load Standard: Connect a precision load resistor with minimal parasitic inductance/capacitance. The value must be known to high accuracy (e.g., 0.1% tolerance). Perform a sweep.
Error Model Calculation:
- The instrument's firmware or external software uses the complex impedance data (magnitude and phase) from the three standards to solve the error model equations. This generates a calibration coefficient file.
DUT Measurement:
- Connect the Device Under Test (e.g., an electrochemical cell).
- The system applies the error correction in real-time, yielding a calibrated measurement.
Quantitative Limitations of OSL Calibration
The effectiveness of OSL calibration is bounded by several factors. The table below summarizes key limitations, particularly critical when using an integrated circuit like the AD5933 versus a benchtop analyzer.
Table 1: Limitations of OSL Calibration and Impact on Analyzer Type
| Limitation Factor | Description & Impact on AD5933 | Impact on Benchtop Analyzer | Mitigation Strategies |
|---|---|---|---|
| Frequency Range | OSL validity degrades at high frequencies (>>10 MHz for AD5933 boards) due to standard non-ideality and radiation. | High-end models use more complex models (TRL) for RF/microwave ranges. | Limit sweep to frequency where standards are well-characterized. |
| Standard Imperfection | The assumed ideal "Open" has parasitic capacitance; "Short" has parasitic inductance. This is a dominant error source for AD5933. | Uses higher-quality, mechanically defined standards with detailed characterization files. | Use calibration standards rated for the frequency band. Characterize parasitics. |
| Connector Repeatability | Poor connector repeatability on low-cost boards introduces random errors, invalidating the static error model. | High-precision, gold-plated connectors with consistent torque. | Use torque wrench, minimize disconnections, average multiple measurements. |
| System Drift | The AD5933's internal oscillator and analog front-end are temperature-sensitive, causing post-calibration drift. | Ovens, temperature control, and frequent recalibration are standard. | Allow long thermal soak, perform frequent recalibration, control lab temperature. |
| Load Standard Accuracy | The accuracy of the calibrated measurement is directly tied to the accuracy of the known load resistor. A 1% load resistor yields ≥1% uncertainty. | Often uses integrated, highly stable reference resistors. | Use a precision load resistor (0.1% or better) with low temperature coefficient. |
| Measurement Non-Linearity | The OSL model corrects for linear errors. Non-linearities in the AD5933's output amplifier or ADC are not corrected. | Benchtop designs minimize non-linearity through superior circuitry. | Operate within the optimal input voltage range specified in the datasheet. |
The Scientist's Toolkit: Essential Reagents & Materials
Table 2: Key Research Reagent Solutions for Impedance-based Biosensing
| Item | Function in Experimental Context |
|---|---|
| Precision Calibration Resistor (e.g., 1kΩ, 0.1%) | Serves as the critical Load standard for OSL calibration, defining the measurement accuracy anchor point. |
| Phosphate Buffered Saline (PBS) | Standard electrolyte solution for establishing baseline impedance and maintaining biomolecule stability during electrical characterization. |
| Bovine Serum Albumin (BSA) Solution (1-5% w/v) | Used for blocking non-specific binding sites on electrode surfaces to ensure impedance changes are specific to the target analyte. |
| Target-Specific Capture Antibody/Probe | Immobilized on the working electrode to selectively bind the analyte of interest (e.g., a cytokine, virus), causing a measurable impedance shift. |
| Redox Probe (e.g., [Fe(CN)₆]³⁻/⁴⁻) | Used in electrochemical impedance spectroscopy (EIS) to monitor charge transfer resistance changes upon binding events at the electrode interface. |
Visualizing Calibration Workflows and Limitations
Diagram Title: OSL Calibration Workflow and Limitation Points
Diagram Title: Analyzer Comparison in Calibration Context
For researchers in drug development weighing the use of an AD5933 against a benchtop impedance analyzer, understanding the role and limits of OSL calibration is crucial. While the procedure is mathematically robust, its practical effectiveness is determined by the physical imperfections of the standards and the hardware's stability. The AD5933, constrained by cost and integration, is more severely affected by these limitations than a benchtop instrument. Successful implementation requires meticulous attention to the calibration protocol, environmental control, and a clear understanding that the resulting data is most reliable for observing relative changes within a well-controlled experiment, rather than for achieving absolute, traceable accuracy across a broad frequency spectrum.
Within the context of evaluating the AD5933 network analyzer against traditional benchtop impedance analyzers for biomedical and pharmaceutical research, managing electromagnetic interference (EMI) and parasitic effects is paramount. For researchers and scientists measuring subtle impedance changes in biological samples or electrochemical sensors, noise and stray capacitance can obscure critical data, rendering a capable device ineffective. This guide details the core practices necessary to achieve reliable, high-fidelity measurements in a laboratory environment.
The Core Challenge: Noise and Parasitics in Impedance Measurement
Stray capacitance arises from unintended electric fields between conductors, acting as a parasitic capacitor in parallel with the device under test (DUT). This is particularly detrimental at higher frequencies, where even picofarads can significantly distort phase and magnitude readings. Concurrently, EMI from power supplies, digital circuits, and ambient lab equipment couples into measurement paths as conductive, capacitive, or inductive noise.
Quantitative Impact of Stray Capacitance: A 10 pF stray capacitance has a reactance of approximately 1.6 kΩ at 100 kHz, which can shunt a high-impedance DUT, leading to severe measurement errors.
Table 1: Reactance of Stray Capacitance vs. Frequency
| Stray Capacitance | 1 kHz | 10 kHz | 100 kHz | 1 MHz |
|---|---|---|---|---|
| 1 pF | ~159 MΩ | ~15.9 MΩ | ~1.59 MΩ | ~159 kΩ |
| 10 pF | ~15.9 MΩ | ~1.59 MΩ | ~159 kΩ | ~15.9 kΩ |
| 100 pF | ~1.59 MΩ | ~159 kΩ | ~15.9 kΩ | ~1.59 kΩ |
Foundational Principles: Shielding and Grounding
Shielding
Shielding encloses sensitive circuitry or cables in a conductive barrier to block electric fields. For the AD5933, this often involves a coaxial connection to the DUT.
- Guard Shields: A driven guard shield, connected to a low-impedance output replicating the sense voltage, can eliminate leakage currents by maintaining the same potential between the shield and the signal line.
- Faraday Cages: For extremely sensitive measurements, placing the entire DUT and front-end circuitry within a grounded metallic enclosure protects against ambient EMI.
Grounding
A proper grounding scheme provides a common reference point and a safe path for noise currents.
- Star Ground: Employ a single-point "star" ground for analog measurement circuits to prevent noisy ground return currents from digital sections (like the AD5933's microcontroller) from modulating the analog reference.
- Separate Planes: In PCB design for custom AD5933 interfaces, use separate but properly connected analog and digital ground planes. The connection should be at a single point, typically at the power supply entry or the ADC (the AD5933 itself).
Layout Best Practices for PCB and Interconnects
A poor layout can undo the benefits of good shielding and grounding.
- Minimize Loop Areas: Keep current loops (especially high-frequency excitation paths) as small as possible to reduce magnetic field coupling and inductive ringing.
- Component Placement: Place the AD5933, its excitation amplifier, and the transimpedance amplifier (TIA) for current measurement close together. Keep the DUT connection terminals physically proximate to the front end.
- Trace Routing: Use short, direct traces for sensitive analog signals. Route excitation and sense traces as a differential pair if possible. Avoid running sensitive analog traces parallel to or underneath digital clock lines.
Experimental Protocol: Quantifying Shield Effectiveness
This protocol allows researchers to empirically validate shielding improvements for their specific AD5933 setup.
Objective: Measure the reduction in noise floor and stray capacitance after implementing coaxial shielding and guard drives.
Materials: See "The Scientist's Toolkit" below.
Methodology:
- Baseline Measurement: Configure the AD5933 with unshielded, twisted-pair wires connected to a stable, high-precision reference resistor (e.g., 10 kΩ) sitting on an insulated fixture. Perform a frequency sweep (e.g., 1 kHz to 100 kHz). Record the measured impedance magnitude and phase. Repeat with the DUT open-circuited and short-circuited.
- Implement Shielded Configuration: Replace the wiring with a properly grounded coaxial cable (shield connected to system ground at the AD5933 board). Repeat the frequency sweep on the reference resistor and open/short fixtures.
- Implement Guarded Configuration (if supported): Modify the fixture to use a triaxial connection or a guarded PCB layout where the guard driver buffers the sense signal. Repeat the measurement suite.
- Data Analysis: Calculate the measurement stability (standard deviation of repeated measurements) and the apparent stray capacitance from open-circuit measurements (
C_stray = -1/(2πf * Im(Z_open))). Compare results across the three configurations.
Table 2: Hypothetical Experimental Results (Noise Floor Comparison)
| Configuration | Measured 10kΩ Resistor at 50kHz (Mean ± SD) | Calculated Stray Capacitance (from Open) | Observed 60Hz Noise Pickup |
|---|---|---|---|
| Unshielded Wires | 9.85 kΩ ± 125 Ω | ~15 pF | Significant (≥ 5 mVpp) |
| Coaxial Shield | 9.97 kΩ ± 25 Ω | ~8 pF | Minor (~0.5 mVpp) |
| Guarded Coaxial | 10.01 kΩ ± 5 Ω | <1 pF | Negligible |
The Scientist's Toolkit: Essential Research Reagent Solutions
Table 3: Key Materials for Low-Noise Impedance Experimentation
| Item | Function in Experiment |
|---|---|
| AD5933 Evaluation Board | Provides the core impedance measurement system; baseline for modifications. |
| Precision Calibration Resistors (e.g., 0.1% tolerance) | Essential for accurate system calibration and as stable reference DUTs. |
| Coaxial and Triaxial Cables & Connectors (SMA, BNC) | Provides shielded signal paths; triaxial enables guard driving. |
| Faraday Cage / Shielded Enclosure | Isolates the measurement fixture from ambient laboratory EMI. |
| Low-ESR Bypass Capacitors (e.g., 100nF Ceramic + 10µF Tantalum) | Critical for stabilizing power supply rails to the AD5933 and amplifiers, reducing conducted noise. |
| Low-Noise Operational Amplifiers (for external buffers) | Used to build guard drivers or boost output current, ensuring signal integrity. |
| 4-Layer PCB with Dedicated Ground Planes | Optimal substrate for designing a custom, low-parasitic interface circuit for the AD5933. |
| Electrochemical Cell Fixture with Shielded Kelvin Connections | For biosensor research, enables precise 4-point (Kelvin) measurement on a cell while maintaining shielding. |
Signal Integrity & Measurement Workflow
Diagram 1: Low-Noise Impedance Measurement Workflow
Noise Coupling Pathways & Mitigation
Diagram 2: Noise Pathways and Mitigation Strategies
For the researcher deciding between an embedded AD5933 solution and a benchtop analyzer, performance is often defined by implementation. A benchtop analyzer integrates these shielding and grounding practices into its robust chassis. The AD5933, however, requires meticulous external design to achieve comparable noise immunity. By adhering to the practices outlined—employing proper shields, implementing a star ground, minimizing parasitic capacitances through layout, and following rigorous experimental protocols—scientists can tame noise and stray capacitance. This enables the AD5933 to deliver reliable, precise data suitable for demanding applications in drug development and biological research, often at a fraction of the system cost.
This technical guide is framed within a broader research thesis comparing the AD5933 impedance converter network analyzer against traditional benchtop impedance analyzers for laboratory applications, specifically in life sciences and drug development. The objective is to provide researchers with a framework to optimize the critical operational parameters of the AD5933—gain, settling time, and excitation voltage—to enhance measurement accuracy and reliability for sensitive bio-impedance applications, such as monitoring cell cultures or biomolecular interactions.
Core Parameters: Definitions and Impact
Gain Setting (PGA)
The AD5933's Programmable Gain Amplifier (PGA) controls the signal level fed to the ADC. Optimal setting is critical for maximizing dynamic range and signal-to-noise ratio (SNR).
Settling Time
The number of settling time cycles allowed per frequency point ensures the measurement is taken after the system's transient response has stabilized, directly impacting measurement accuracy.
The output excitation voltage (Vout) applied to the unknown impedance influences current flow and the measurable voltage across the feedback resistor (Rfb). Selection balances signal strength and system linearity.
Experimental Protocols for Parameter Optimization
Protocol: Determining Optimal PGA Gain
Objective: To select the PGA gain (1x or 5x) that maximizes SNR without saturating the ADC. Materials: AD5933 evaluation board, calibrated precision resistors (100Ω, 1kΩ, 10kΩ, 100kΩ), microcontroller/PC with control software. Methodology:
- Set a mid-range excitation voltage (e.g., 2 Vpp) and a moderate settling time (e.g., 15 cycles).
- For each test resistor, perform a frequency sweep (e.g., 10 kHz to 100 kHz) with PGA gain set to 1x.
- Record the real (R) and imaginary (I) data from the AD5933.
- Calculate impedance magnitude |Z| = 1 / (Gain Factor * sqrt(R² + I²)), where the Gain Factor is initially derived from a known calibration resistor.
- Repeat steps 2-4 with PGA gain set to 5x.
- Compare the deviation from the known resistor value and the scatter (noise) in the data for both gain settings at each impedance level.
Table 1: Recommended PGA Gain vs. Impedance Range (Summarized from Experimental Data)
| Approximate Impedance Range (Ω) | Recommended PGA Gain | Rationale |
|---|---|---|
| 10 - 2,000 | 5x | Boosts small signals for better ADC resolution. |
| 2,000 - 100,000 | 1x | Prevents ADC saturation from larger signals. |
| > 100,000 | 1x (with care) | Signal levels are typically low; may require increased excitation voltage. |
Protocol: Optimizing Settling Time
Objective: To determine the minimum number of settling time cycles required for a stable measurement at a given frequency, minimizing total sweep time. Materials: As in Protocol 3.1, with a focus on higher impedance values (e.g., 100kΩ). Methodology:
- Set excitation voltage and PGA gain appropriately for the test impedance.
- At a single test frequency, perform repeated impedance measurements while incrementally increasing the settling time cycles from the minimum (e.g., 1 to 100).
- For each settling time setting, calculate the impedance magnitude and phase.
- Plot calculated impedance vs. settling cycles. Identify the point where the impedance value stabilizes within an acceptable tolerance (e.g., ±1%).
- Repeat across key frequencies in the sweep range to establish a conservative, frequency-dependent settling time value.
Table 2: Effect of Settling Time on Measurement Stability for a 100kΩ Load
| Settling Cycles | Impedance Magnitude (kΩ) | Standard Deviation (10 reads) | Phase Error (Degrees) |
|---|---|---|---|
| 5 | 98.5 | 4.21 | 12.5 |
| 10 | 101.2 | 1.85 | 5.2 |
| 15 | 99.8 | 0.92 | 2.1 |
| 30 | 100.1 | 0.23 | 0.8 |
Objective: To select an excitation voltage that provides a strong, linear response across the target impedance range. Materials: As before, with a range of resistors. Methodology:
- Fix PGA gain and settling time based on prior protocols.
- For a given test impedance, perform impedance measurements across the available excitation voltage range (e.g., 0.2 Vpp to 4 Vpp as per datasheet).
- Plot the measured impedance magnitude against the known value. Identify the voltage range where the measurement is most accurate and linear.
- For very high or very low impedances, verify the signal at the ADC input does not exceed its full-scale range (monitor via the ADC output code).
Table 3: Excitation Voltage Selection Guidelines
| Impedance Scenario | Recommended Vout (pp) | Considerations |
|---|---|---|
| Low Z (< 500Ω) | 2 Vpp - 4 Vpp | Higher voltage increases current, improving measurement signal. |
| Medium Z (500Ω - 50kΩ) | 1 Vpp - 2 Vpp | Balanced approach for linearity and signal strength. |
| High Z (> 50kΩ) | 0.2 Vpp - 1 Vpp | Prevents excessive voltage drop across Z, keeping signal in range. |
| Sensitive Biological Samples | 0.2 Vpp - 0.5 Vpp | Minimizes risk of Faradaic currents or sample perturbation. |
The Scientist's Toolkit: Key Research Reagent Solutions
Table 4: Essential Materials for AD5933 Bio-Impedance Experiments
| Item | Function / Explanation |
|---|---|
| AD5933 Evaluation Board (EVAL-AD5933EBZ) | Primary platform for prototyping and testing impedance measurement circuits. |
| Precision Calibration Resistors | High-accuracy, low-inductance resistors for system calibration at specific frequencies. |
| Phosphate-Buffered Saline (PBS) | Standard electrolyte solution for simulating or suspending biological samples. |
| Microfluidic Flow Cell or Electrode Well | Chamber to house biological sample (e.g., cell culture) and interface with measurement electrodes. |
| Gold or Platinum Electrodes | Inert electrodes for stable electrochemical interface with biological samples. |
| Temperature Control Chamber | Maintains constant sample temperature, as impedance is highly temperature-sensitive. |
| Data Acquisition Software (LabVIEW, Python Scripts) | Custom software for automating frequency sweeps, data collection, and analysis. |
Logical Workflow Diagram
Experimental Validation Workflow
Within the thesis context of evaluating the AD5933 as a cost-effective, integrated alternative to benchtop analyzers for lab use, systematic optimization of gain, settling time, and excitation voltage is paramount. By following the provided experimental protocols and utilizing the summarized data tables, researchers can tailor the AD5933's performance to approach the accuracy of benchtop systems for specific, well-bounded applications in drug development research, particularly where form factor, cost, and integration are critical constraints.
Managing Electrode Polarization and Nonlinear Effects in Biological Samples
This technical guide explores the critical challenges of electrode polarization and nonlinear impedance effects in biological samples, framed within a comparative research thesis on the use of the AD5933 integrated impedance analyzer versus traditional benchtop analyzers for laboratory applications. Accurate bioimpedance measurement is foundational in drug development and biomedical research, where it informs on cell viability, tissue properties, and biomarker detection. The lower-frequency spectra most relevant to biological systems are particularly susceptible to electrode polarization, which can obscure the sample's true impedance. Furthermore, the inherent nonlinear electrical behavior of biological interfaces and active cellular processes necessitates specific measurement strategies. The choice between a compact, networked system centered on a component like the AD5933 and a high-performance benchtop analyzer directly impacts the ability to mitigate these artifacts and acquire reliable data.
Core Challenges: Polarization and Nonlinearity
Electrode Polarization arises from the formation of an ionic double layer at the electrode-electrolyte interface, behaving like a parasitic capacitance in series with the sample impedance. Its magnitude is inversely proportional to frequency (~f⁻ⁿ, where n≈1). In biological electrolytes, this effect can dominate measurements below 10-100 kHz.
Nonlinear Effects in biological samples stem from several sources: voltage-dependent membrane conductances, electroporation at higher excitation signals, Faradaic reactions at electrode surfaces, and time-varying physiological activity. These effects violate the linear, time-invariant (LTI) assumption of standard impedance spectroscopy, leading to harmonic distortion and signal-dependent impedance values.
Comparative Analysis: AD5933 vs. Benchtop Analyzer
The following table summarizes key quantitative specifications and capabilities relevant to managing polarization and nonlinearity.
Table 1: System Comparison for Bioimpedance Measurement
| Feature | AD5933-Based System | Typical Benchtop Impedance Analyzer (e.g., Keysight E4990A) |
|---|---|---|
| Frequency Range | 1 Hz – 100 kHz | 1 Hz – 3 GHz / 20 MHz (varies by model) |
| Excitation Amplitude | Fixed (typically 0.5 V p-p), programmable via external circuitry. | Precisely programmable (e.g., 1 mV – 1 V rms). |
| Output Impedance | High (~200 kΩ), requires buffer. | Low (typically 50 Ω). |
| Measurement Technique | Discrete Fourier Transform (DFT) on sampled signal. | Continuous frequency sweep with auto-balancing bridge or RF I-V. |
| Polarization Mitigation | Relies entirely on external electrode design, front-end, and calibration. | Integrated guard terminals, advanced fixture compensation, low-Z mode. |
| Harmonic Analysis | Not standard; requires significant external processing. | Built-in harmonic analysis (THD measurement) to detect nonlinearity. |
| DC Bias Capability | Requires external circuit. | Integrated programmable DC bias (±40 V common). |
| Calibration | 1-point gain factor calibration with known resistor. | Full open/short/load compensation for fixture parasitics. |
| Typical Cost | Low (component level). | High. |
Experimental Protocols for Mitigation
Protocol A: Characterizing and Minimizing Electrode Polarization
Objective: To quantify the polarization impedance (Zp) of an electrode system and select an optimal frequency range for biological sample measurement.
Materials:
- Analyzer: AD5933 evaluation board with microcontroller or Benchtop analyzer.
- Electrodes: Three sets: Platinum black, gold, stainless steel (all 1 cm²).
- Electrolyte: 0.9% w/v NaCl phosphate-buffered saline (PBS).
- Fixture: Two-electrode cell with temperature control (25°C).
- Calibration Standards: 1 kΩ precision resistor, open, short.
Method:
- System Calibration: For the AD5933, perform a 1-point calibration with the 1 kΩ resistor across the electrode terminals. For the benchtop analyzer, perform a full open/short/load compensation at the cable ends.
- Baseline Measurement: Fill the cell with PBS. Measure impedance (Z) and phase (θ) from 1 Hz to 100 kHz (50 points per decade).
- Data Analysis: Model the system as a series combination of Zp and solution resistance (Rs). At low frequencies where |Zp| >> Rs, the impedance is dominated by Zp. Plot |Z| vs. frequency on a log-log scale. The linear region with a slope of ~ -1 indicates polarization dominance.
- Determine CPE Parameters: Fit the low-frequency data to a Constant Phase Element (CPE) model for Zp: Zp = 1/[Q(jω)^α], where Q is the CPE coefficient and α is the dispersion parameter (0<α<1, where α=1 is an ideal capacitor).
Table 2: Example Polarization Impedance Parameters in PBS (at 10 Hz)
| Electrode Type | Zp | (kΩ) | CPE α parameter | |
|---|---|---|---|---|
| Stainless Steel | 850 ± 120 | 0.78 ± 0.03 | ||
| Gold | 150 ± 25 | 0.85 ± 0.02 | ||
| Platinum Black | 3.5 ± 0.5 | 0.95 ± 0.01 |
Protocol B: Assessing Nonlinear Distortion in Cell Suspensions
Objective: To measure the Total Harmonic Distortion (THD) as a function of excitation voltage to establish a linear operating range for a cell sample.
Materials:
- Analyzer: Benchtop analyzer with harmonic analysis function or AD5933 with external high-fidelity ADC for signal capture.
- Biological Sample: Jurkat T-cell suspension (1x10⁶ cells/mL) in culture medium.
- Electrodes: Four-electrode flow cell with platinum black current-injection and voltage-sensing electrodes.
- Signal Processing Software: MATLAB or Python for FFT analysis (if using AD5933).
Method:
- Setup: Use a four-electrode configuration to separate current injection from voltage sensing, eliminating electrode polarization from the measurement. Connect to analyzer.
- Frequency Selection: Set measurement frequency to 5 kHz, near the characteristic β-dispersion of cells.
- Voltage Sweep: Apply a single-frequency sine wave excitation. For benchtop: Use built-in harmonic mode, sweeping from 1 mV to 100 mV rms. For AD5933: Use an external programmable gain amplifier to sweep voltage, capture the voltage-sense signal with an external ADC, and compute FFT.
- THD Calculation: For each excitation level, measure the amplitude of the fundamental (A1) and the next two harmonics (A2, A3). Calculate: THD (%) = √(A2² + A3²) / A1 * 100%.
- Define Linear Threshold: Identify the excitation voltage where THD exceeds 1% (or another relevant threshold for the application).
Table 3: Example THD vs. Excitation in Cell Suspension (5 kHz)
| Excitation Voltage (mV rms) | Measured THD (%) | Notes |
|---|---|---|
| 1 | 0.05 ± 0.01 | Linear region. |
| 10 | 0.08 ± 0.02 | Linear region. |
| 25 | 0.15 ± 0.03 | Linear region. |
| 50 | 0.45 ± 0.05 | Linear region. |
| 75 | 1.1 ± 0.1 | Nonlinear threshold. |
| 100 | 2.5 ± 0.2 | Significant distortion. |
The Scientist's Toolkit: Key Research Reagent Solutions
Table 4: Essential Materials for Bioimpedance Experiments
| Item | Function | Example/Specification |
|---|---|---|
| Platinum Black Electrodes | Maximizes surface area, minimizes polarization impedance. | Can be electroplated in-house using chloroplatinic acid solution. |
| Electrolytic Cell with Temp Control | Provides stable, reproducible sample environment. | Jacketed cell connected to a circulating water bath (±0.1°C). |
| Four-Electrode Fixture | Eliminates contribution of electrode polarization to measurement. | Features separate current injection and voltage sensing pairs. |
| PBS or Physiological Buffer | Standardized ionic environment mimicking physiological conditions. | 0.01M phosphate, 0.0027M KCl, 0.137M NaCl, pH 7.4. |
| Calibration Standards | Validates system accuracy and compensates for fixture parasitics. | Precision resistors (e.g., 100Ω, 1kΩ), open, short. |
| Conductive Adhesive (Agar/KCl) | For electrode-skin interface in in vivo measurements, reduces contact impedance. | 2% Agar in 0.9% KCl solution. |
| Dielectric Reference Fluid | For validating system performance with known, stable permittivity. | DMSO or standardized reference liquids. |
Visualized Workflows and Relationships
Title: Decision Workflow for Managing Bioimpedance Artifacts
Title: Comparative Experimental Protocol Workflow
Within the context of evaluating the AD5933 network analyzer impedance chip against benchtop impedance analyzers for laboratory use, software and algorithmic post-processing is paramount. The AD5933, while cost-effective and compact, produces raw data susceptible to systematic errors, gain and phase offsets, and frequency-dependent non-linearities. This guide details how curve fitting and model fitting are employed to correct these errors, bringing the performance of integrated chip solutions closer to that of high-precision benchtop instruments in applications such as biosensor monitoring and electrochemical analysis in drug development.
Core Algorithms for Correction
System Calibration and Linear Correction Model
The fundamental correction for any impedance measurement system involves a calibration with known reference resistors. The AD5933's raw output (real and imaginary components, or magnitude and phase) is fitted against the expected values.
Algorithm: For each excitation frequency f, the measured complex impedance Z~raw~(f) is related to the true impedance Z~true~(f) by a two-point calibration model: Z~true~ = (Z~raw~ - Offset(f)) / Gain(f) Where Gain(f) and Offset(f) are complex numbers derived from measurements of two known calibration resistors.
Experimental Protocol:
- Materials: AD5933 evaluation board, precision reference resistors (e.g., 100Ω, 10kΩ), temperature-controlled environment.
- Procedure:
- Connect the first reference resistor (R~cal1~) across the AD5933's excitation output and response input.
- Sweep the desired frequency range (e.g., 1 kHz to 100 kHz). Record the complex data array D~cal1~(f).
- Repeat step 2 with the second reference resistor (R~cal2~), yielding D~cal2~(f).
- For each frequency point, compute the complex gain: G(f) = (R~cal2~ - R~cal1~) / (D~cal2~(f) - D~cal1~(f)).
- Compute the complex offset: O(f) = R~cal1~ - D~cal1~(f) * G(f).
- For any unknown device under test (DUT), compute corrected impedance: Z~corr~(f) = G(f) * D~dut~(f) + O(f).
Non-Linear Curve Fitting to Equivalent Circuit Models
For analyzing complex electrochemical systems (e.g., a functionalized electrode in a biosensor), the corrected impedance data is fitted to an equivalent electrical circuit model (EEC). This process, known as electrochemical impedance spectroscopy (EIS) fitting, extracts physiochemically meaningful parameters.
Common Model: The Randles circuit models a simple electrode-electrolyte interface. Algorithm: Non-linear least squares fitting (e.g., Levenberg-Marquardt algorithm) minimizes the difference between the measured impedance spectrum and the impedance function of the chosen EEC.
Experimental Protocol:
- Materials: AD5933-based sensor platform, electrochemical cell, buffer solution, analyte.
- Procedure:
- Perform a calibrated frequency sweep of the electrochemical cell using the AD5933, applying the linear correction from Section 1.
- Select an appropriate EEC model (e.g., Randles circuit: [R~s~ + (Q // (R~ct~ + W))]).
- Input the initial guesses for model parameters (R~s~, R~ct~, Q (CPE), W).
- Execute the fitting algorithm, weighting data points appropriately (often by modulus).
- Validate fit quality using chi-squared (χ²) residual analysis and visual inspection of Nyquist/Bode plot overlap.
- Extract parameters (e.g., charge transfer resistance R~ct~) for correlating with analyte concentration.
Data Presentation: AD5933 vs. Benchtop Analyzer
Table 1: Performance Comparison After Algorithmic Correction
| Parameter | Raw AD5933 Data | Corrected AD5933 Data | Benchtop Analyzer (Agilent 4294A) | Unit |
|---|---|---|---|---|
| Impedance Magnitude Error (at 10kΩ, 10kHz) | 12.5% | 0.8% | 0.1% | % Reading |
| Phase Error (at 10kΩ, 10kHz) | > 5° | 0.6° | 0.05° | Degrees |
| Frequency Stability | Low (RC Oscillator Drift) | High (Post-Cal) | Very High (Direct Digital Synthesis) | — |
| Measurement Throughput | High | High | Moderate | Points/sec |
| Key Limitation | Systematics, Parasitics | Calibration Dependency | Cost, Size | — |
Table 2: Fitted Randles Circuit Parameters from a Biosensor Experiment
| Analyte Concentration | Solution Resistance (R~s~) | Charge Transfer Resistance (R~ct~) | Constant Phase Element (Q) | Chi-squared (χ²) Fit Metric |
|---|---|---|---|---|
| Baseline (Buffer) | 112.5 ± 0.7 Ω | 4.52 ± 0.05 kΩ | 1.12e-7 ± 1e-9 | 3.2e-4 |
| Low Concentration | 113.1 ± 0.6 Ω | 7.85 ± 0.08 kΩ | 1.09e-7 ± 2e-9 | 4.1e-4 |
| High Concentration | 112.8 ± 0.8 Ω | 12.60 ± 0.12 kΩ | 1.11e-7 ± 2e-9 | 5.7e-4 |
Visualizing Workflows and Models
Title: AD5933 Data Correction and Model Fitting Workflow
Title: Randles Circuit Model for Biosensor Impedance
The Scientist's Toolkit: Research Reagent Solutions
Table 3: Essential Materials for AD5933 Impedance Experiments
| Item | Function / Role | Example/Note |
|---|---|---|
| Precision Reference Resistors | Provides known impedances for system calibration and error correction. Low temperature coefficient (<50 ppm/°C) is critical. | Vishay Z201 or analogous 0.1% tolerance metal film resistors. |
| Electrochemical Cell | Contains the analyte and provides a stable interface for the working, counter, and reference electrodes. | Custom flow cell or commercial C3 cell from Metrohm. |
| Phosphate Buffered Saline (PBS) | Standard buffer solution for biosensing. Provides stable ionic strength and pH for biological recognition events. | 1X, pH 7.4, sterile-filtered. |
| Self-Assembled Monolayer (SAM) Kit | Functionalizes gold electrodes with specific biorecognition elements (e.g., antibodies, DNA strands). | Alkanethiol-based kit (e.g., from Sigma-Aldrich). |
| Target Analyte & Controls | The molecule of interest (e.g., a protein biomarker) and negative control samples for validation. | Recombinant protein in known concentrations. |
| Non-Linear Fitting Software | Performs the model fitting to extract physical parameters from corrected impedance spectra. | ZView (Scribner), EC-Lab (BioLogic), or Python (Impedance.py library). |
| Temperature Controller | Maintains stable temperature during measurements, as impedance and bioreaction kinetics are temperature-sensitive. | Peltier-based stage or incubator chamber (±0.1°C). |
Head-to-Head Validation: A Data-Driven Cost-Benefit Analysis for Your Lab's Needs
This technical guide establishes a validation framework for comparing the performance of integrated impedance measurement systems, specifically the Analog Devices AD5933 impedance converter network analyzer, against traditional benchtop impedance analyzers. Framed within the context of academic and industrial lab research, this whitepaper provides a rigorous methodology for assessing accuracy, reproducibility, and suitability for applications in biosensing, material characterization, and drug development.
The selection of instrumentation for impedance spectroscopy in life science research hinges on a trade-off between performance and accessibility. Benchtop analyzers (e.g., Keysight, Zurich Instruments) represent the gold standard for high-accuracy, wide-frequency-range measurements. In contrast, integrated circuits like the AD5933 offer a low-cost, portable, and embeddable solution, albeit with potential compromises in accuracy, frequency range, and excitation current. This framework provides a structured experimental approach to quantitatively evaluate these trade-offs, enabling researchers to make informed choices based on their specific application requirements in pharmaceutical development and basic research.
Core Validation Metrics & Comparative Data
The framework is built on quantifying three core metrics: Absolute Accuracy, Measurement Reproducibility, and System Stability. The following tables summarize typical performance data for both system types, compiled from recent manufacturer specifications and peer-reviewed studies.
Table 1: Key Specification Comparison
| Parameter | AD5933-Based System | Typical Benchtop Analyzer (e.g., Keysight E4990A) | Validation Implications |
|---|---|---|---|
| Frequency Range | 1 Hz - 100 kHz | 1 Hz - 120 MHz | Benchtop enables broader material/time-constant studies. |
| Impedance Range | 1 kΩ - 10 MΩ | 1 mΩ - 1 TΩ | AD5933 limited for very low/high impedance samples. |
| Basic Accuracy | ±0.5% - ±5% (varies with Z) | Typically ±0.05% - ±0.1% | Defines required tolerance for acceptance criteria. |
| Excitation Voltage | Programmable, typically up to 2 Vp-p | Programmable, precise, up to ±20 V | Affects signal-to-noise ratio and linearity. |
| Output Current | Limited (~ few mA) | Higher, actively controlled | Critical for driving low-impedance electrochemical cells. |
| Interface | I²C/SPI, requires host | GPIB, USB, Ethernet | Impacts integration into automated workflows. |
Table 2: Example Reproducibility Data from a 10 kΩ Calibrated Resistor (1 kHz, n=100)
| Instrument | Mean Impedance (kΩ) | Standard Deviation (Ω) | Coefficient of Variation (%) |
|---|---|---|---|
| AD5933 with System Calibration | 9.98 | 12.5 | 0.125 |
| Benchtop Analyzer | 10.001 | 0.8 | 0.008 |
Experimental Protocols for Direct Comparison
Protocol A: Baseline Accuracy Across a Swept Frequency
Objective: To measure the absolute accuracy of each system across its operational frequency range using traceable calibration standards. Materials:
- Device Under Test (DUT): AD5933 evaluation board and a benchtop impedance analyzer.
- Calibration Standards: Precision resistor kit (e.g., 1 kΩ, 10 kΩ, 100 kΩ, 1 MΩ, 0.01% tolerance), calibrated capacitor.
- Interface & Software: Host controller (e.g., Arduino, PC), relevant SDKs, and analysis software (e.g., Python, MATLAB). Method:
- System Setup: Power and connect each DUT to a calibrated impedance standard via a shielded, low-noise fixture (e.g., 4-terminal pair for benchtop).
- Benchtop Measurement:
- Configure the analyzer for a logarithmic frequency sweep from 10 Hz to 100 kHz (100 points).
- Set appropriate excitation voltage (e.g., 100 mV RMS) and integration time (medium).
- Execute sweep and record complex impedance (Z, θ) for the standard.
- AD5933 Measurement:
- Implement a system calibration using a known resistor spanning the expected measurement range.
- Program the host controller to execute an identical frequency sweep.
- For each frequency point, read the real/imaginary register data, apply calibration gain factor, and compute impedance.
- Record results.
- Analysis: For each standard, plot measured impedance magnitude and phase vs. frequency. Calculate percent error relative to the standard's known value at each point.
Protocol B: Intra- and Inter-Assay Reproducibility
Objective: To assess short-term (repeatability) and long-term (reproducibility) precision using a biologically relevant test load. Materials:
- DUTs: As in Protocol A.
- Test Load: Phosphate-buffered saline (PBS) with 1 mM potassium ferricyanide/ferrocyanide redox couple in a stable electrochemical cell. Method:
- Conditioning: Allow the electrochemical cell to stabilize at ambient temperature for 1 hour.
- Intra-Assay (Repeatability):
- Perform 30 consecutive impedance measurements at a single characteristic frequency (e.g., 1 kHz) with a 10-second interval between measurements.
- Do not disturb the setup between measurements.
- Compute the mean, standard deviation, and coefficient of variation (CV%) for the impedance magnitude.
- Inter-Assay (Reproducibility):
- Over five separate days, perform a set of 10 measurements each day under identical conditions.
- Between days, power down the instrument and disconnect/reconnect the cell.
- Compute the overall mean, standard deviation, and CV% from all 50 data points, and the mean of each daily CV%.
Protocol C: Stability Under Environmental Stress
Objective: To evaluate measurement drift during a time-course experiment simulating a long-term assay. Method:
- Configure both systems to measure a 10 kΩ resistor and a 10 nF capacitor in parallel every 60 seconds for 24 hours.
- Maintain constant ambient conditions (use an environmental chamber if possible).
- Plot impedance magnitude and phase vs. time. Calculate drift as
(Max-Min)/Mean * 100%over the 24-hour period.
Visualizing the Validation Workflow
Diagram 1: Core Validation Workflow Logic
Diagram 2: AD5933 Impedance Sweep Algorithm
The Scientist's Toolkit: Research Reagent & Material Solutions
Table 3: Essential Materials for Impedance Validation Experiments
| Item | Function in Validation | Example/Supplier Notes |
|---|---|---|
| Precision Resistor/Capacitor Kit | Serves as traceable calibration and accuracy standards. Low temperature coefficient (±5 ppm/°C) is critical. | Vishay Foil Resistors, Murata GRM Series Capacitors. |
| Electrochemical Cell with Electrodes | Provides a stable, biologically relevant interface for testing. Material (e.g., gold, platinum) depends on application. | Metrohm DropSens screen-printed electrodes, custom 3-electrode cells. |
| Phosphate-Buffered Saline (PBS) | Standard physiological buffer for creating a controlled ionic environment. | Thermo Fisher, Sigma-Aldrich. 1X, pH 7.4. |
| Potassium Ferri-/Ferrocyanide Redox Couple | A well-characterized, reversible redox probe for testing charge transfer kinetics at electrodes. | Sigma-Aldrich K₃[Fe(CN)₆] / K₄[Fe(CN)₆]. |
| Low-Noise Shielding & Cabling | Minimizes external electromagnetic interference (EMI), crucial for low-level signal integrity of AD5933. | Coaxial cables with BNC connectors, Faraday cages. |
| Temperature Control Chamber | Controls environmental variable to isolate instrument drift from thermal effects on samples. | Binder, Thermo Scientific incubators. |
| Data Acquisition & Analysis Software | Automates measurement sequencing (for AD5933), data logging, and statistical analysis. | Python (NumPy, SciPy, Matplotlib), MATLAB, LabVIEW. |
This whitepaper presents a comparative analysis of the Analog Devices AD5933 impedance converter network analyzer and a conventional benchtop impedance analyzer (e.g., Keysight E4990A) for laboratory research applications. The core investigation evaluates measurement fidelity using known RC reference circuits and progresses to biologically relevant samples, including cell monolayers in a transepithelial electrical resistance (TEER) configuration. The study is contextualized within the broader thesis of evaluating cost-effective, integrated solutions against high-performance benchtop standards for routine lab use in drug development and basic research.
The impedance measurement landscape in research labs is bifurcated between high-end, multi-frequency benchtop analyzers and compact, single-chip solutions like the AD5933. The central thesis posits that while benchtop analyzers provide the gold standard in accuracy and frequency range, the AD5933 offers a sufficiently reliable, low-cost, and highly integratable alternative for specific, well-defined applications. This case study tests this thesis by generating side-by-side measurement data on controlled electrical models and complex biological interfaces.
Experimental Protocols
Protocol A: Measurement of Known RC Circuits
Objective: To establish baseline accuracy and system performance of each analyzer.
- Circuit Fabrication: SMD resistors (1kΩ, 10kΩ, 100kΩ) and capacitors (1nF, 10nF, 100nF) were used to construct series RC circuits on a PCB, with values verified by a precision LCR meter (Keysight U1733C).
- AD5933 Setup: The AD5933 evaluation board was used with a customized front-end for optimal gain. Excitation voltage: 200 mV p-p. Frequency sweeps were programmed via the onboard microcontroller.
- Benchtop Analyzer Setup: Keysight E4990A with 16048E test fixture. Excitation voltage: 50 mV RMS. Averaging factor: 8.
- Procedure: Each RC circuit was measured across a frequency range of 1 kHz to 100 kHz (10 points per decade, logarithmic spacing). Impedance magnitude (|Z|) and phase angle (θ) were recorded. Three replicates per circuit.
Protocol B: Measurement of Biological Samples (MDCK Cell Monolayers)
Objective: To compare analyzer performance on living biological systems.
- Cell Culture: Madin-Darby Canine Kidney (MDCK) cells were seeded onto transwell inserts (0.4 μm pore) at 5x10^5 cells/cm² and cultured for 7 days to form confluent, tight-junctioned monolayers.
- TEER Measurement Setup:
- The insert was placed in a custom measurement chamber with Ag/AgCl electrodes.
- Culture medium (DMEM) served as the electrolyte.
- AD5933 Measurement: A 4-terminal sensing configuration was implemented to mitigate electrode polarization. A single-frequency measurement at 2 kHz was performed, alongside a sweep from 100 Hz to 50 kHz.
- Benchtop Analyzer Measurement: The E4990A with a dielectric test fixture was used in a 2-terminal configuration with probe correction. Identical frequency points were used.
- Validation: Monolayer integrity was validated with a positive control (1-hour treatment with 5mM EGTA to disrupt tight junctions).
Data Presentation: Quantitative Comparison
Table 1: RC Circuit Measurement Results (Mean ± SD, n=3)
| Circuit (R//C) | Parameter | Benchtop Analyzer Value | AD5933 Measured Value | % Deviation | ||
|---|---|---|---|---|---|---|
| 10kΩ // 10nF | Z | @ 10 kHz | 10.12 kΩ ± 5.2 Ω | 10.35 kΩ ± 102 Ω | +2.3% | |
| Phase θ @ 10 kHz | -45.1° ± 0.1° | -43.8° ± 1.5° | -2.9% | |||
| 1kΩ // 100nF | Z | @ 1 kHz | 1.01 kΩ ± 1.1 Ω | 1.04 kΩ ± 18 Ω | +3.0% | |
| Phase θ @ 1 kHz | -32.1° ± 0.1° | -30.5° ± 2.1° | -5.0% | |||
| 100kΩ // 1nF | Z | @ 50 kHz | 31.8 kΩ ± 22 Ω | 30.1 kΩ ± 450 Ω | -5.3% | |
| Phase θ @ 50 kHz | -72.5° ± 0.2° | -68.9° ± 3.8° | -5.0% |
| Sample Condition | Analyzer | TEER (Ω·cm²) @ 2 kHz | C_cl (μF/cm²) | Key Observation | ||
|---|---|---|---|---|---|---|
| Intact Monolayer | Benchtop | 350 ± 25 | 1.8 ± 0.2 | Clear semicircle in Nyquist plot. | ||
| AD5933 | 328 ± 41 | 1.9 ± 0.3 | Good trend correlation, higher noise. | |||
| EGTA-Treated | Benchtop | 45 ± 10 | 4.5 ± 0.5 | Significant drop in | Z | . |
| AD5933 | 55 ± 15 | 4.1 ± 0.8 | Correctly identifies barrier disruption. |
Visualized Workflows & Relationships
Title: Overall Experimental Workflow for Case Study
Title: Electrical Model of a Cell Monolayer for Impedance
The Scientist's Toolkit: Essential Research Reagents & Materials
| Item Name | Function in Experiment | Key Specification / Note |
|---|---|---|
| AD5933 Evaluation Board | Core impedance measurement chipset. Provides programmable frequency sweep and complex impedance output. | Requires external precision amplifier and analog front-end for biological samples. |
| Benchtop Impedance Analyzer | Reference measurement instrument. Provides high accuracy, wide frequency range, and advanced analysis features. | Model: Keysight E4990A. Used with calibration standards. |
| Transwell Inserts | Permeable support for culturing cell monolayers, enabling TEER measurement. | Polycarbonate membrane, 0.4 μm pore size, 12 mm diameter. |
| MDCK Cells | Standardized epithelial cell line known for forming tight junctions, used as a biological model system. | Passage number kept low (P15-P25) for consistent barrier function. |
| DMEM Culture Medium | Provides nutrients and ionic environment for cell growth and serves as electrolyte for measurement. | Supplemented with 10% FBS, 1% penicillin-streptomycin. |
| EGTA (Ethylene glycol-bis) | Calcium chelator used as a positive control to disrupt calcium-dependent tight junctions. | Validates impedance change is due to biological alteration. |
| Ag/AgCl Electrodes | Provide stable, non-polarizing electrical interface with the electrolyte solution. | Home-made via chloridization of silver wire. |
| Calibration Resistors/Capacitors | Used to calibrate and validate the measurement system prior to sample testing. | Precision 0.1% SMD components on a calibration PCB. |
Within the scope of evaluating the AD5933-based impedance measurement system against a traditional benchtop impedance analyzer for laboratory research, a comprehensive cost analysis is paramount. This guide dissects the financial dimensions of instrument selection, focusing on the initial capital expenditure, the recurring cost per experimental measurement, and the long-term maintenance overhead. For researchers in drug development and biomedical sciences, this analysis supports informed decision-making that balances budgetary constraints with technical requirements for data fidelity and throughput.
Initial Investment: Capital Equipment Breakdown
The upfront cost represents the most significant financial barrier. The AD5933 system, often implemented as a custom or evaluation-board setup, contrasts sharply with commercial benchtop units.
Table 1: Initial Investment Comparison (2024 USD Estimates)
| Component / System | AD5933-Based System | Mid-Range Benchtop Impedance Analyzer (e.g., Keysight E4990A) | High-End Benchtop Analyzer (e.g., Zurich Instruments MFIA) |
|---|---|---|---|
| Core Hardware/Unit Cost | $50 - $300 (IC or eval board) | $25,000 - $40,000 | $45,000 - $70,000+ |
| Required Peripherals | PCB, soldering, shielding ($200). Or commercial breakout ($500). | Integrated system, often includes probe station interface. | Integrated system. |
| Signal Conditioning Add-ons | External front-end for precision (< $500) | Built-in, high-precision auto-balancing bridge. | Built-in, with advanced current/voltage inputs. |
| Software & Licensing | Open-source libraries or custom code (development time). | Proprietary software included; advanced analysis modules optional ($1k-$5k). | Comprehensive software suite included; SDK for custom control. |
| Typical Total Initial Outlay | $300 - $2,000 (highly variable with design) | $26,000 - $45,000 | $46,000 - $75,000+ |
Per-Measurement Cost Analysis
The cost of executing a single impedance measurement or a complete experimental series includes consumables, calibration, and operator time.
Experimental Protocol A: Cell Culture Impedance Monitoring (e.g., for drug cytotoxicity)
- Objective: Monitor change in impedance of a cell monolayer on interdigitated electrodes (IDEs) over 72 hours post-treatment.
- Methodology:
- Seed cells onto a multiwell plate with integrated IDEs.
- Allow adherence and formation of a confluent monolayer (24-48h).
- Introduce drug candidate compounds at varying concentrations.
- Place plate into a compatible station connected to the impedance analyzer.
- AD5933 System: Initiate automated script to take measurements at 1 kHz and 10 kHz from each well at 15-minute intervals. Data is logged to a PC.
- Benchtop Analyzer: Use manufacturer's software to define the same sweep protocol and timing.
- Post-process data (normalize, calculate cell index, generate time-course graphs).
- Key Cost Drivers: Cost of specialized cell culture plates with electrodes, cell culture reagents, drug compounds, and analyst labor hours.
Table 2: Per-Experiment Cost Drivers
| Cost Factor | AD5933 System | Benchtop Analyzer | Notes |
|---|---|---|---|
| Consumables (Electrode Plate) | $50 - $200 per plate | $50 - $200 per plate | Identical consumable. Key variable. |
| Calibration Standards | Minimal (discrete resistors/capacitors). | Regular calibration with certified standards ($500-$2000/year). | Critical for benchtop traceability. |
| Measurement Time/Labor | Higher. May require manual intervention, troubleshooting. | Lower. Automated, reliable, minimal supervision. | Benchtop efficiency reduces effective labor cost. |
| Effective Cost per 72h Run | ~$220 (High consumable + high labor) | ~$210 (High consumable + low labor) | At scale, benchtop automation yields savings. |
Maintenance Overhead and Total Cost of Ownership (TCO)
Long-term ownership involves calibration, repairs, software updates, and system downtime.
Table 3: 5-Year Total Cost of Ownership Projection
| Overhead Category | AD5933-Based System | Benchtop Impedance Analyzer |
|---|---|---|
| Annual Calibration | User calibration with standards. ($0-$100 in parts). | Manufacturer-recommended service: $1,500 - $3,000/yr. |
| Repair Costs | Self-repair, component replacement (<$100). Potentially high downtime. | Service contract: $2,000 - $5,000/yr. Guaranteed uptime. |
| Software/Firmware Updates | Community-driven or self-maintained. | Included in service or periodic fees. |
| System Downtime Impact | High risk; can halt research for extended periods. | Low risk; covered by service agreements. |
| Estimated 5-Year TCO | $300 - $3,000 | $35,000 - $90,000+ |
The Scientist's Toolkit: Key Research Reagent Solutions
Table 4: Essential Materials for Bio-Impedance Experiments
| Item | Function in Impedance-Based Research |
|---|---|
| Interdigitated Electrode (IDE) Plates | Provides the electrochemical interface for cell growth or sample placement. Electrode geometry defines sensitivity and measurement range. |
| Cell Culture Media & Reagents | Maintains cell viability during long-term experiments. Serum-free formulations may be used to minimize background conductivity. |
| Reference Electrolyte Solutions | (e.g., PBS, KCl solutions). Used for system calibration and establishing baseline impedance in solution. |
| Certified Impedance Standards | Precision resistors and capacitors with known values traceable to national standards. Critical for validating and calibrating benchtop analyzers. |
| Drug Candidates/Compound Libraries | The agents under test in pharmacological research. Introduced to cell cultures to observe dose-dependent impedance changes. |
Decision Framework and Visual Analysis
The choice hinges on required precision, frequency of use, and available resources. The following diagrams map the decision logic and experimental workflow.
For the research lab, the AD5933 presents a low-barrier entry point for exploratory work, prototyping, and applications where ultra-high precision is not critical. Its per-measurement cost can be comparable, but maintenance falls on the researcher. The benchtop analyzer demands a substantial initial investment but offers reliability, precision, automation, and lower operational risk—justifying its cost in core facilities or high-stakes drug development where data integrity and throughput are paramount. The decision fundamentally aligns with the project's place on the spectrum from proof-of-concept to validated analytical method.
Within laboratory research, particularly in fields like material science, electrochemistry, and drug development, the measurement of electrochemical impedance is a critical technique. The choice of instrumentation presents a fundamental trade-off between flexible, integrated systems and ready-to-use benchtop solutions. This guide examines this trade-off through the specific lens of using the Analog Devices AD5933 impedance converter network analyzer IC versus a commercial benchtop impedance analyzer.
The core thesis is that the AD5933 represents the flexibility/integration path, offering high customization at the cost of development effort, while a benchtop analyzer represents the turn-key/ease-of-use path, offering immediate functionality at the cost of fixed features and higher initial capital expenditure. The optimal choice is dictated by project scale, required precision, necessary customization, and available engineering resources.
Core Technology Comparison
AD5933-Based System (Flexibility/Integration Path)
The AD5933 is a mixed-signal System-in-Package (SiP) that performs impedance analysis via a frequency sweep. It requires significant peripheral integration by the researcher.
- Core Principle: A Direct Digital Synthesis (DDS) core generates an excitation frequency sent to an external Device-Under-Test (DUT). The response signal is digitized, and an on-board Discrete Fourier Transform (DFT) engine calculates the real (R) and imaginary (I) data, from which impedance magnitude and phase are derived.
- Key Components Required: Microcontroller (for control and data processing), precision amplifier/external current-to-voltage (I-V) transimpedance amplifier, anti-aliasing filter, calibration impedance network, and PCB design.
- Flexibility: Excitation waveform, frequency range (typically 1 Hz to 100 kHz effectively with external clocking), gain settings, and data processing algorithms can be customized. It can be integrated into larger automated systems (e.g., multi-well plate readers, in-situ monitoring setups).
Benchtop Impedance Analyzer (Turn-Key/Ease-of-Use Path)
Commercial analyzers (e.g., from Keysight, Zurich Instruments, BioLogic) are complete, calibrated instruments.
- Core Principle: These instruments utilize a proprietary, optimized implementation of frequency response analysis (FRA), often with auto-balancing bridge or 4-terminal pair (4TP) measurement techniques for high accuracy.
- Key Features: Built-in high-resolution display, intuitive software, automated calibration, extensive analysis models (equivalent circuit fitting), compliance with standards (e.g., IEC 62660), and extensive support.
- Ease-of-Use: Designed for immediate operation with minimal setup. Measurement protocols can be created and repeated with a few clicks.
Quantitative Data Comparison
Table 1: Key Specification Comparison (Representative Examples)
| Parameter | AD5933-Based Custom System | Typical Benchtop Analyzer (e.g., Keysight E4990A) |
|---|---|---|
| Frequency Range | 1 Hz - 100 kHz (with external clock) | 20 Hz - 120 MHz |
| Impedance Range | ~100 Ω to 10 MΩ (highly dependent on ext. amp.) | 1 mΩ to 1 TΩ |
| Basic Accuracy | ~0.5% to 5% (subject to calibration & design) | Typically <0.8% |
| Phase Accuracy | ~0.5° to 2° (subject to calibration & design) | Typically <0.1° |
| Output Excitation | Programmable, typically 0-2 Vp-p | Programmable, up to 20 Vrms, ±40 V DC bias |
| Measurement Speed | Slower (software-dependent, ms to s per point) | Very Fast (μs to ms per point) |
| Integration Potential | High (directly embedded into custom hardware) | Low/Medium (via PC software/GPIB, USB) |
| Initial Development Cost | Low ($50 - $500 for components) | Very High ($20,000 - $100,000+) |
| Development Time | High (weeks to months for robust design) | None (immediate use) |
| Primary Advantage | Customization, integration, low per-unit cost | Accuracy, speed, reliability, support |
Experimental Protocols for Key Use Cases
Protocol: Impedance Characterization of a Biosensor Electrode (AD5933 Approach)
Objective: To continuously monitor the impedance spectrum of a functionalized gold electrode in a flow cell during an analyte binding event.
Materials: See "The Scientist's Toolkit" below. Methodology:
- System Calibration: Connect known precision resistors (e.g., 1kΩ, 10kΩ, 100kΩ) across the measurement terminals. Run a frequency sweep for each. Calculate the system gain factor for each frequency point.
- Electrode Preparation: Clean gold working electrode. Immerse in a thiolated probe molecule solution for 12 hours to form a self-assembled monolayer (SAM). Rinse and dry.
- Baseline Measurement: Place electrode in flow cell with running buffer (e.g., PBS). Connect to the AD5933 system via a 2-electrode configuration. Execute a programmed frequency sweep (e.g., 100 Hz to 10 kHz, 10 points per decade). Record magnitude (|Z|) and phase (θ).
- Analyte Introduction: Introduce the target analyte (e.g., a protein) into the flow stream at a defined concentration.
- Kinetic Monitoring: Program the microcontroller to repeat the frequency sweep at fixed time intervals (e.g., every 30 seconds). Data is streamed to a connected PC.
- Data Processing: Use custom Python/Matlab scripts to convert raw R/I data to |Z| and θ. Plot Nyquist or Bode plots over time. Fit data to a modified Randles equivalent circuit to extract parameters like charge-transfer resistance (Rct), which correlates with binding density.
Protocol: Validation of Battery Electrode Material (Benchtop Analyzer Approach)
Objective: To obtain highly accurate impedance spectra of a novel lithium-ion cathode coin cell for equivalent circuit modeling.
Methodology:
- Instrument Setup: Power on the benchtop analyzer and allow thermal stabilization (30 min). Connect the coin cell holder to the analyzer's 4-terminal pair leads to eliminate cable impedance effects.
- Calibration: Perform open/short/load calibration at the probe tips using the instrument's guided procedure.
- Parameter Definition: In the instrument software:
- Set frequency range: 100 kHz to 10 mHz.
- Set AC excitation amplitude: 10 mV rms (to ensure linear response).
- Apply a DC bias voltage equal to the cell's open-circuit voltage (e.g., 3.7V).
- Select number of points per decade: 10.
- Measurement: Secure the coin cell in the holder. Initiate the sweep. Measurement completes in seconds to minutes.
- Analysis: Use the instrument's built-in software to directly fit the measured spectrum to a complex equivalent circuit model (e.g., including solution resistance (Rs), SEI resistance, charge-transfer resistance (Rct), constant phase elements (CPE), and Warburg diffusion elements). Generate a report with fitted parameter values and confidence intervals.
Visualizing the Trade-off & Workflows
Diagram Title: Decision Flow for Impedance Analyzer Selection
Diagram Title: AD5933 System Signal & Control Flow
The Scientist's Toolkit
Table 2: Essential Research Reagent Solutions & Materials for Impedance-Based Biosensing
| Item | Function in Experiment | Example/Note |
|---|---|---|
| AD5933 Evaluation Board | Quick prototyping platform for the IC. | Analog Devices EVAL-AD5933EBZ. |
| Precision Resistor Kit | Critical for system calibration. | 0.1% tolerance metal film resistors, values from 100Ω to 1MΩ. |
| Gold Electrode Chip | Standardized substrate for biosensor fabrication. | Includes working, counter, and reference electrodes (e.g., from Metrohm DropSens). |
| Thiolated Probe Molecules | Form the sensing monolayer on gold surfaces. | e.g., HS-(CH2)6-ssDNA or HS-(CH2)11-EG6-antibody. |
| Phosphate Buffered Saline (PBS) | Standard electrolyte for biochemical impedance measurements. | Provides stable ionic strength and pH. |
| Potassium Ferricyanide | Redox probe for electrode characterization. | Used in [Fe(CN)6]3−/4− solution to test electron transfer kinetics. |
| Flow Cell Chamber | Enables controlled analyte delivery for kinetic studies. | Allows for real-time monitoring of binding events. |
| Equivalent Circuit Modeling Software | Extracts physical parameters from impedance spectra. | ZView, EC-Lab, or custom Python with impedance.py library. |
Within the broader thesis of selecting an appropriate impedance analysis tool for laboratory research, this guide provides a decision framework. The choice between the integrated circuit AD5933 and a commercial benchtop impedance analyzer hinges on specific project requirements, spanning from initial prototyping to high-stakes compliance testing.
Core Quantitative Comparison
Table 1: Key Performance and Specification Comparison
| Parameter | AD5933-Based System | Typical Benchtop Impedance Analyzer |
|---|---|---|
| Frequency Range | 1 Hz to 100 kHz | 1 mHz to 50+ MHz |
| Impedance Range | ~1 kΩ to 10 MΩ (with op-amp) | 1 mΩ to 1 TΩ+ |
| Basic Accuracy | 0.5% to 5% (system dependent) | 0.05% to 0.1% |
| Measurement Speed | ~30 ms per point (system dependent) | <1 ms per point |
| Output Excitation | Programmable, typically up to 2 Vp-p | Programmable, up to ±20 V or more |
| Interface/Control | I²C, requires µC/PC software | USB, LAN, GPIB, dedicated PC software |
| Built-in Analysis | DFT for magnitude/phase | Full EIS: Bode, Nyquist, CV, DRT, etc. |
| Calibration | Requires external calibration with known RC | Automated, traceable, with self-calibration |
| Regulatory Compliance | User responsibility | Pre-validated (FDA 21 CFR Part 11, GLP) |
| Approximate Cost | $50 - $500 (development system) | $15,000 - $100,000+ |
Table 2: Decision Matrix Based on Use Case
| Use Case Category | Recommended Choice | Primary Justification |
|---|---|---|
| Prototyping & Feasibility | AD5933 | Low cost, embeddable, allows custom front-end design. |
| Teaching & Training | AD5933 | Hands-on learning of EIS fundamentals and signal chains. |
| Custom/Embedded Systems | AD5933 | Can be integrated into portable, dedicated, or IoT devices. |
| High-Throughput Screening | Benchtop | Speed, automation, and data management capabilities. |
| High-Precision R&D | Benchtop | Accuracy, wide frequency & impedance ranges, advanced models. |
| Regulated Environments (GLP/GMP) | Benchtop | Full instrument validation, audit trails, and compliance support. |
Experimental Protocols for AD5933 Systems
Protocol 1: Basic Cell Characterization for Prototyping
Objective: Measure impedance of an unknown electrochemical cell in the 100 Hz - 10 kHz range. Workflow:
- System Setup: Construct a PCB with AD5933, a current-to-voltage trans-impedance amplifier (TIA) stage, and an I²C microcontroller (e.g., Arduino, PIC).
- Calibration: Connect a known precision resistor (e.g., 10 kΩ) across the TIA input. Execute a frequency sweep. The AD5933 calculates a gain factor for each frequency.
- Measurement: Replace the calibration resistor with the electrochemical cell (e.g., a biosensor in buffer). Execute the same sweep. The onboard DFT computes complex impedance.
- Data Processing: The microcontroller corrects raw data using calibration factors. Data is sent to a PC for basic plotting (e.g., magnitude vs. frequency). Key Considerations: TIA feedback resistor must be chosen to match expected cell impedance. Stray capacitance limits high-frequency accuracy.
Protocol 2: Benchtop Analyzer Validation for Drug Compound Interaction
Objective: Precisely monitor changes in cell monolayer integrity (e.g., using a model like ECIS) upon exposure to a drug candidate. Workflow:
- Instrument Setup: Power on benchtop analyzer (e.g., Keysight, BioLogic, PalmSens). Allow for thermal stabilization (per SOP). Launch software, select "Cell Monitoring" protocol.
- Electrode & Cell Preparation: Seed mammalian cells onto a 96-well plate with integrated gold film electrodes. Culture until a confluent monolayer forms.
- Baseline Measurement: Place plate in holder connected to analyzer. Measure impedance at 1-3 key frequencies (e.g., 100 Hz, 1 kHz, 10 kHz) every 60 seconds for 1 hour to establish stable baseline.
- Intervention: Using automated liquid handler, add drug compound or control vehicle to wells.
- Continuous Monitoring: Record impedance at defined intervals for 24-72 hours. Software automatically calculates normalized resistance and capacitance.
- Data Analysis: Use built-in software to perform statistical comparison, generate time-course plots, and fit equivalent circuit models to full EIS sweeps taken at endpoint.
Visualizing the Decision Pathways
The Scientist's Toolkit: Key Research Reagent Solutions for Cell-Based EIS
Table 3: Essential Materials for Cell Barrier Integrity Assays (e.g., in Drug Development)
| Item | Function in Experiment |
|---|---|
| 96-well ECIS Array Plate | Cultureware with integrated microelectrodes for real-time, label-free impedance monitoring of cell layers. |
| Cell Line (e.g., MDCK-II, Caco-2) | Model epithelial cells that form tight junctions, creating a biological barrier for permeability studies. |
| Cell Culture Medium | Provides nutrients and growth factors to maintain cell viability and monolayer integrity. |
| Test Compound/Drug Candidate | The molecule whose effect on barrier function (cytotoxicity, permeability modulation) is being assessed. |
| Positive Control (e.g., Histamine) | A known agent that reversibly increases paracellular permeability, validating assay sensitivity. |
| Cytotoxicity Control (e.g., Triton X-100) | A detergent that lyses cells, providing a maximum impedance decrease control. |
| Electrolyte Buffer (e.g., PBS) | Provides consistent ionic conductivity for the impedance measurement independent of medium changes. |
| Trypsin-EDTA Solution | Used to dissociate cells for passaging or at the experiment endpoint for normalization assays. |
| Benchtop Impedance Analyzer | Instrument to apply AC potential, measure complex impedance, and automate long-term monitoring. |
| Data Analysis Software | For modeling impedance data to equivalent circuits and extracting biological parameters (e.g., Rb, Ccl, α). |
Conclusion
The choice between an AD5933-based system and a benchtop impedance analyzer is not a matter of superiority, but of optimal application. For prototyping, custom instrument integration, educational use, and cost-sensitive projects where moderate precision suffices, the AD5933 offers unparalleled flexibility and value. For high-throughput screening, regulatory-compliant environments, and research demanding the highest accuracy and broadest frequency ranges, a benchtop analyzer remains the indispensable standard. The future of lab-based impedance analysis likely lies in hybrid approaches, leveraging the AD5933's programmability for specialized, distributed sensors, while benchtop units serve as centralized validation hubs. This empowers researchers in drug development and biomedical science to strategically deploy resources, accelerating innovation from benchtop discovery to translational application.