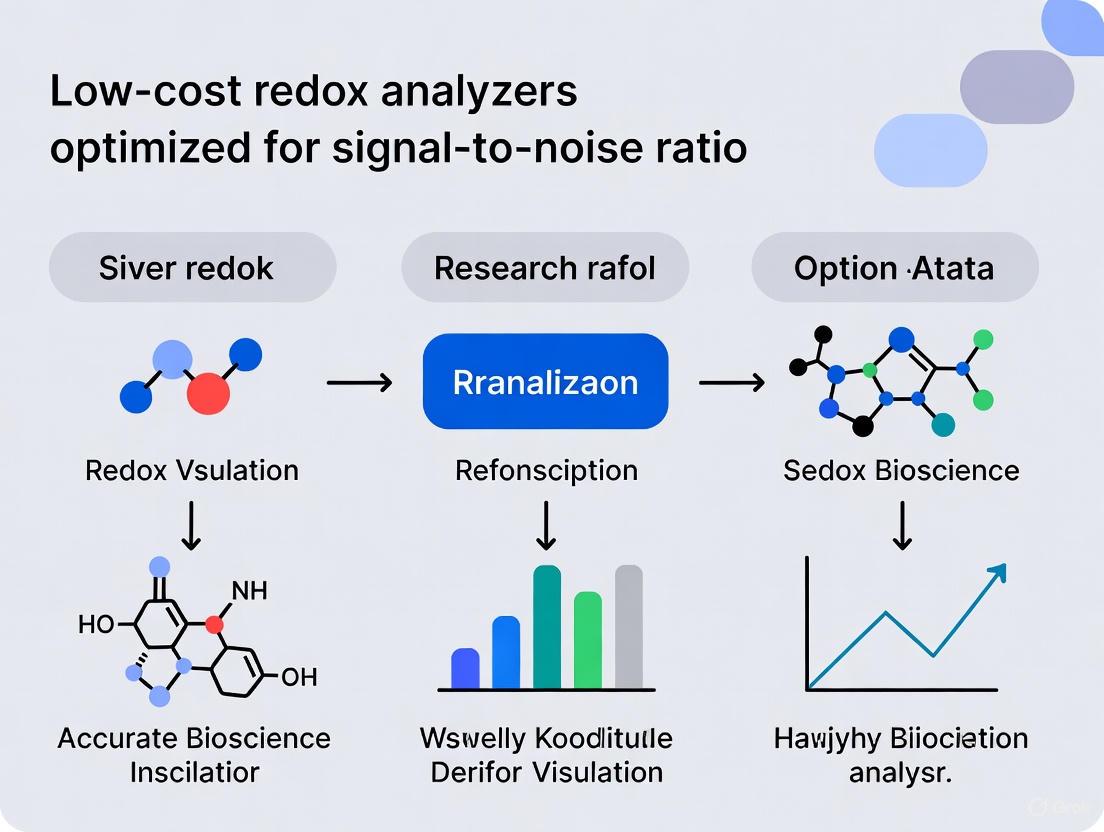
Optimizing Signal-to-Noise Ratio in Low-Cost Redox Analyzers: A Guide for Biomedical Researchers
This article provides a comprehensive framework for researchers and drug development professionals seeking to implement low-cost redox analyzers without compromising data quality.
Optimizing Signal-to-Noise Ratio in Low-Cost Redox Analyzers: A Guide for Biomedical Researchers
Abstract
This article provides a comprehensive framework for researchers and drug development professionals seeking to implement low-cost redox analyzers without compromising data quality. It covers the foundational principles of signal-to-noise ratio (SNR) in electrochemical analysis, explores methodological approaches for system optimization using redox reagents and electrolytes, details practical troubleshooting and maintenance protocols, and establishes validation strategies against high-end instrumentation. The content is designed to bridge the gap between cost-effectiveness and analytical rigor, enabling reliable measurement of oxidation-reduction potential (ORP) and impedimetric signals in biomedical research and diagnostic applications.
Understanding Signal-to-Noise Ratio and Redox Analysis Fundamentals
Defining Signal-to-Noise Ratio (SNR) and Its Critical Role in Measurement Accuracy
FAQs: Understanding Signal-to-Noise Ratio (SNR)
What is Signal-to-Noise Ratio (SNR)? The Signal-to-Noise Ratio (SNR) is a measure that compares the level of a desired signal to the level of background noise. It is defined as the ratio of signal power to noise power and is often expressed in decibels (dB). A ratio higher than 1:1 (greater than 0 dB) indicates more signal than noise [1] [2]. In essence, it quantifies how clearly your target signal can be distinguished from interfering noise.
Why is SNR critically important in electrochemical research? A high SNR means the signal is clear and easy to interpret, which directly affects the performance, reliability, and accuracy of your measurements [1] [2]. In the context of low-cost redox analyzers, a sufficient SNR is vital for detecting low concentrations of analytes, ensuring the reliability of impedimetric data, and ultimately validating the use of affordable instrumentation in rigorous research environments [3].
How do I calculate the SNR? SNR can be calculated using different methods depending on the available data. The table below summarizes the common formulas [1] [4].
Table: Formulas for Calculating Signal-to-Noise Ratio
| Measurement Context | Formula | Variable Definitions |
|---|---|---|
| Power (General) | ( \mathrm{SNR} = P{\mathrm{signal}} / P{\mathrm{noise}} ) | (P) = Average Power |
| Voltage/Amplitude | ( \mathrm{SNR} = (A{\mathrm{signal}} / A{\mathrm{noise}})^2 ) | (A) = Root Mean Square (RMS) Amplitude |
| Decibels (from Power) | ( \mathrm{SNR{dB}} = 10 \log{10}\left(\frac{P{\mathrm{signal}}}{P{\mathrm{noise}}}\right) ) | |
| Decibels (from Amplitude) | ( \mathrm{SNR{dB}} = 20 \log{10}\left(\frac{A{\mathrm{signal}}}{A{\mathrm{noise}}}\right) ) | |
| Decibels (if signal & noise already in dB) | ( \mathrm{SNR{dB}} = P{\mathrm{signal,dB}} - P_{\mathrm{noise,dB}} ) |
What is a good SNR value? The required SNR varies by application, but general guidelines for connectivity can be applied to analytical instrument performance [4]:
- Below 10 dB: Poor; signal is barely distinguishable from noise.
- 10 dB - 15 dB: Acceptable minimum for an unreliable connection/measurement.
- 15 dB - 25 dB: Marginally acceptable, but may have poor quality.
- 25 dB - 40 dB: Good.
- Above 40 dB: Excellent.
How does SNR relate to data capacity? The Shannon-Hartley theorem defines the maximum possible data rate (channel capacity, (C)) for a given bandwidth ((B)) and SNR. The formula is ( C = B \log_2(1 + \mathrm{SNR}) ) [1] [4]. This underscores that a higher SNR enables the transmission of more information reliably, which is a fundamental principle in data acquisition systems for research.
Troubleshooting Guide: Improving SNR in Redox Analyzer Experiments
This guide addresses common issues that lead to poor SNR in experiments utilizing low-cost redox analyzers.
Problem: High Noise Obscuring Faradaic Signal
Symptoms: Unstable impedance readings, noisy Nyquist plots, inability to distinguish the redox probe's semicircle, high standard deviation in replicate measurements.
Investigation and Resolution Steps:
- Isolate the Noise Source:
- Check: Is the noise environmental or chemical? Turn off nearby equipment (lights, pumps) to see if noise changes.
- Action: Use proper shielding on all cables and the measurement cell. Ensure all connections are secure.
Optimize Your Electrolyte and Redox Probe:
- Check: The composition of your background electrolyte and redox probe concentration is a primary factor [3].
- Action: Increase the ionic strength of your background electrolyte (e.g., use PBS with high salt concentration). This can sharpen the redox semicircle and move it to a higher frequency, improving measurement clarity [3].
Adjust Redox Probe Concentration:
- Check: The concentration of your redox couple (e.g., ferro/ferricyanide, [Ru(bpy)₃]²âº).
- Action: Lower the concentration of the redox probe. Research has shown that lowering redox concentration can minimize standard deviation and reduce noise migration to a low-cost analyzer, enhancing the biorecognition signal [3].
Implement Signal Averaging:
Problem: Low Signal Strength from Biorecognition Event
Symptoms: Weak or negligible change in impedimetric signal after target binding, poor sensitivity.
Investigation and Resolution Steps:
- Verify Electrode Functionality:
- Check: Electrode surface integrity and proper functionalization.
- Action: Clean and re-prepare the electrode surface. Ensure your capture probes (antibodies, DNA) are properly immobilized and active.
- Confirm Assay Chemistry:
- Check: That the redox probe in solution can effectively interact with the electrode surface post-binding.
- Action: Re-optimize your assay buffer and washing steps. The binding of the target molecule should cause a measurable perturbation in the electron transfer of the redox probe [3].
Experimental Protocol: Optimizing Electrolyte for a Low-Cost Analyzer
This protocol is adapted from research focused on transitioning an impedance-based biosensor (ESSENCE) from a high-cost to a low-cost analyzer by optimizing the electrolyte and redox system [3].
Objective: To find the optimal combination of background electrolyte and redox probe that provides a high SNR, low standard deviation, and clear Faradaic response on a low-cost analyzer (e.g., Analog Discovery 2).
Materials: Table: Key Research Reagent Solutions
| Reagent | Function / Explanation |
|---|---|
| Phosphate Buffered Saline (PBS) | A buffered electrolyte that maintains stable pH, preventing drift in measurements that can be mistaken for noise. |
| Potassium Chloride (KCl) | A high-ionic-strength electrolyte that minimizes solution resistance and can sharpen the redox peak. |
| Ferro/Ferricyanide ([Fe(CN)₆]â´â»/³â») | A common redox probe pair that undergoes reversible electron transfer, generating a strong, measurable Faradaic current. |
| Tris(bipyridine)ruthenium(II) ([Ru(bpy)₃]²âº) | An alternative redox probe that may offer different electron transfer kinetics and stability in various systems. |
| Functionalized SWCNT | Single-walled carbon nanotubes used to create a high-surface-area, nanoporous capacitive electrode to enhance signal capture. |
Methodology:
- Electrode Preparation: Fabricate your microelectrodes (e.g., NP-µIDE) and pack the microfluidic channel with your functionalized porous material (e.g., SWCNT) according to your established fabrication protocol [3].
Solution Preparation: Prepare a series of solutions with systematic variations:
- Background Electrolyte: Compare a simple electrolyte (KCl) against a buffered electrolyte (PBS).
- Ionic Strength: Test each electrolyte at low, medium, and high ionic strengths.
- Redox Probe Concentration: For each electrolyte condition, test a range of concentrations for your chosen redox couple (e.g., from 0.1 mM to 5 mM).
Impedance Measurement:
- Flow each prepared solution through the microfluidic channel using a controlled fluidic system.
- Measure the electrochemical impedance spectrum for each condition.
- Perform all measurements on both the high-cost (Keysight 4294A) and low-cost (Analog Discovery 2) analyzers for direct comparison.
Data Analysis:
- Plot Nyquist curves for each measurement.
- Key Observation: Note how the ionic strength and redox concentration affect the position and shape of the RC semicircle. Higher ionic strength or redox concentration can move the semicircle to higher frequencies [3].
- Calculate the standard deviation of replicates for each condition. The optimal condition will show a clear, well-defined semicircle with low standard deviation on the low-cost analyzer.
Conclusion: The research found that using a buffered electrolyte like PBS with high ionic strength and a lowered redox probe concentration minimized standard deviation and provided a superior signal for the low-cost analyzer, achieving similar sensitivity to the expensive benchtop unit [3].
Workflow and Relationship Diagrams
Diagram: SNR Troubleshooting Pathway
Diagram: Electrolyte Optimization Workflow
Core Components and Operating Principles of Low-Cost Redox Analyzers
Core Components and Operating Principles
Low-cost redox analyzers, central to modern electrochemical research, function by measuring the oxidation-reduction potential (ORP) in a solution. This potential, measured in millivolts (mV), indicates a solution's tendency to either gain or lose electrons [6].
The core of these instruments is an ORP electrode system, typically consisting of a measurement electrode (often made from platinum or gold) and a reference electrode (commonly Ag/AgCl) [6] [7]. The operating principle is based on the electrochemical potential that develops between these two electrodes. When the measurement electrode interacts with redox-active species in the solution, a potential is generated. This potential is measured against the stable potential of the reference electrode to determine the ORP value [6]. A positive ORP value indicates an oxidizing environment, while a negative value indicates a reducing environment [6].
A key advancement in this field is the transition from expensive benchtop impedance analyzers (e.g., KeySight 4294A, ~$50,000) to low-cost, portable alternatives (e.g., Analog Discovery 2, ~$200) without significant sensitivity loss [8]. This transition is often enabled by strategic optimization of the chemical environment, such as the use of redox probes and controlled ionic strength, to enhance the signal-to-noise ratio for the less expensive instrumentation [8].
Key Components of a Low-Cost Redox Analysis System
| Component | Description | Typical Examples/Materials |
|---|---|---|
| Measurement Electrode | The working electrode where the redox reaction occurs. Its potential varies with the solution's redox activity. | Platinum, Gold [6] |
| Reference Electrode | Provides a stable, constant potential against which the measurement electrode's potential is compared. | Ag/AgCl, Saturated Calomel Electrode (SCE) [6] [7] |
| Electrode Amplifier | Amplifies the small millivolt signal from the electrode pair for accurate measurement by the interface. | Built-in pre-amplifier, separate electrode amplifier units [7] [9] |
| Low-Cost Analyzer | The main unit that processes the signal, often a portable or USB-connected device. | Analog Discovery 2, other portable USB oscilloscopes [8] |
| Electrolyte/Redox Probe | The solution containing the analyte and often added redox-active molecules to enhance the Faradaic signal. | Ferro/ferricyanide, [Ru(bpy)₃]²⺠in PBS or KCl buffer [8] |
Diagram 1: System components and data flow of a low-cost redox analyzer.
Troubleshooting Guides and FAQs
Frequently Asked Questions
Q1: My ORP readings are unstable and drifting. What could be the cause? Unstable readings are often caused by a coated electrode surface, an aging electrode, or a low ionic strength solution. For low ionic strength samples, the solution tries to leach ions from the electrode's reference gel, leading to sluggish and unstable readings. Using a double-junction electrode designed for low ionic applications is recommended. An aging electrode typically has increased impedance, causing slow or drifting signals and is characterized by a zero point shift beyond adjustment range and shortened span [9].
Q2: How can I verify if my ORP sensor is functioning correctly? A primary test involves placing the sensor tip into a buffer solution with a known pH and checking the millivolt readings. Typical ORP values for standard buffers are [7]:
- pH 4 buffer: 350 – 360 mV
- pH 7 buffer: 270 – 280 mV
- pH 10 buffer: 100 – 110 mV Significant deviations from these expected ranges may indicate a faulty or contaminated electrode.
Q3: Do I need to calibrate my ORP sensor, and how? For many experiments where the rate of change is more critical than the absolute value, the factory calibration is sufficient. However, for applications requiring high accuracy (e.g., water quality testing), a two-point calibration with commercial ORP standards is necessary [7].
Q4: What is the best way to store an ORP electrode to maintain its lifespan? Electrodes should be stored in a proper storage solution. Sensorex provides a soaker bottle with storage solution, which can also be purchased separately (e.g., part number S16). If this is unavailable, you can use, in order of preference: pH 4 buffer, pH 7 buffer, or tap water. Do not store the electrode in deionized (DI) water, as this can damage it. DI water should only be used for rinsing [9].
Q5: My readings are erratic only when the sensor is installed in the process stream, but work fine in a beaker. What should I check? This is a classic symptom of an electrical ground loop. To verify, calibrate the electrode in a beaker with a known buffer. If it works correctly, place a copper wire into the beaker with the other end touching your process system. If the reading becomes unstable, a ground loop is confirmed. The source can be motors, pumps, or other electrically powered devices in the media. Isolate the sensor ground or use a large copper conductor to draw the ground loop away from the electrode [9].
Troubleshooting Guide
| Problem | Possible Causes | Recommended Solutions |
|---|---|---|
| Unstable/Drifting Readings | Coated electrode; Aging electrode; Low ionic strength solution; Ground loop [9] | Clean electrode; Replace old electrode; Use low-ionic specific electrode; Check for/break ground loops [9] |
| Sluggish Response | Coating on electrode; Aging electrode glass (high impedance); Low temperature [9] | Clean electrode surface; Replace electrode; Note that response slows as temperature drops [9] |
| Inaccurate Readings | Incorrect calibration; Contaminated reference junction; Electrode out of specification [7] | Perform 2-point calibration with ORP standards; Clean reference junction; Test in standard buffers [7] |
| No Signal | Cable/connector damage; Air bubbles on electrode surface; Incorrect instrument settings [7] | Check cables and connections; Ensure electrode bulb is fully submerged; Verify sensor configuration in software [7] |
Optimizing Signal-to-Noise Ratio: An Experimental Workflow
A critical study demonstrated the pathway for transitioning a biosensor platform (ESSENCE) from an expensive benchtop analyzer to a low-cost portable unit while maintaining sensitivity. The key was a fundamental optimization of the electrolyte and redox probe system to enhance the signal-to-noise ratio (SNR) for the cheaper instrument [8].
Research Reagent Solutions for SNR Optimization
| Reagent | Function in the Experiment | Example from Study |
|---|---|---|
| Redox Probe / Buffer | Provides a reversible redox couple to generate a strong, measurable Faradaic current, enhancing the impedimetric signal from biorecognition events. | Ferro/ferricyanide ([Fe(CN)₆]â´â»/³â»); Tris(bipyridine)ruthenium(II) ([Ru(bpy)₃]²âº) [8] |
| Background Electrolyte | Carries the current in the solution, controls ionic strength, and stabilizes pH. Its properties significantly impact redox molecule interaction with the electrode surface. | Phosphate Buffered Saline (PBS); Potassium Chloride (KCl) [8] |
| Buffer with High Ionic Strength | Minimizes standard deviation and overall signal noise, making the system less susceptible to interference when using a low-cost analyzer. | PBS with high ionic strength [8] |
| Low Concentration Redox Probe | When used with a high ionic strength buffer, helps to minimize noise and standard deviation, further optimizing the SNR for the low-cost platform. | Lowered concentrations of ferro/ferricyanide or [Ru(bpy)₃]²⺠[8] |
Detailed Methodology for SNR Optimization
The following protocol is adapted from research focused on optimizing an impedance-based biosensor for use with a low-cost analyzer [8].
1. Goal: To optimize the electrolyte and redox probe system to achieve a high signal-to-noise ratio, allowing a low-cost analyzer (e.g., Analog Discovery 2) to perform with sensitivity comparable to a high-end benchtop analyzer (e.g., KeySight 4294A).
2. Reagents and Equipment:
- Redox Probes: Prepare solutions of redox couples such as potassium ferrocyanide/potassium ferricyanide (e.g., 5 mM) and Tris(bipyridine)ruthenium(II) chloride.
- Background Electrolytes: Standard solutions like Potassium Chloride (KCl) and Phosphate Buffered Saline (PBS), prepared at different ionic strengths.
- Analyzers: A precision impedance analyzer (e.g., KeySight 4294A) for benchmarking and a low-cost USB oscilloscope/impedance analyzer (e.g., Analog Discovery 2).
- Electrochemical Cell: The biosensor platform, such as the ESSENCE flow-through cell or a standard three-electrode system (working, counter, and reference electrodes).
3. Experimental Procedure:
- Step 1: Interplay of Electrolyte and Redox Probe
- Measure the impedance (Nyquist plots) of different electrolyte solutions (KCl, PBS) in the presence and absence of different redox probes ([Fe(CN)₆]â´â»/³â», [Ru(bpy)₃]²âº).
- Observe how the type and concentration of the redox molecule cause significant changes in the Nyquist curve. Note that the redox species and the background electrolyte can produce separate RC semicircles that may overlap.
- Step 2: Effect of Ionic Strength and Redox Concentration
- Systematically vary the ionic strength of the background electrolyte (e.g., concentration of PBS) and the concentration of the redox probe.
- Document the finding that increasing the ionic strength or the redox concentration shifts the RC semicircle in the Nyquist plot to higher frequencies, and vice versa.
- Step 3: Signal Stability and Noise Assessment
- Compare the standard deviation and overall signal sensitivity between different electrolytes. The study found that using a buffered electrolyte (PBS) instead of just KCl led to a lower standard deviation, albeit with a slightly lower overall sensitivity.
- Step 4: Optimal Formulation for Low-Cost Analyzers
- To achieve the best SNR with the low-cost analyzer, select a buffered electrolyte with high ionic strength (e.g., PBS) and use a lowered concentration of the redox probe. This combination was found to minimize standard deviation and reduce noise migration to the cheaper analyzer.
- Step 5: Performance Validation
- Run identical biorecognition assays (e.g., detection of ssDNA or a protein biomarker) using both the high-end and low-cost analyzers with the optimized electrolyte/redox system.
- Compare the results, including detection limit and sensitivity, to validate the performance of the low-cost setup.
Diagram 2: Workflow for optimizing the signal-to-noise ratio.
Quantitative Performance Comparison
The optimized chemical system enabled the low-cost analyzer to achieve performance comparable to the expensive benchtop unit, as summarized below [8].
| Performance Metric | High-Cost Analyzer (KeySight 4294A) | Low-Cost Analyzer (Analog Discovery 2) with Optimization |
|---|---|---|
| Unit Cost | ~$50,000 | ~$200 |
| Key Enabler for Low-Cost Performance | Native high performance | Optimized electrolyte/redox probe system (e.g., High ionic strength PBS + lowered redox concentration) |
| Primary Outcome | High sensitivity benchmark | Similar sensitivity and a lowered detection limit achieved |
In the context of research on low-cost redox analyzers, optimizing the signal-to-noise ratio (SNR) is paramount for obtaining reliable and reproducible data. Electrochemical noise (EN) refers to the low-level, spontaneous fluctuations in current and potential occurring in electrochemical systems, which can obscure the desired analytical signal [10] [11]. Similarly, Oxidation-Reduction Potential (ORP) measurements, which quantify a solution's electron-transfer capability, are susceptible to various disruptive influences [12] [13]. For researchers working with cost-effective instrumentation, understanding and mitigating these noise sources is not merely a procedural detail but a critical factor in validating experimental outcomes. This guide provides targeted troubleshooting strategies to identify and minimize noise, thereby enhancing data quality without resorting to prohibitively expensive equipment.
FAQs on Fundamental Concepts
Q1: What is the fundamental difference between electrochemical noise in corrosion monitoring versus in analytical sensing?
While the underlying physics is similar, the application context changes how noise is perceived and utilized.
- In Corrosion Monitoring: Electrochemical noise is the primary signal of interest. Fluctuations in current and potential are actively analyzed to identify corrosion mechanisms (e.g., pitting, stress corrosion cracking) and estimate corrosion rates. The "noise" contains information about stochastic events like film rupture or metastable pitting [10] [14].
- In Analytical Sensing (e.g., with low-cost redox analyzers): Electrochemical noise is typically an unwanted disturbance that interferes with the measurement of a faradaic current or impedance signal used for biosensing or quantification. The goal is to minimize this noise to improve the detection limit and accuracy of the measurement [8].
Q2: Why is ORP considered a non-specific measurement, and how does this relate to noise?
ORP measures the collective thermodynamic tendency of all redox-active species in a solution to undergo oxidation or reduction [12]. It does not identify specific chemicals. This non-specificity means that fluctuations in the concentration of any redox species—even minor contaminants—will cause the ORP reading to change. These fluctuations can manifest as measurement noise, making it challenging to isolate the signal from the target analyte, especially in complex matrices like biological fluids or wastewater [13].
Q3: Can a low-cost analyzer achieve performance comparable to a high-end instrument?
Yes, but it requires rigorous optimization of the experimental system to maximize the signal-to-noise ratio. Research has demonstrated that a ~$200 USB oscilloscope (Analog Discovery 2) can achieve similar sensitivity to a ~$50,000 benchtop impedance analyzer (Keysight 4294A) for biosensing applications. This was accomplished by strategically optimizing the electrolyte composition and redox probe concentration to generate a cleaner, more robust signal compatible with the lower-cost hardware [8].
Instrumental and Environmental Noise
This category encompasses noise originating from the external measurement setup and environment.
Table 1: Troubleshooting Instrumental and Environmental Noise
| Noise Source | Common Symptoms | Diagnostic Experiments | Corrective Actions |
|---|---|---|---|
| Electromagnetic Interference (EMI) [15] | Drifting baseline, erratic spikes in current/potential, high-frequency oscillations visible in EIS Nyquist plots at low frequencies. | Measure a stable dummy cell (e.g., a 1 MΩ resistor) in both shielded and unshielded conditions. A significant change in signal stability indicates EMI susceptibility [15]. | Use a Faraday cage. Employ shielded cables. Ensure proper grounding to a single point to avoid ground loops. Keep cables away from power lines and motors. |
| Poor Cable Management & Ground Loops [15] | 50/60 Hz sinusoidal pattern superimposed on the signal, unstable readings. | Temporarily power the system from batteries to isolate from mains ground. Disconnect and re-route cables to minimize parallel runs. | Use a single, well-defined grounding point. Separate signal cables from power cables. Use twisted-pair or coaxial shielded cables. |
| Mechanical Vibrations [15] | Low-frequency drift or periodic oscillations in the signal. | Place the setup on a vibration-damping platform (e.g., a heavy stone slab with dampening foam). | Isolate the apparatus from building vibrations, foot traffic, and nearby machinery. Use a stable, heavy lab table. |
| Solution Resistance (Uncompensated) | Distorted voltammetric peaks, inaccurate ORP readings, skewed EIS semicircles. | Perform EIS on a known electrochemical cell; a large, distorted semicircle may indicate high solution resistance. | Position the reference electrode close to the working electrode. Use an electrolyte with a higher supporting ionic strength (e.g., 0.1 M PBS or KCl) to lower overall resistance [8]. |
Electrochemical Cell and Configuration Noise
This noise arises from the design and components of the electrochemical cell itself.
Table 2: Troubleshooting Electrochemical Cell and Configuration Noise
| Noise Source | Common Symptoms | Diagnostic Experiments | Corrective Actions |
|---|---|---|---|
| Unstable Reference Electrode | Drifting potential in open circuit potential (OCP) or ORP measurements. | Measure OCP of a stable system over time; a steady drift > a few mV/min suggests reference electrode issues. | Use a fresh reference electrode filling solution. Ensure the reference junction is not clogged. Condition the electrode properly before use. |
| Non-Identical Working Electrodes (for EN) | High, asymmetric current noise in a zero-resistance ammeter (ZRA) setup. | Measure the galvanic current between the two working electrodes at their open-circuit potential; a significant steady-state current indicates imbalance. | Use electrodes with identical composition, surface preparation, and history. Pre-condition both electrodes in the same electrolyte [14]. |
| Contaminated Electrodes | Unusually high background current, shifted redox peaks, poor reproducibility. | Run cyclic voltammetry of a benchmark redox couple (e.g., Ferro/ferricyanide); peak separation > 59 mV/n indicates a problem. | Clean electrodes rigorously (e.g., polish, sonicate) according to established protocols for the electrode material. |
| Fluctuating Electrolyte Flow (in flow cells) | Current/potential noise correlated with pump cycles. | Measure noise with the pump on and off. | Use a pulse-dampener in the flow line. Employ a more stable flow source (e.g., a syringe pump). |
Chemical and Electrolyte Noise
This stems from the chemical composition of the solution being measured.
Table 3: Troubleshooting Chemical and Electrolyte Noise
| Noise Source | Common Symptoms | Diagnostic Experiments | Corrective Actions |
|---|---|---|---|
| Unbuffered or Drifting pH | Drifting ORP signals, inconsistent analytical response. ORP is highly sensitive to pH [13]. | Monitor pH and ORP simultaneously; correlate ORP drift with pH changes. | Use a buffered electrolyte (e.g., PBS) to maintain a stable pH. For ORP, understand that the reading is pH-dependent and always report the pH [8] [13]. |
| Low Ionic Strength | High solution resistance, leading to increased thermal noise and poor signal-to-noise ratio, especially in low-current experiments. | Noisy, attenuated signals. Measuring solution conductivity can confirm low ionic strength. | Increase the concentration of an electrochemically inert supporting electrolyte (e.g., KCl, NaNO₃) to typically 0.1 M or higher [8]. |
| Inappropriate Redox Probe Concentration [8] | Signal saturation or excessive background noise in Faradaic sensors. | Perform EIS or CV with varying concentrations of the redox probe (e.g., ferro/ferricyanide). | Optimize concentration. For low-cost systems, lower redox concentrations can sometimes minimize noise and standard deviation [8]. |
| Dissolved Oxygen | Cathodic current on voltammograms, unstable baseline in negative potential regions. | Purge the solution with an inert gas (Nâ‚‚, Ar). A stabilization of the baseline indicates oxygen interference. | Sparge the electrolyte with inert gas (Nâ‚‚, Ar) for at least 10-15 minutes before measurements. Maintain a blanket of gas during experiments if necessary. |
| Chemical Interferences | Unpredictable ORP readings, fouling of the electrode surface. | Dilute the sample or add a masking agent; a change in reading suggests interferences. | Use appropriate sample pre-treatment (e.g., filtration, chelation). Choose an ORP electrode with a junction less prone to fouling (e.g., polymeric). |
Experimental Protocol: Systematic Noise Diagnosis
The following workflow provides a step-by-step methodology for isolating the source of noise in an electrochemical or ORP measurement system.
Diagram 1: Workflow for systematic diagnosis of measurement noise.
Objective: To methodically identify the dominant source(s) of noise in an electrochemical or ORP measurement setup.
Materials:
- Potentiostat/Galvanostat or ORP meter (e.g., low-cost USB device or commercial instrument).
- Electrochemical cell (e.g., 3-electrode cell for analytics, 2-identical electrode for EN).
- Reference electrode, Counter electrode, Working Electrode(s).
- Shielding equipment (Faraday cage, shielded cables).
- Known resistive dummy cell (e.g., 1 MΩ resistor).
- High-purity electrolytes (e.g., 0.1 M KCl, PBS).
- High-purity water and standard redox probes (e.g., 1 mM K₃Fe(CN)₆/K₄Fe(CN)₆).
Procedure:
- Initial Setup and Visual Inspection: Connect your experimental setup as usual. Perform a thorough visual inspection of all components, checking for loose connections, signs of electrode contamination, or air bubbles in the electrolyte or reference electrode junction.
- Instrument and Cable Isolation:
- Disconnect the electrochemical cell.
- Connect a 1 MΩ resistor between the working and reference/counter electrode leads (a dummy cell).
- Run a low-current measurement (e.g., chronoamperometry at 0 V for 60 seconds). A perfectly stable system should show a flat line with minimal noise. Significant noise here indicates intrinsic instrument noise or, more likely, insufficient shielding from EMI.
- Enclose the dummy cell and all cables in a Faraday cage and repeat the measurement. A dramatic reduction in noise confirms EMI as a major contributor [15].
- Baseline Characterization with Simple Electrolyte:
- Reconnect a clean, standard 3-electrode cell.
- Fill it with a simple, well-defined electrolyte like 0.1 M KCl.
- Using clean, polished electrodes, run a cyclic voltammogram or electrochemical impedance spectrum. The signal should be stable and reproducible. High noise in this controlled environment points to issues with the cell configuration or electrodes themselves.
- Systematic Re-introduction of Complexity:
- Once a stable baseline is achieved in the simple system, begin re-introducing the components of your actual experiment one by one.
- Step A: Add the redox probe or analyte to the simple electrolyte. Observe any change in noise.
- Step B: Replace the simple electrolyte with your actual sample matrix.
- Step C: If your experiment involves flow, turn on the pump.
- By noting which step re-introduces the noise, you can pinpoint its source (e.g., chemical interference from the sample, fluctuations from pumping).
The Scientist's Toolkit: Essential Reagents and Materials
Selecting the right materials is a critical first step in minimizing measurement noise.
Table 4: Research Reagent Solutions for Noise Reduction
| Category | Item | Specific Function in Noise Mitigation |
|---|---|---|
| Electrolytes & Buffers | Phosphate Buffered Saline (PBS) | Provides a stable pH and high ionic strength, reducing noise from pH fluctuations and high solution resistance [8]. |
| Potassium Chloride (KCl) | An inert supporting electrolyte used to increase ionic strength, thereby minimizing solution resistance and thermal noise. | |
| Redox Probes | Potassium Ferro/Ferricyanide ([Fe(CN)₆]â´â»/³â») | A well-characterized, reversible redox couple used to benchmark electrode performance and optimize sensor response. Concentration must be optimized [8]. |
| Tris(bipyridine)ruthenium(II) chloride ([Ru(bpy)₃]²âº) | An alternative redox probe with different electrochemical properties; testing multiple probes can help identify one with a cleaner signal in your specific system [8]. | |
| Electrode Care | Alumina Slurry (various grades) | For polishing electrode surfaces to a mirror finish, which ensures reproducible kinetics and reduces noise from surface heterogeneity. |
| Surfactant (e.g., Alconox) | For cleaning organic contaminants from electrodes and glassware, preventing surface fouling and signal drift. | |
| Shielding & Hardware | Faraday Cage | A conductive enclosure that blocks external electromagnetic fields, essential for low-current ( |
| Shielded Cables | Coaxial or twisted-pair cables that prevent external EMI from coupling into the signal lines between the cell and the potentiostat. | |
| Triflumizole | Triflumizole, CAS:149465-52-1, MF:C15H15ClF3N3O, MW:345.75 g/mol | Chemical Reagent |
| Massarigenin C | Massarigenin C, MF:C11H12O5, MW:224.21 g/mol | Chemical Reagent |
Visualizing the Signal-to-Noise Optimization Strategy
A successful strategy for using low-cost analyzers involves a holistic approach that balances instrumental, chemical, and experimental factors, as summarized in the following relationship diagram.
Diagram 2: Interdependent factors affecting the signal-to-noise ratio.
The Impact of Low SNR on Detection Limits and Data Reliability in Biomedical Assays
FAQs
What is Signal-to-Noise Ratio (SNR) and why is it critical in biomedical assays?
SNR is a measure that compares the level of a desired signal to the level of background noise. It is often expressed in decibels (dB) [1]. A high SNR indicates a clear, detectable signal, whereas a low SNR means the signal is obscured by noise, making it difficult to distinguish and reliably quantify [1]. In biomedical detection, a low SNR can elevate the Limit of Detection (LOD)—the lowest concentration of an analyte that can be reliably detected—and compromise data integrity. This is particularly critical in applications like detecting low-abundance biomarkers or single-molecule imaging [16].
What are the common symptoms of low SNR in my experimental data?
Your data may be suffering from low SNR if you observe:
- High Variance in Replicates: Significant scatter between technical replicates or experimental repeats.
- Inability to Distinguish Low-Level Signals: Failure to detect known low-concentration targets above the background.
- Poor Reproducibility: Results that cannot be consistently replicated across experiments.
- High False Positive/Negative Rates: A detector may exhibit false positive and false negative rates exceeding 20% when SNR is very low (e.g., 0 dB or -3 dB) [17].
My fluorescence-based assay has a high background. How can I improve the SNR?
A high fluorescent background is a common cause of poor SNR. Key strategies include:
- Utilizing High-Quality Optical Filters: Use high-end interference filters designed for your fluorophores. Ensure they are positioned to maintain a near-perpendicular light path, as their performance degrades at incident angles greater than 15°, allowing blocked excitation light to leak through [18].
- Improving Substrate Flatness: A rough or uneven substrate surface can scatter light and increase background noise. Using silicon-on-insulator (SOI) substrates, which provide an ultra-flat surface, has been shown to reduce the fluorescent background by ~5 times and improve the SNR for single-molecule detection by more than 18 times compared to conventional silicon wafers [18].
- Optimizing Buffer and Reagents: Ensure your reagents are pure and free of precipitates or contaminants that can cause autofluorescence or light scattering [18].
Troubleshooting Guides
Guide 1: Diagnosing the Causes of Low SNR
Follow this logical workflow to systematically identify the root cause of low SNR in your experiments.
Guide 2: Resolving Low SNR in Image-Based Digital Sensing
Imaging-based digital sensing discretizes signals to detect single molecules or particles, but requires high SNR for reliable counting [16]. This guide provides a protocol to enhance SNR through multi-frame analysis, a technique that leverages the correlation of a true signal over time versus random noise [19].
Experimental Protocol: Multi-Frame Analysis for SNR Enhancement
Principle: A moving target or a persistent signal is correlated across sequential image frames, while noise is random and uncorrelated. Integrating signals over multiple frames increases the signal linearly, while the noise increases more slowly, resulting in a net gain in SNR [19].
- Workflow Overview:
Step-by-Step Instructions:
- Estimate Background (
B_t): For each new frame (F_t), compute a running background estimate using an Infinite Impulse Response (IIR) filter:B_t = (1 - α) * B_(t-1) + α * F_t, whereαis an update rate between 0 and 1 [19]. - Create Difference Frame (
D_t): Subtract the previous background estimate from the current frame:D_t = F_t - B_(t-1)[19]. - Normalize Difference Frame (
N_d): Estimate the temporal standard deviation (σ) of each pixel and normalize the Difference Frame to account for varying noise levels:N_d = D_(i,j,t) / σ_(i,j,t-1)[19]. - Frame Buffering: Store a sequence of the normalized difference frames in a temporal buffer.
- Signal Integration: For candidate targets, integrate the signal intensity across the buffered frames. This step significantly boosts the SNR because the target signal adds coherently while noise averages out [19].
- Detection: Apply a threshold to the integrated image to identify true signals with high confidence and a low false-positive rate [19].
- Estimate Background (
Expected Outcome: This method can detect targets with an SNR as low as 1:1 (0 dB) that are otherwise invisible in a single frame, effectively extending the system's Limit of Detection [19].
Performance of EMG Detectors at Low SNRs
Table 1: This table summarizes the performance of selected EMG onset detectors when tested on simulated low SNR signals, relevant for movement intention detection in severely impaired stroke patients [17].
| Detector Name | Type | Performance at 0 dB SNR | Performance at -3 dB SNR | Maximum Latency |
|---|---|---|---|---|
| Modified Hodges | Threshold-based | ~90% of trials successful | ~40% of trials successful | ≤ 50 ms |
| Fuzzy Entropy | Entropy-based | Slightly lower than Modified Hodges | Slightly lower than Modified Hodges | ≤ 50 ms |
| Gaussian AGLR | Statistical | Slightly lower than Modified Hodges | Slightly lower than Modified Hodges | ≤ 50 ms |
| Laplacian AGLR | Statistical | Slightly lower than Modified Hodges | Slightly lower than Modified Hodges | ≤ 50 ms |
Performance is based on achieving a false positive rate and false negative rate of ≤ 20% with a latency of ≤ 50 ms [17].
Signal-to-Noise Ratio Formulations
Table 2: Common formulas for calculating and expressing SNR in different contexts [20] [1].
| Context | SNR Formula | Variables | ||
|---|---|---|---|---|
| General Power Ratio (dB) | ( SNR{dB} = 10 \log{10} \left( \frac{P{signal}}{P{noise}} \right) ) | ( P ): Average power | ||
| RMS Amplitude (dB) | ( SNR{dB} = 20 \log{10} \left( \frac{A{signal}}{A{noise}} \right) ) | ( A ): Root Mean Square amplitude | ||
| Boolean Biochemical Signals | ( SNR{dB} = 20 \log{10} \frac{ | \log{10} (\mu{g,true} / \mu_{g,false}) | }{2 \cdot \log{10} (\sigmag)} ) | ( \mug ): Geometric mean; ( \sigmag ): Geometric standard deviation [20] |
| Alternative Definition | ( SNR = \frac{\mu}{\sigma} ) | ( \mu ): Signal mean; ( \sigma ): Standard deviation [1] |
The Scientist's Toolkit
Research Reagent Solutions for Low-SNR Environments
Table 3: Essential materials and their functions for experiments where optimizing SNR is critical.
| Item | Function/Application | Key Consideration for SNR |
|---|---|---|
| SOI (Silicon-on-Insulator) Substrate | Provides an ultra-flat surface for microfluidic channels or imaging chambers [18]. | Reduces light scattering and background fluorescence; demonstrated to improve SNR by >18x for TIRF microscopy [18]. |
| High-Efficiency Optical Filters (e.g., ET Series) | Isolate specific excitation and emission wavelengths in fluorescence detection [18]. | High-end multi-layer filters prevent signal bleed-through; performance is highly sensitive to incident angle (keep <15°) [18]. |
| Fluorophores (e.g., Fluorescein, Rhodamine 6G) | Labeling targets for optical detection in assays like dPCR, ELISA, and cell imaging [18]. | Brightness and photostability directly impact signal strength. pH and solvent dependence must be controlled [18]. |
| Multi-Frame Processing Software | Algorithmic enhancement of targets in a sequence of images [19]. | Integrates correlated target signals over time while suppressing uncorrelated noise, enabling detection of single-pixel, near 1:1 SNR targets [19]. |
| Ashimycin B | Ashimycin B, MF:C23H41N7O14, MW:639.6 g/mol | Chemical Reagent |
| BAY 249716 | BAY 249716, MF:C13H9ClN4S, MW:288.76 g/mol | Chemical Reagent |
Frequently Asked Questions (FAQs)
Q1: Why are SNR, PSNR, and SSIM crucial for evaluating low-cost redox analyzers? These objective metrics are essential for quantitatively assessing the signal quality and data fidelity of your analyzer's output. In the context of redox flow battery (RFB) research, where parameters like voltage and current are critical, a high Signal-to-Noise Ratio (SNR) indicates that the measured signal (e.g., a voltage plateau) is clear and distinguishable from background electrical noise. PSNR and SSIM are used to validate the integrity of any visual or image-based data, such as from microscopy of electrodes or electrolytes, ensuring that processing or compression has not introduced significant distortions. Using these metrics allows for the systematic comparison of different low-cost designs or materials against a known benchmark [21] [22].
Q2: A high PSNR value suggests good image quality, yet my processed data appears blurry. Why is this? This is a common limitation of PSNR. It is a pixel-based metric that does not fully align with human visual perception. An image can be blurry yet have a high PSNR because the pixel-wise differences from the original are low on average. However, blurring specifically removes high-frequency details and structural information, to which the human eye is sensitive. In such cases, the Structural Similarity Index (SSIM), which compares luminance, contrast, and structure, is often a better metric as it will typically yield a lower score for a blurry image, more closely matching subjective human assessment [23] [24] [25].
Q3: How should I calculate PSNR for multi-channel data, like color images of chemical reactions? For multi-channel data like RGB images, the standard approach is to calculate the Mean Squared Error (MSE) across all pixel values in all three channels and then compute the PSNR a single time using this aggregate MSE [26] [25]. An alternative method, which can be more aligned with human vision, is to convert the image to a luminance-based color space (such as YCbCr) and compute the PSNR only on the luminance (Y) channel, as the human visual system is more sensitive to changes in brightness than in color [27].
Q4: What are typical PSNR and SSIM value ranges, and what do they indicate? The tables below summarize typical value ranges for 8-bit images.
Table 1: Interpretation of PSNR Values for 8-bit Images
| PSNR Range (dB) | Perceived Quality Indication |
|---|---|
| > 30 dB | High quality; differences hard for humans to perceive [25]. |
| 20 - 30 dB | Acceptable quality; differences are noticeable [25]. |
| < 20 dB | Low quality; strong distortion is apparent [25]. |
Table 2: Interpretation of SSIM Values
| SSIM Value | Perceived Quality Indication |
|---|---|
| 1.0 | Perfect, identical match [25]. |
| Close to 1.0 | High structural similarity [28]. |
| 0.0 or lower | No structural similarity [25]. |
Q5: Can I use PSNR and SSIM to evaluate non-image data from my experiments? PSNR is specifically designed for signals with a defined maximum peak value, like images or audio. Its application to other one-dimensional signals (like voltage vs. time from an RFB) is possible but less common; SNR is a more generic metric for such data. SSIM, however, is explicitly designed for image data and relies on two-dimensional structural information. It is not suitable for evaluating one-dimensional signals like voltage curves from battery cycling [29] [28].
Quantitative Metrics for Performance Evaluation
The following tables provide a structured comparison of the core metrics for your experimental analysis.
Table 3: Core Definitions and Formulae of Key Metrics
| Metric | Full Name | Core Definition & Formula |
|---|---|---|
| SNR | Signal-to-Noise Ratio | \(SNR = 10 \cdot \log_{10} \left( \frac{\text{Signal Power}}{\text{Noise Power}} \right)\) [29]. |
| PSNR | Peak Signal-to-Noise Ratio | \(PSNR = 10 \cdot \log{10} \left( \frac{{\text{MAX}I}^2}{\text{MSE}} \right)\) where \(\text{MSE} = \frac{1}{mn}\sum{i=0}^{m-1}\sum{j=0}^{n-1}[I(i,j)-K(i,j)]^2\) [26]. |
| SSIM | Structural Similarity Index | \(SSIM(x,y) = \frac{(2\mux \muy + C1)(2\sigma{xy} + C2)}{(\mux^2 + \muy^2 + C1)(\sigmax^2 + \sigmay^2 + C2)}\) where \(\mu\): mean, \(\sigma\): variance, \(\sigma{xy}\): covariance [29] [25]. |
Table 4: Comparative Analysis of Image Quality Metrics
| Aspect | PSNR | SSIM |
|---|---|---|
| Basis of Comparison | Pixel-based error (MSE) [29]. | Perception-based (brightness, contrast, structure) [29]. |
| Theoretical Range | 0 to ∞ (dB) [25]. | -1 to 1 [25]. |
| Computational Speed | Fast and simple to compute [23]. | More computationally intensive than PSNR. |
| Human Perception | Poor correlation; can misrepresent visual quality [23] [24]. | Better correlation with human subjective scoring [23]. |
| Primary Limitation | Fails to capture structural integrity loss (e.g., blur) [29]. | Less effective for geometric transformations (e.g., rotation) [25]. |
Experimental Protocols for Metric Implementation
Protocol 1: Calculating PSNR for an Image Dataset This protocol is used to assess the fidelity of processed images (e.g., from a microscope) against a pristine reference.
- Preparation: Obtain your reference image (e.g., a high-quality microscope capture) and the distorted/processed image for comparison. Ensure both images are the same size and resolution.
- Convert to Appropriate Color Space: If the images are color, decide on a method. You can either:
- Compute MSE: Calculate the Mean Squared Error between the two images using the formula in Table 3.
- Calculate PSNR: Using the determined MSE and the maximum possible pixel value (MAX~I~, typically 255 for 8-bit images), compute the PSNR in decibels (dB) using the formula in Table 3 [26].
- Interpret Results: Refer to Table 1 to understand the perceived quality indicated by the calculated PSNR value.
The following workflow diagram illustrates the computational steps for determining PSNR.
Protocol 2: Evaluating Structural Similarity with SSIM This protocol provides a more perceptually relevant assessment of image similarity.
- Preparation: As with PSNR, start with aligned reference and test images of the same size.
- Define a Sliding Window: SSIM is typically computed using a sliding window that moves pixel-by-pixel across the image. Common window functions include an 8x8 or 11x11 Gaussian window [25] [28].
- Compute Local Statistics: For each window, calculate the local means (μ~x~, μ~y~), variances (σ~x~, σ~y~), and covariance (σ~xy~) of the pixel values.
- Calculate Local SSIM Index: Using the formulae for luminance, contrast, and structure, compute the SSIM index for the current window.
- Aggregate to Mean SSIM (MSSIM): Average the SSIM indices obtained from all windows to get a single global SSIM value for the entire image [28].
- Interpret Results: Refer to Table 2 to understand the level of structural similarity.
Research Reagent Solutions for Redox Flow Battery Studies
The following materials are essential for constructing and testing low-cost redox flow batteries, as highlighted in recent research.
Table 5: Essential Materials for Redox Flow Battery Prototyping
| Material / Component | Function / Role in the Experiment |
|---|---|
| Zinc Chloride (ZnClâ‚‚) & Sodium Chloride (NaCl) | Forms a low-cost, readily available saltwater electrolyte solution, acting as the anolyte in Zinc-Chlorine Flow Batteries (ZCFBs) [21]. |
| Mineral Spirits | Can be used as the catholyte component in a ZCFB system, paired with a saltwater electrolyte [21]. |
| Porous Carbon Electrode | Serves as the cathode, facilitating the reduction and oxidation (redox) reactions. Its high surface area is crucial for reaction kinetics [21]. |
| Ion Exchange Membrane | A central component (e.g., Nafion) that separates the anolyte and catholyte, allowing proton transfer while preventing electrolyte mixing [22]. |
| Ultra-High Molecular Weight Polyethylene (UHMWPE) | A robust, acid-resistant polymer used in novel cell designs to create integrated end-plates and flow frames, reducing component count and cost [22]. |
| Vanadium Electrolytes | The electroactive species in All-Vanadium Redox Flow Batteries (VRFBs). Using vanadium on both sides limits cross-contamination issues [22]. |
The logical relationships between the core components of a redox flow battery system and the quality metrics used to evaluate them are summarized below.
Practical Strategies for SNR Enhancement in Redox Workflows
Technical Support Center
Troubleshooting Guides
Guide 1: Addressing Erratic Signal and High Background Noise in Low-Cost Redox Analyzers
Problem: Your inexpensive impedance analyzer or redox sensor shows unstable readings, high background noise, or poor signal-to-noise ratio, making it difficult to detect the target analyte reliably.
Why This Happens:
- High redox probe concentration can increase signal but also amplify noise and standard deviation [8].
- Low ionic strength of the background electrolyte can lead to overlapping RC semicircles in Nyquist plots, obscuring the Faradaic signal [8].
- Using a simple salt like KCl instead of a buffered electrolyte may result in higher sensitivity but also a larger standard deviation [8].
- The performance limitations of a low-cost analyzer (e.g., Analog Discovery 2) become more apparent with a suboptimal electrolyte composition [8].
Solution Steps:
- Adjust Redox Probe Concentration: Lower the concentration of your redox couple (e.g., ferro/ferricyanide or [Ru(bpy)3]2+). Start by reducing the concentration incrementally while monitoring the signal-to-noise ratio [8].
- Increase Buffer Ionic Strength: Use a buffered electrolyte like PBS with high ionic strength. This helps sharpen the Faradaic signal and moves its RC semicircle to a more distinguishable frequency in the Nyquist plot [8].
- Verify pH: Ensure the buffer pH is stable and appropriate for your biorecognition element (e.g., pH 7.4 for many biological assays) [8].
- Re-calibrate: After changing the electrolyte, always recalibrate your system with the new solution [30] [31].
Advanced Check:
- Perform Electrochemical Impedance Spectroscopy (EIS) to generate a Nyquist plot. A well-optimized electrolyte should show a clear and distinct semicircle for the redox process. An unclear semicircle indicates a need for further optimization of ionic strength and redox concentration [8].
Guide 2: Resolving Inconsistent Sensor Response and Sensitivity Loss in FET-based Biosensors
Problem: Your silicon nanobelt Field-Effect Transistor (FET) sensor shows diminishing current shifts, unstable baseline, or reduced sensitivity when detecting biomolecules like alpha-fetoprotein (AFP).
Why This Happens:
- High Buffer Concentration: The sensitivity of FET-based sensors is negatively dependent on the buffer concentration. High ion concentrations screen the electrical field from the target molecules, reducing the sensor's response [32].
- Shortened Debye Length: A high ionic strength solution drastically reduces the Debye screening length, meaning the sensor cannot effectively "see" the charge of bound biomolecules beyond a very short distance [32].
- Ineffective Surface Functionalization: The buffer concentration can also affect the efficiency of the surface functionalization process (e.g., with APTES and Glutaraldehyde), which is critical for immobilizing capture probes [32].
Solution Steps:
- Reduce Buffer Concentration: Lower the concentration of your buffer solution (e.g., PBS). Test a range of concentrations (e.g., from 10 mM to 100 mM) to find the optimal point where sensitivity is high, and the signal remains stable [32].
- Optimize Assay Buffer: For biomolecule detection, use the lowest buffer concentration that still maintains the stability of your biorecognition elements (antibodies, DNA, etc.) [32].
- Check Functionalization: Ensure your sensor surface functionalization protocol is performed in a low-ionic-strength environment to maximize the density and activity of capture probes [32].
Frequently Asked Questions (FAQs)
FAQ 1: How do I choose between a salt like KCl and a buffered solution like PBS for my redox-based biosensor?
The choice involves a trade-off between signal strength and reproducibility.
- KCl (High Ionic Strength): Can provide a higher signal (sensitivity) but may lead to a larger standard deviation across measurements [8].
- PBS (Buffered Electrolyte): Provides a stable pH and ionic environment, leading to lower standard deviation and more reliable results, which is crucial when using a low-cost analyzer. It may slightly reduce the absolute signal but improves the overall signal-to-noise ratio [8].
- Recommendation: For optimal performance with low-cost instrumentation, a buffered electrolyte (PBS) with high ionic strength is generally preferred. The redox probe concentration should then be tuned within this buffer to minimize noise [8].
FAQ 2: Why does my pH measurement seem inaccurate when I work with high ionic strength solutions?
Standard pH probes calibrated with low ionic strength buffers can experience a shift in liquid junction potential when measuring high ionic strength samples, leading to significant pH errors [33].
- Solution: Calibrate your pH electrode using standard buffers that have been prepared with the same background electrolyte and at a similar ionic strength as your test samples. This corrects for the junction potential shift and provides an accurate pH reading [33].
FAQ 3: I am using a gravimetric biosensor (like a BAW resonator). Do buffer ions interfere with its operation?
For high-frequency (>1.3 GHz) shear-mode resonators (e.g., AlN solidly mounted resonators), the influence of conventional biological buffers (like PBS) on the electrical response is negligible, even when in direct contact with the electrodes. You can proceed without thick isolation layers, simplifying fabrication [34].
Data Presentation
Table 1: Summary of Electrolyte and Redox Probe Optimization Strategies for Different Sensor Platforms
| Sensor Platform | Recommended Electrolyte | Optimal Redox Probe Strategy | Key Optimization Parameter | Effect on Signal-to-Noise Ratio |
|---|---|---|---|---|
| Low-Cost Impedance Analyzer (e.g., ESSENCE) [8] | PBS with high ionic strength | Low concentration of [Fe(CN)6]4−/3− or [Ru(bpy)3]2+ | Balance between ionic strength (to sharpen signal) and redox concentration (to reduce noise) | Increases by reducing standard deviation and background noise from the analyzer. |
| Silicon Nanobelt FET Sensor [32] | Low concentration PBS (e.g., 10 mM) | Not typically used | Minimize buffer concentration to maximize Debye length and charge sensitivity | Increases by reducing ionic screening, leading to a larger current shift upon biomolecule binding. |
| Redox Flow Battery [21] | 4 M ZnCl2 + 2 M NaCl, pH 4.55 | The electrolyte itself is redox-active (Zn2+/Zn) | Concentration of active species and pH for stability and capacity | N/A (Optimized for energy capacity and current density, ~62.7 mA/cm²) |
| Printed Ionologic CAPode [35] | 1 M Phosphotungstic Acid (PWA) in water | Redox-active electrolyte (PWA anions) | Selection of redox couple to control working voltage window | N/A (Optimized for rectification ratio and unidirectional charge storage) |
Table 2: Impact of Buffer Concentration on FET Sensor Sensitivity (Experimental Data) [32]
| Buffer Concentration | Debye Screening Length | Sensor Sensitivity (Current Shift) | Signal Stability |
|---|---|---|---|
| Low (e.g., 10 mM PBS) | Longer | Higher | Stable and reliable |
| High (e.g., 100 mM PBS) | Shorter | Lower | Stable but with diminished response |
Experimental Protocols
Protocol 1: Optimizing Electrolyte for a Faradaic EIS Biosensor
This protocol is adapted from research on transitioning a biosensor from a high-end to a low-cost impedance analyzer [8].
1. Objective: To find the electrolyte composition (buffer ionic strength and redox probe concentration) that provides the best signal-to-noise ratio for a specific low-cost redox analyzer.
2. Materials:
- Low-cost impedance analyzer (e.g., Analog Discovery 2)
- Electrochemical cell with functionalized working electrode
- Redox probes: Potassium ferrocyanide/ferricyanide ([Fe(CN)6]4−/3−) or Tris(bipyridine)ruthenium(II) chloride ([Ru(bpy)3]2+)
- Background electrolytes: Potassium chloride (KCl) and Phosphate Buffered Saline (PBS)
- Deionized water
3. Procedure: Step 1: Prepare Electrolyte Solutions.
- Prepare a series of solutions with a fixed, low concentration of your chosen redox probe (e.g., 0.1 mM) in different background electrolytes: a) 1x PBS, b) 0.1 M KCl, c) High-strength PBS (e.g., 5x). Ensure all solutions are at the same pH (e.g., 7.4).
Step 2: Perform Impedance Spectroscopy.
- For each electrolyte solution, run an EIS measurement on your analyzer. Use the same settings (e.g., frequency range from 100 Hz to 1 MHz, AC amplitude 10 mV) for all tests.
Step 3: Analyze Nyquist Plots.
- Plot the Nyquist curve (Z'' vs Z') for each measurement.
- Identify the semicircle related to the redox process. A well-defined, distinct semicircle indicates a good signal.
Step 4: Quantify Signal and Noise.
- Record the diameter of the semicircle, which corresponds to the charge-transfer resistance (Rct).
- Perform multiple measurements (n≥3) to calculate the standard deviation for each electrolyte condition.
Step 5: Optimize Redox Concentration.
- Once the best buffer is identified (likely high ionic strength PBS), prepare a series of solutions with varying concentrations of the redox probe (e.g., from 0.05 mM to 1 mM) in that buffer.
- Repeat Steps 2-4. The optimal concentration will yield a strong Rct shift upon target binding with the lowest standard deviation.
Protocol 2: Evaluating Buffer Concentration for FET Sensor Sensitivity
This protocol is based on work investigating the effect of buffer concentration on silicon nanobelt FET sensors [32].
1. Objective: To determine the effect of buffer concentration on the sensitivity and stability of an FET sensor for pH or biomolecule detection.
2. Materials:
- Fabricated SiNB FET sensor device
- Buffer solutions of varying concentrations (e.g., 1 mM, 10 mM, 100 mM PBS)
- Target analyte (e.g., solution of different pH, or a protein like Alpha-fetoprotein)
- Source-Measure Unit (SMU) or parameter analyzer
3. Procedure: Step 1: Sensor Preparation and Functionalization.
- Clean the sensor device with ethanol and DI water [32].
- Perform oxygen plasma treatment to ensure an OH-rich surface [32].
- Functionalize the surface with appropriate receptors (e.g., using APTES and Glutaraldehyde for antibody immobilization) [32].
Step 2: Baseline Measurement in Different Buffers.
- Expose the sensor to a low-concentration buffer (e.g., 1 mM PBS) and measure the drain current (Id) at a fixed drain voltage (Vd).
- Rinse the sensor and repeat with progressively higher concentration buffers (e.g., 10 mM, 100 mM PBS). Record the baseline current for each.
Step 3: Analyze Sensitivity.
- For pH sensing: Expose the sensor to a pH change (e.g., from 6.4 to 7.4) in each buffer concentration and record the resulting current shift (ΔI). The sensitivity is ΔI/ΔpH.
- For biomolecule sensing: Introduce the target antigen (e.g., AFP) in each buffer concentration and record the current shift (ΔI) upon binding.
Step 4: Determine Optimal Concentration.
- Plot the sensitivity (current shift) against the buffer concentration. The optimal point is the lowest concentration that maintains stable sensor operation while delivering the highest sensitivity.
Mandatory Visualization
Diagram 1: Electrolyte Optimization Workflow for Redox Analyzers
Diagram 2: Ionic Strength Impact on FET Sensing
The Scientist's Toolkit
Table 3: Key Research Reagent Solutions for Electrolyte Optimization
| Reagent / Material | Function / Role in Optimization | Example Use Case |
|---|---|---|
| Phosphate Buffered Saline (PBS) | Provides a stable pH and consistent ionic strength. Reduces standard deviation in measurements compared to simple salts [8]. | Standard background electrolyte for most biosensing applications in aqueous solutions. |
| Potassium Chloride (KCl) | A simple salt used to adjust ionic strength. Can provide high signal but may have higher variance [8]. | Comparing the effect of a buffered vs. non-buffered system on signal stability. |
| Ferro/Ferricyanide ([Fe(CN)₆]â´â»/³â») | A common redox probe used in Faradaic electrochemical sensors. Undergoes reversible oxidation/reduction, generating a measurable current [8]. | Enhancing the impedimetric signal in EIS-based biosensors. |
| Tris(bipyridine)ruthenium(II) ([Ru(bpy)₃]²âº) | An alternative redox probe with different electrochemical properties than ferrocyanide [8]. | Testing different redox couples to find the one with the best electrochemistry for a specific sensor surface. |
| Phosphotungstic Acid (PWA) | A redox-active electrolyte with a Keggin structure. It serves as both the electrolyte and the active redox species [35]. | Functioning electrolyte in advanced systems like printed ionologic capacitors (CAPodes). |
| APTES [(3-Aminopropyl)triethoxysilane] | A silane coupling agent used to functionalize oxide surfaces (e.g., SiOâ‚‚) with amine (-NHâ‚‚) groups for biomolecule immobilization [32]. | Preparing the sensor surface for attaching capture antibodies or DNA probes. |
| Glutaraldehyde | A crosslinker that reacts with amine groups, used to covalently bind proteins (e.g., antibodies) to an APTES-functionalized surface [32]. | Immobilizing antibodies onto a sensor surface for specific antigen detection. |
| Aralia-saponin I | Aralia-saponin I, CAS:289649-54-3, MF:C47H76O18, MW:929.1 g/mol | Chemical Reagent |
| Ppm1A-IN-1 | Ppm1A-IN-1, MF:C16H15BrFNO2, MW:352.20 g/mol | Chemical Reagent |
Frequently Asked Questions (FAQs)
Q1: What are the key functional differences between [Fe(CN)₆]³â»/â´â» and [Ru(NH₃)₆]³âº/²⺠as redox probes? The choice between these common redox probes significantly impacts your data interpretation, especially on carbon-based electrodes. [Ru(NH₃)₆]³âº/²⺠acts as a near-ideal outer-sphere redox probe, making it excellent for directly assessing the intrinsic electron transfer rate of an electrode because its electrochemistry is largely insensitive to surface functional groups. In contrast, [Fe(CN)₆]³â»/â´â» is a surface-sensitive probe. Its electron transfer kinetics are highly dependent on the surface chemistry of the electrode, including the presence of oxygen-containing functional groups, and can exhibit quasi-reversible behavior even on well-polished carbon surfaces. Therefore, non-ideal voltammetry with [Fe(CN)₆]³â»/â´â» should not be automatically interpreted as a flawed electrode [36].
Q2: How does the choice of redox probe and its concentration affect signal-to-noise ratio in low-cost analyzers? Optimizing the redox probe and its concentration is critical for enhancing the signal-to-noise ratio (SNR), particularly when using affordable impedance analyzers. Research shows that increasing the ionic strength of the background electrolyte (e.g., using PBS) or lowering the concentration of the redox probe can shift the characteristic RC semicircle in Nyquist plots to higher frequencies, which can help minimize noise when transitioning from a high-precision benchtop analyzer to a low-cost portable device. For optimal performance with cost-effective systems, it is recommended to use a buffered electrolyte with high ionic strength and a relatively low concentration of redox probe to reduce standard deviation and overall system noise [8].
Q3: My electrochemical cell is producing an unexpected response. What is a systematic way to troubleshoot it? A logical, step-by-step approach is essential for isolating the problem.
- Dummy Cell Test: Disconnect your electrochemical cell and replace it with a 10 kΩ resistor. Run a cyclic voltammetry (CV) scan (e.g., from +0.5 V to -0.5 V at 100 mV/s). A correct response (a straight line intersecting the origin with currents of ±50 µA) confirms your potentiostat and leads are functioning properly, pointing to an issue with the cell itself [37].
- Check the Reference Electrode: If the dummy test passes, test your cell in a 2-electrode configuration by connecting the reference and counter electrode leads together to the counter electrode. A proper voltammetric response here indicates a problem with the reference electrode (e.g., clogged frit, air bubble) [37].
- Inspect the Working Electrode: If the problem persists, the issue likely lies with the working electrode surface. Check for polishing defects, adsorbed contaminants, or, in the case of modified electrodes, improper film formation or detachment from the current collector [37].
Q4: Are there environmentally friendly alternatives to synthetic redox probes like ferrocene derivatives? Yes, research is exploring more sustainable options. One promising approach is the use of the Hydrogen Evolution Reaction (HER) as an intrinsic redox probe. In acidic media, the reduction of hydronium ions (H₃O⺠+ 2e⻠→ H₂) generates a well-defined voltammetric signal. This method utilizes protons already present in the aqueous electrolyte, eliminating the need for additional, potentially toxic, synthetic redox compounds like ferrocenemethanol, thereby offering a "green" alternative for certain sensing applications [38].
Troubleshooting Guides
Guide 1: Diagnosing and Fixing Poor Signal-to-Noise Ratio
A poor SNR is a common hurdle, particularly in low-cost or miniaturized systems. The following flowchart outlines a diagnostic path.
Application Notes:
- Poor Contacts: Tarnished or loose connections are a primary source of noise. Regularly inspect and clean all connectors [37].
- Grounding & Shielding: Always place the electrochemical cell inside a grounded Faraday cage to shield it from external electromagnetic interference [37].
- Cell Configuration: Ensure all electrodes are properly immersed and the reference electrode frit is not clogged. A faulty reference electrode is a frequent culprit for signal instability [37].
- Probe & Electrolyte: As per the FAQ, fine-tuning the type and concentration of your redox probe, as well as the ionic strength of your background electrolyte, can dramatically improve SNR on low-cost platforms [8].
Guide 2: Resolving Non-Ideal Redox Probe Behavior
Deviations from ideal, reversible electrochemistry are frequent. Use this guide to diagnose the cause.
Application Notes:
- Surface-Sensitive Probes ([Fe(CN)₆]³â»/â´â»): If you are using this probe and see drawn-out peaks or a large peak separation, this may not indicate a "bad" electrode but is characteristic of its surface-sensitive nature. Ensure a clean, consistently pre-treated electrode surface for reproducible results, but do not expect perfect Nernstian behavior [36].
- Outer-Sphere Probes ([Ru(NH₃)₆]³âº/²âº): If this near-ideal probe shows non-ideal behavior, it is a stronger indicator of a fundamental problem with the electrode surface, such as heavy contamination or improper modification [36].
- Electrode Cleaning: Standard protocols for solid electrodes include mechanical polishing on alumina slurry, followed by sonication in water and ethanol to remove adsorbed particles and organic contaminants.
Experimental Protocols & Data
Protocol 1: Optimizing Electrolyte and Redox Probe for Low-Cost EIS
Objective: To find the optimal combination of electrolyte and redox probe concentration that provides a strong, stable impedimetric signal with low noise on a low-cost analyzer [8].
Materials:
- Phosphate Buffered Saline (PBS), 1X, pH 7.4
- Potassium Chloride (KCl)
- Potassium ferricyanide (K₃[Fe(CN)₆]) / Potassium ferrocyanide (K₄[Fe(CN)₆])
- Tris(2,2'-bipyridine)ruthenium(II) chloride ([Ru(bpy)₃]Cl₂)
- Low-cost impedance analyzer (e.g., Analog Discovery 2)
Methodology:
- Prepare Solutions: Create a matrix of solutions varying:
- Electrolyte: PBS (pH-buffered) vs. KCl (unbuffered).
- Redox Probe: [Fe(CN)₆]³â»/â´â» and [Ru(bpy)₃]²âº.
- Concentration: Test a range for each probe (e.g., 0.1 mM to 5 mM).
- Impedance Measurement: For each combination, run EIS measurements.
- Settings: Frequency range 0.1 Hz - 100 kHz, amplitude 10 mV.
- Use the same electrode system for all tests.
- Data Analysis: Plot Nyquist plots for each condition. Observe the size and frequency location of the semicircle(s). Calculate the Signal-to-Noise Ratio (SNR) using the formula appropriate for your detector (e.g., RMS method for analog systems) [39].
Expected Outcome: You will typically find that a buffered electrolyte (PBS) with high ionic strength, combined with a lower concentration of redox probe, yields a stable signal with lower standard deviation, which is crucial for obtaining a good SNR on low-cost analyzers [8].
Protocol 2: Characterizing a Modified Electrode Surface
Objective: To systematically track the successful modification of an electrode surface using CV and EIS.
Materials:
- Screen-printed or planar carbon/gold electrode.
- Redox probe solution: 5 mM [Fe(CN)₆]³â»/â´â» in 0.1 M KCl (or [Ru(NH₃)₆]³⺠for comparison).
- Modification reagents (e.g., antibodies, polymers, nanoparticles).
Methodology:
- Baseline Measurement: Perform CV and EIS with the bare, clean electrode in the redox probe solution.
- Apply Modification Layer: Immobilize your recognition element (e.g., antibody via EDC/NHS chemistry, electropolymerize a film).
- Post-Modification Measurement: After rinsing, perform CV and EIS again in the same redox probe solution.
- Final Measurement: After exposure to the target analyte, perform a final set of CV and EIS measurements.
Expected Outcome: With each successive addition of a non-conductive layer (e.g., protein, polymer), you should observe a decrease in the CV peak current and an increase in the charge-transfer resistance (Rct) in the EIS Nyquist plot. This confirms the build-up of layers that hinder the redox probe's access to the electrode surface [40].
Quantitative Data Comparison
Table 1: Comparison of Common Redox Probes for Sensor Characterization [36] [8].
| Property | [Fe(CN)₆]³â»/â´â» | [Ru(NH₃)₆]³âº/²⺠| [Ru(bpy)₃]²⺠|
|---|---|---|---|
| Electron Transfer Kinetics | Quasi-reversible, surface-sensitive | Near-ideal, outer-sphere | Reversible |
| Primary Use Cases | General sensor characterization, signal generation in MIP sensors | Assessing intrinsic electron transfer rates, fundamental studies | ECL sensors, impedimetric signal enhancement |
| Sensitivity to Surface Chemistry | High | Low | Moderate |
| Approx. Cost | Low | High | High |
| Environmental Impact | Moderate (cyanide source) | Low | Low |
Table 2: Key Research Reagent Solutions and Their Functions.
| Reagent | Function/Application | Key Consideration |
|---|---|---|
| Ferro/Ferricyanide ([Fe(CN)₆]³â»/â´â») | Common, inexpensive redox probe for CV and EIS characterization. | Surface-sensitive; kinetics vary with electrode material and history [36]. |
| Tris(bipyridine)ruthenium(II) ([Ru(bpy)₃]²âº) | Used in ECL biosensors and for impedimetric signal enhancement. | Provides high sensitivity and low background noise [41] [8]. |
| Hexaammineruthenium ([Ru(NH₃)₆]³âº/²âº) | Outer-sphere redox probe for reliable electron transfer rate assessment. | Ideal for characterizing electrode surfaces without interference from surface chemistry [36]. |
| Hydrogen Evolution Reaction (HER) | Environmentally friendly, intrinsic redox probe in acidic media. | Eliminates need for synthetic redox mediators; useful for "green" sensor designs [38]. |
| o-Phenylenediamine (o-PD) | Monomer for electropolymerization of Molecularly Imprinted Polymers (MIPs). | Creates selective cavities for target analytes on electrode surfaces [38]. |
| Nafion | Cation-exchange polymer used to form permselective membranes on electrodes. | Enhances robustness and can improve sensitivity by pre-concentrating cationic species [40]. |
| Magnetic Beads (MBs) | Used for target capture, preconcentration, and signal amplification. | Can be manipulated magnetically to simplify washing and enhance selectivity [42]. |
FAQs
Q1: What are the most effective strategies for improving the signal-to-noise ratio (SNR) in a low-cost redox analyzer?
Beyond proper grounding and calibration, leveraging signal processing techniques is highly effective. Research shows that using lock-in amplification can significantly enhance SNR. In one study, switching from DC detection to an analog lock-in amplifier (LIA) mode increased the signal-to-noise ratio by 30 dB for a redox-based gas sensor, extending its detection limit from ppm to ppb levels [43]. Furthermore, implementing predictive maintenance based on equipment performance data can prevent signal drift caused by degrading components [44].
Q2: My redox analyzer shows erratic or fluctuating readings. What are the most common causes?
Erratic readings are a common issue and typically point to a few key areas [30]:
- Sensor Fouling: The sensor electrode can become clogged or coated with material from the sample, especially in water treatment or chemical plant applications.
- Calibration Drift: Improper or infrequent calibration is a leading cause of inaccurate values. Regular calibration against a standard solution is essential.
- Electrical Interference: Poor grounding or external electrical noise can introduce significant signal instability.
- Electrode Degradation: Over time, electrodes age and can become polarized, leading to consistent measurement errors.
Q3: How does the Kalman filter function, and why is it relevant to redox signal processing?
The Kalman filter is an algorithm that estimates the true state of a system from a series of noisy measurements over time. It works in a two-step recursive process [45]:
- Prediction: It predicts the system's next state (e.g., the expected redox potential) based on its model of the system dynamics.
- Update: It then updates this prediction by incorporating a new, noisy measurement, weighing the new data against the prediction based on their estimated uncertainties.
For redox analyzers, this is relevant because it can optimally combine a stream of noisy sensor readings with a model of the measurement process to produce a smoother, more accurate, and more reliable estimate of the true redox potential in real-time [45].
Troubleshooting Guides
Problem: Inaccurate ORP/Redox Readings
| Symptom | Possible Cause | Diagnostic Steps | Solution |
|---|---|---|---|
| Fluctuating readings or values not matching expected conditions [30]. | Improper calibration; Sensor malfunction. | Check calibration with a standard solution [46]. | Recalibrate the analyzer; Clean or replace the sensor [30]. |
| Consistent measurement errors from the electrodes [30]. | Electrode polarization; Aged electrodes. | Inspect electrodes for physical damage or wear. | Replace old electrodes; Ensure proper installation and alignment [30]. |
| Erratic signals or incorrect values [30]. | Poor grounding; External electrical interference. | Verify electrical continuity to ground with a multimeter [30]. | Ensure the analyzer is properly grounded. |
Problem: Poor Signal-to-Noise Ratio
| Symptom | Possible Cause | Diagnostic Steps | Solution |
|---|---|---|---|
| Signal is noisy, obscuring low-level analyte detection [43]. | Fundamental electrical noise; Limited sensor sensitivity. | Compare the signal in a blank solution to the sample signal. | Implement lock-in amplification to move signal measurement to a frequency domain with less noise [43]. |
| Noisy signal, especially in dynamic systems. | Noisy sensor data and unmodeled external factors. | Observe if the noise remains after sensor maintenance. | Apply a Kalman filter to smooth the data stream and provide a better estimate of the true state [45]. |
| Signal degradation over time. | Sensor fouling or component aging. | Review data logs for a gradual increase in signal baseline noise [30]. | Perform proactive sensor cleaning and maintenance based on a predictive schedule [44]. |
Experimental Protocols
Protocol 1: Calibrating an ORP/Redox Probe
This protocol provides the foundational step for ensuring measurement accuracy [46].
Materials:
- ORP probe connected to a controller.
- 650 mV ORP buffer solution.
- A glass of clean water (e.g., deionized water).
Workflow:
Methodology:
- Isolate the controller from the process flow to prevent fluid loss [46].
- Unscrew and carefully remove the ORP probe from its housing [46].
- Rinse the probe tip with clean water to remove any residue and gently shake off excess water [46].
- On the controller, access the calibration menu and select the option for mV calibration [46].
- Immerse the probe into the 650 mV buffer solution, ensuring the sensing part is fully covered [46].
- Wait for the mV reading displayed on the screen to stabilize [46].
- Once stable, calibrate the probe by setting the reading to the known value of the buffer solution (650 mV) [46].
- Save the calibration data. Remove the probe, rinse it again with clean water, and shake off the excess [46].
- Place the probe back into its housing, tighten it, and restore the flow to the controller [46].
Troubleshooting: If the reading in the buffer solution does not stabilize near the expected value (e.g., 650 mV), the probe is likely degraded and needs replacement [46].
Protocol 2: Implementing Lock-in Amplification for SNR Enhancement
This protocol is based on published research demonstrating a 30 dB improvement in SNR for a nanospring redox sensor [43].
Materials:
- Redox sensor (e.g., chemiresistor).
- Lock-in amplifier (analog or digital).
- Signal generator for reference frequency.
- Data acquisition system.
Workflow:
Methodology:
- AC Excitation: Instead of using a constant DC voltage to probe the sensor, apply a low-amplitude AC voltage at a specific frequency (the reference frequency) to the sensor [43].
- Sensor Response: The redox sensor's resistance will modulate in response to the analyte, altering the AC signal passing through it. This response signal is weak and buried in noise.
- Signal Demodulation: The lock-in amplifier receives this noisy signal. It uses the original reference frequency to perform phase-sensitive detection. This process effectively rejects all noise components that are not at the exact reference frequency [43].
- Output: The output is a clean, low-noise DC voltage that is proportional to the change in the sensor's resistance, thereby reflecting the analyte concentration. The study achieved this with an analog lock-in amplifier, which extended the detection limit to the ppb range [43].
Table 1: Signal-to-Noise Enhancement Using Lock-in Amplification Data adapted from a study on a ZnO-coated nanospring redox sensor [43].
| Detection Mode | Analyte Concentration | Signal-to-Noise Ratio (SNR) | Detection Limit |
|---|---|---|---|
| DC | 10 ppm Toluene Vapor | 5 dB | 10 ppm level |
| Analog Lock-in Amplifier (LIA) | 10 ppm Toluene Vapor | 35 dB (30 dB increase) | Extends to ppb range |
The Scientist's Toolkit
Table 2: Essential Research Reagent Solutions for Redox Experiments
| Item | Function/Brief Explanation |
|---|---|
| ORP Buffer Solution | A standard solution with a known, stable redox potential (e.g., 650 mV) used for the regular calibration of ORP/redox analyzers to ensure measurement accuracy [46]. |
| Lock-in Amplifier | A precision instrument that uses phase-sensitive detection to extract a signal of a known frequency from an extremely noisy environment. Critical for enhancing SNR in low-cost sensors [43]. |
| Kalman Filter Algorithm | A recursive algorithm that optimally estimates the true state of a system by combining a series of noisy measurements. Can be implemented in software to smooth real-time data from redox sensors [45]. |
| Data Analytics & Visualization Software | Software platforms (e.g., Tableau, Power BI) are used to monitor production metrics, machine performance, and quality control data. They help identify trends, bottlenecks, and signal drift in experimental setups [44]. |
| (-)-Hinesol | (-)-Hinesol, MF:C15H26O, MW:222.37 g/mol |
| IT-143B | IT-143B, MF:C28H41NO4, MW:455.6 g/mol |
Troubleshooting Guides
G1: Addressing Erratic or Noisy Signals
Problem: Your analyzer is producing unstable, drifting, or overly noisy readings, making it difficult to distinguish the true signal.
Q1: Could my redox mediator be degrading or causing interference?
- A: Yes. Redox mediators can decompose over time or interact with sample components. Furthermore, at high concentrations (typically exceeding 1 mM), some common mediators like ferro/ferricyanide and ferrocene methanol can increase reactive oxygen species and negatively impact the health of biological samples, which may manifest as signal instability [47]. Always use fresh mediator solutions and consult cytotoxicity studies to select an appropriate concentration for your application [47].
Q2: Is the ionic strength of my background electrolyte optimized?
- A: The ionic strength of electrolytes like PBS or KCl significantly impacts impedimetric signals. A suboptimal ionic strength can lead to poor charge transfer and noisy data. Research indicates that using a buffered electrolyte with high ionic strength can lower standard deviation and reduce overall signal noise, which is crucial when using low-cost analyzers [8]. Perform a systematic study to find the optimal electrolyte concentration for your specific system.
Q3: Is there a problem with my electrode's physical or chemical state?
- A: Absolutely. Electrode fouling, a clogged reference junction, or physical damage can cause erratic signals [30] [31].
- Fouling/Clogging: Gently clean the electrode based on the sample matrix. For biological residues, soak in a 1:1 bleach solution for 15-30 minutes. For hard inorganic deposits, a short soak in 0.1M HCl or vinegar can be effective [48].
- Damage: Inspect the electrode for any cracks in the glass bulb or other physical damage. If found, the electrode must be replaced [48].
- Drying Out: An electrode that has been allowed to dry out can be permanently damaged. Always store it in a recommended storage solution (e.g., pH 4 buffer or 3 M KCl) and never in deionized water [48].
- A: Absolutely. Electrode fouling, a clogged reference junction, or physical damage can cause erratic signals [30] [31].
G2: Resolving Poor Sensitivity and Low Signal Response
Problem: The measured signal is weaker than expected, leading to poor detection limits.
Q4: Have I selected the right redox mediator and concentration?
- A: The choice and concentration of the redox probe are critical for signal enhancement in Faradaic sensors. Studies show that different mediators (e.g.,
[Ru(bpy)3]2+vs. ferro/ferricyanide) behave differently in various electrolytes [8]. Lowering the redox probe concentration can sometimes enhance the sensor response and reduce noise, improving effective sensitivity [8]. Refer to the table below for a comparison of common mediators.
- A: The choice and concentration of the redox probe are critical for signal enhancement in Faradaic sensors. Studies show that different mediators (e.g.,
Q5: Is my electrode properly calibrated and functioning?
- A: Improper calibration is a leading cause of accuracy problems [30].
- Calibration: Always use fresh, unexpired pH buffers that bracket your expected measurement range. Perform at least a 2-point calibration, starting with pH 7 buffer [48].
- Aging: pH and ORP electrodes have a finite lifespan, typically 12-18 months, even if unused. An aged electrode will exhibit a slower response and a change in its calibration slope [48].
- A: Improper calibration is a leading cause of accuracy problems [30].
Q6: Could my sample matrix be suppressing the signal?
- A: Yes. Complex sample matrices can cause "matrix effects," where other components inhibit the redox reaction. The use of Ion Chromatography coupled with Mass Spectrometry (IC-MS) is particularly advantageous here, as its high retention of polar molecules and selectivity helps overcome complex matrix interferences [49]. For electrochemical systems, implementing a sample purification or pre-concentration step may be necessary.
Frequently Asked Questions (FAQs)
Q1: What is the single most important practice for maintaining signal clarity in a low-cost redox analyzer? A: Consistent and proper electrode maintenance is paramount. This includes regular cleaning to prevent fouling, correct storage to prevent drying, and frequent calibration using fresh buffers [30] [48]. A well-maintained, clean electrode is the foundation of a low-noise measurement.
Q2: How can I reduce costs without sacrificing signal quality in my redox flow battery research? A: Consider an open-source approach to equipment design. Utilizing fabrication methods like 3D printing and laser cutting to create essential components like flow cells can drastically reduce financial barriers. Studies show that such open-design equipment can provide a versatile and efficient platform for research, preserving performance while minimizing cost [50].
Q3: Why is the background electrolyte so important, and how do I choose one? A: The background electrolyte facilitates charge transport and its composition (ionic strength, pH, ion type) directly influences the interaction of redox molecules with the electrode surface [8]. For example, using a phosphate buffer like PBS often results in a lower standard deviation compared to KCl, albeit with a potentially lower overall signal sensitivity. The choice should be optimized for your specific analyte and sensor design [8].
Q4: My experiments involve live cells. What should I consider regarding redox mediators? A: Recent comprehensive studies show that common redox mediators can impact cell health at concentrations exceeding 1 mM, leading to increased reactive oxygen species and reduced cell viability [47]. It is crucial to use the lowest effective concentration of mediator and to validate that your chosen concentration does not interfere with the biological system under investigation.
Data Presentation Tables
Table 1: Common Redox Mediators and Their Operational Characteristics
| Mediator | Typical Concentration Range | Key Considerations & Bio-impact | Best Suited For |
|---|---|---|---|
| Ferro/Ferricyanide([Fe(CN)₆]â´â»/³â») | µM to mM | At >1 mM, can increase ROS and reduce cell viability in bio-systems [47]. Readily available and low-cost. | General purpose electrochemistry, flow batteries [51], Faradaic EIS [8]. |
| Tris(bipyridine)ruthenium(II) ([Ru(bpy)₃]²âº) | µM to mM | Used in electrochemiluminescence (ECL); properties differ from ferrocyanide in various buffers [8]. | ECL applications, sensitized photoelectrochemistry. |
| Ferrocene Methanol (FcMeOH) | µM to mM | As with others, concentrations >1 mM can be detrimental to cell health, hindering migration and growth [47]. | Bio-electrochemistry where a metal-free mediator is preferred. |
| Quinone/Hydroquinone | Varies | Common in organic-based redox flow batteries; offers potential for low-cost, sustainable electrolytes [51]. | Aqueous Organic RFBs, sustainable energy storage. |
Table 2: Optimized Electrolyte and Redox Probe Formulations for Low-Cost Analyzers
This table summarizes findings from research on optimizing electrolytes for use with low-cost impedance analyzers to maximize signal-to-noise ratio [8].
| Parameter | Sub-optimal Condition | Optimized Recommendation | Effect on Signal |
|---|---|---|---|
| Electrolyte Type | Low ionic strength KCl | High ionic strength PBS buffer | Reduces standard deviation and overall system noise [8]. |
| Redox Concentration | High concentration (>5mM) | Lowered concentration | Can enhance sensor response and minimize noise from migrating to the low-cost analyzer [8]. |
| Analyzer Choice | Expensive Benchtop Analyzer (~$50k) | Low-Cost USB Oscilloscope (e.g., Analog Discovery 2, ~$200) | With optimized electrolyte/redox conditions, similar sensitivity can be achieved at a fraction of the cost [8]. |
Experimental Protocols
P1: Protocol for Systematically Optimizing Redox Probe and Electrolyte
Objective: To determine the combination of redox mediator concentration and background electrolyte ionic strength that yields the highest signal-to-noise ratio for a given low-cost analyzer.
Materials:
- Low-cost impedance analyzer (e.g., Analog Discovery 2)
- Your electrochemical cell or sensor
- Stock solutions of redox mediator (e.g., 100 mM ferro/ferricyanide)
- Stock solutions of background electrolytes (e.g., 1M PBS pH 7.4, 1M KCl)
- Deionized water
Methodology:
- Prepare Electrolyte Matrix: Create a series of solutions with a fixed, high ionic strength of your background electrolyte (e.g., 1x PBS). Into these, spike your redox mediator at varying concentrations (e.g., 0.1, 0.5, 1.0, 2.0 mM).
- Impedance Measurement: For each solution, run a full impedance spectrum (e.g., from 100 Hz to 1 MHz) using your low-cost analyzer.
- Data Analysis: Plot the Nyquist curves for each measurement. The optimal condition is typically identified by a well-defined, reproducible semicircle with the lowest standard deviation across replicates at the frequency range of interest [8].
- Validation: Validate the optimized condition by measuring a known concentration of your target analyte and calculating the signal-to-noise ratio.
P2: Protocol for Electrode Cleaning and Re-conditioning
Objective: To restore electrode performance and signal clarity by removing surface contaminants.
Materials:
- pH/ORP electrode
- 0.1M HCl or NaOH solution
- Vinegar (for inorganic deposits)
- 1:1 dilution of household bleach in water (for organic/biofouling)
- Appropriate storage solution (pH 4 buffer or 3M KCl)
Methodology:
- Rinse: Rinse the electrode thoroughly with deionized water to remove loose debris.
- Select Cleaning Solvent:
- For organic or biological fouling, soak the electrode in a 1:1 bleach solution for 15-30 minutes [48].
- For inorganic scaling, soak the electrode in 0.1M HCl or vinegar for 3-5 minutes [48].
- For stubborn lab-based contaminants, a heated (≤50°C) 0.1M HCl or NaOH soak for 5 minutes may be required [48].
- Rinse Again: After soaking, rinse the electrode thoroughly with deionized water.
- Re-condition: For best results, soak the cleaned electrode in its storage solution for at least 1 hour before recalibration.
- Calibrate: Perform a fresh 2-point calibration before use [48].
Signaling Pathways and Workflows
The Scientist's Toolkit: Essential Research Reagent Solutions
| Item | Function | Key Consideration |
|---|---|---|
| Phosphate Buffered Saline (PBS) | Provides a stable, buffered background electrolyte with high ionic strength to control pH and facilitate charge transport. | Using PBS instead of KCl can lead to a lower standard deviation in measurements [8]. |
| Potassium Ferro/Ferricyanide | A common, low-cost redox couple that undergoes reversible electron transfer, generating a measurable Faradaic current. | Concentrations >1 mM may be cytotoxic in bio-applications. Performance varies with electrolyte type [47] [8]. |
| Tris(bipyridine)ruthenium(II) Chloride | A versatile redox mediator and luminophore used in electrochemiluminescence (ECL) and other sensitized electrochemical applications. | Offers different electrochemical properties compared to ferrocyanide, allowing for method optimization [8]. |
| Nafion Membrane | A proton-exchange membrane used in redox flow batteries and some sensors to separate half-cells while allowing ion transport. | Requires pre-treatment (boiling in Hâ‚‚Oâ‚‚, acid) to remove impurities and activate ion channels before use [50]. |
| pH Buffer Solutions (4, 7, 10) | Used for accurate calibration of pH and ORP electrodes, establishing the slope and zero point. | Must be fresh and unexpired. Re-use or old buffers are a primary cause of calibration failure [48]. |
| 11-Deoxy-13-dihydrodaunorubicin | 11-Deoxy-13-dihydrodaunorubicin, MF:C27H31NO9, MW:513.5 g/mol | Chemical Reagent |
| Axinysone B | Axinysone B, MF:C15H22O2, MW:234.33 g/mol | Chemical Reagent |
Transitioning a biosensor platform from a high-end, expensive impedance analyzer to a low-cost alternative is a critical step in making diagnostic technology accessible and affordable for point-of-care (POC) settings. This case study details the process of adapting the ESSENCE biosensor platform to function with a significantly cheaper USB oscilloscope, the Analog Discovery 2 (~$200), from a benchtop Keysight 4294A Precision Impedance Analyzer (~$50,000), a price difference of around 100 times [8]. The core challenge in this transition is maintaining a high signal-to-noise ratio (SNR) and detection sensitivity while using the lower-cost hardware. Success hinges on the strategic optimization of the chemical environment, specifically the interplay between the background electrolyte and the redox probe [8].
The ESSENCE Platform is an electrochemical sensor that uses a shear-enhanced, flow-through nanoporous capacitive electrode. A microfluidic channel is packed with a nano-porous material (like functionalized single-walled carbon nanotubes) and sandwiched between a top and bottom three-dimensional interdigitated micro-electrode array (NP-µIDE). This design enhances selectivity by leveraging analyte flow through the porous layer to create shear forces that mitigate non-specific adsorption [8].
Key Definitions:
- Faradaic Sensor: A label-free electrochemical biosensor that uses a small, electrochemically sensitive compound (redox probe) added to the bulk electrolyte. The redox probe undergoes reduction or oxidation at the electrode surface, generating a Faradaic current that enhances the impedimetric signal from the biorecognition event [8].
- Signal-to-Noise Ratio (SNR): A measure comparing the level of a desired signal to the level of background noise. A high SNR is crucial for a sensitive and reliable biosensor. Optimizing the electrolyte and redox probe is a primary method for maximizing SNR in low-cost systems [8].
Troubleshooting Guides and FAQs
Frequently Asked Questions (FAQs)
Q1: What is the primary cause of a high noise level and unstable baseline when switching to a low-cost analyzer? A: The most common cause is a suboptimal combination of redox probe concentration and background electrolyte ionic strength. A high redox concentration or low ionic strength can shift the RC semicircle in the Nyquist plot to lower frequencies, increasing noise and instability. This effect is more pronounced on low-cost analyzers [8].
Q2: How can I improve the sensitivity of my biosensor after moving to a cheaper analyzer? A: Systematically optimize your chemical environment. Use a buffered electrolyte like Phosphate Buffered Saline (PBS) with high ionic strength and lower the concentration of your redox probe. This combination reduces standard deviation and minimizes noise, effectively boosting the signal-to-noise ratio for the low-cost system [8].
Q3: My calibration is inconsistent. What should I check? A: Follow this checklist:
- Buffer: Use a fresh, correctly diluted buffer that matches your sensor's pH range. Old or contaminated buffer can degrade performance [52].
- Standards: Ensure your calibration standards are fresh and have known, precise pH values. Old standards can lead to calibration drift [52].
- Sensor: Inspect the sensor for physical damage or clogging. Clean the sensor with distilled water or a suitable solvent to remove any biofilm or debris [52].
- Calibration Protocol: Follow the manufacturer's instructions precisely, allowing sufficient time for ion diffusion in the probe during each measurement [52].
Q4: Why is the shelf-life and operational stability of my biosensor a concern? A: Stability is a major challenge in biosensor commercialization. Shelf stability is related to the activity retention of the biological recognition element (e.g., enzyme, antibody). Operational stability involves the reusability of the device. For single-use biosensors, shelf-stability is the key issue, influenced by the storage environment. Using a stabilized, buffered electrolyte system can help improve consistency [53].
Troubleshooting Guide Table
| Problem Symptom | Potential Cause | Recommended Solution |
|---|---|---|
| High noise and unstable signal [8] | Suboptimal redox/electrolyte mixture; high redox concentration. | Lower redox probe concentration; increase electrolyte ionic strength. |
| Low sensitivity and attenuated signal [8] | Non-specific adsorption on electrode; suboptimal redox enhancement. | Use buffered electrolyte (e.g., PBS); employ flow-through design to enhance shear force and reduce fouling. |
| Inconsistent readings and calibration drift [52] | Expired or contaminated buffer solutions; dirty or damaged sensor. | Prepare fresh buffer and calibration standards; clean sensor with distilled water. |
| Signal loss over time or after storage [53] | Degradation of the biological recognition element (e.g., enzyme). | Ensure proper storage conditions (correct buffer, temperature); check sensor expiration date. |
Experimental Protocols & Optimization
Protocol 1: Optimizing Electrolyte and Redox Probe for Low-Cost Analyzers
This protocol is fundamental to successfully transitioning to a low-cost analyzer, as it directly addresses the core challenge of maintaining signal-to-noise ratio [8].
Objective: To find the optimal combination of background electrolyte and redox probe that minimizes noise and maximizes signal clarity on a low-cost impedance analyzer.
Materials and Reagents:
- Low-cost Impedance Analyzer (e.g., Analog Discovery 2)
- Fabricated ESSENCE biosensor chip or similar electrochemical cell
- Background Electrolytes: Potassium Chloride (KCl) and Phosphate Buffered Saline (PBS), pH 7.4
- Redox Probes: Potassium ferrocyanide(II)/ferricyanide(III) (e.g.,
[Fe(CN)6]4−/3−), Tris(bipyridine)ruthenium(II) chloride ([Ru(bpy)3]2+) - Automatic fluidic control system (e.g., from Labsmith Inc.)
- Data analysis software (e.g., provided with the analyzer)
Methodology:
- Baseline Measurement: Begin with a standard electrolyte, such as 1X PBS.
- Systematic Variation:
- Prepare a series of solutions with a constant, high ionic strength of your electrolyte (e.g., PBS) while varying the concentration of your chosen redox probe (e.g., from 0.1 mM to 5 mM).
- Alternatively, prepare solutions with a constant, low concentration of redox probe while varying the ionic strength of the electrolyte (e.g., by adding NaCl).
- Impedance Measurement: For each prepared solution, run a full impedance spectroscopy scan using the low-cost analyzer across a relevant frequency range (e.g., 100 Hz to 1 MHz).
- Data Analysis: Plot the results as Nyquist plots (imaginary impedance, -Z'' vs real impedance, Z'). Observe the characteristics of the semicircle(s).
- Goal: Identify the condition where the RC semicircle related to the redox activity is distinct and located at a higher frequency. This shift indicates faster electron transfer kinetics and is associated with a more stable, lower-noise signal on the low-cost device [8].
- Selection: Choose the electrolyte/redox probe combination that provides the clearest, most stable semicircle at the highest frequency for your specific biosensor application.
Visual Guide: Electrolyte and Redox Probe Optimization Workflow
The diagram below outlines the logical workflow for optimizing your biosensor's chemical environment.
The Scientist's Toolkit: Essential Research Reagents
The successful optimization of a biosensor for a low-cost analyzer relies on a carefully selected set of chemical reagents. The table below details key components and their functions in the system.
Research Reagent Solutions
| Reagent | Function / Role in Optimization | Key Consideration |
|---|---|---|
| Phosphate Buffered Saline (PBS) | A buffered background electrolyte that maintains a stable pH (e.g., 7.4), providing a consistent chemical environment for biorecognition events. It often results in a lower standard deviation than simple salts like KCl [8]. | Use high ionic strength to improve signal stability. Always prepare fresh and check for contamination [52]. |
| Ferro/Ferricyanide Redox Couple | A common and inexpensive redox probe ([Fe(CN)6]4−/3−) that undergoes facile electron transfer, generating a strong Faradaic current used to monitor binding events at the electrode surface [8]. |
Lower concentrations are often optimal for low-cost analyzers to prevent signal overlap and noise [8]. |
| Tris(bipyridine)ruthenium(II) | An alternative redox probe ([Ru(bpy)3]2+) that can be used to fine-tune electrochemical properties and signal characteristics compared to the ferrocyanide system [8]. |
The choice of redox molecule type significantly changes the Nyquist curve; testing multiple probes can be beneficial [8]. |
| Functionalized SWCNTs | Single-walled carbon nanotubes used to create a high-surface-area, nanoporous packing material within the microfluidic channel. This maximizes the area available for immobilizing biorecognition elements (e.g., antibodies, DNA) [8]. | Must be properly functionalized (e.g., with carboxylic acid groups) for effective biomolecule attachment. |
| Calibration Buffer Standards | Solutions with precisely known pH values (e.g., pH 4.01, 7.00, 10.01) used to calibrate the sensor system and ensure accurate and reproducible measurements [52]. | Must be fresh and high-quality. Old or contaminated standards are a primary source of calibration error and drift [52]. |
| Clavariopsin A | Clavariopsin A, MF:C59H95N9O14, MW:1154.4 g/mol | Chemical Reagent |
| Oils, Melaleuca | Oils, Melaleuca, CAS:82322-26-7, MF:C28H60O4P2S4Zn, MW:716.4 g/mol | Chemical Reagent |
Data Presentation and Analysis
The following table summarizes the core performance data from the case study, comparing the high-end and low-cost analyzer after optimization [8].
| Performance Metric | Keysight 4294A Analyzer | Analog Discovery 2 (After Optimization) | Notes / Context |
|---|---|---|---|
| Unit Cost | ~$50,000 | ~$200 | Price difference ~100x [8]. |
| Optimal Electrolyte | KCl or PBS | PBS (Buffered) | PBS provided lower standard deviation, crucial for low-cost system [8]. |
| Redox Probe Strategy | Can tolerate higher concentrations | Lower concentrations optimal | Lowering redox concentration minimizes noise in the low-cost system [8]. |
| Detection Limit | Low (Reference) | Similar, low achieved | With optimization, the low-cost analyzer achieved a similar lowered detection limit [8]. |
| Primary Advantage | High precision and built-in advanced features | Extreme cost savings, portability, sufficient for optimized POC applications | The core trade-off is cost versus convenience, mitigated by chemical optimization [8]. |
Visual Guide: Signal-to-Noise Optimization Logic
This diagram illustrates the cause-and-effect relationships behind key optimization strategies for improving the Signal-to-Noise Ratio in a low-cost biosensor system.
Frequently Asked Questions (FAQs)
1. What is the simplest way to improve the Signal-to-Noise Ratio (SNR) in my data?
Signal averaging is one of the most straightforward techniques. Because your signal is determinate (fixed) while noise is random (indeterminate), averaging multiple scans of the same signal causes the noise to average toward zero while the coherent signal adds up. The SNR improves with the square root of the number of scans (n): SNR_n = √n * SNR_1 [54]. For example, averaging 4 scans improves the SNR by a factor of 2, and averaging 16 scans improves it by a factor of 4 [54].
2. My data is contaminated with sharp, impulsive spikes. Which filter should I use? For "salt-and-pepper" or other impulsive noise, a median filter is highly effective [55] [56]. This non-linear filter replaces each data point with the median value of its neighboring points within a specified window. It is robust against outliers because a single outlier has minimal effect on the median value, unlike a simple moving average [57].
3. How can I denoise a signal when the noise and signal frequencies overlap? If the noise and signal occupy similar frequency bands, spatial domain or wavelet-based techniques are preferable. The Bilateral Filter is a non-linear, edge-preserving filter that smooths images while protecting edges by considering both spatial proximity and intensity similarity [56]. Alternatively, Wavelet Transform denoising is powerful for non-stationary signals, as it can localize signal features in both time and frequency, allowing you to threshold noisy coefficients [57].
4. What is the key challenge in image denoising, and how do modern methods address it? The core challenge is that image denoising is an "ill-posed" inverse problem; there is no unique solution for retrieving the clean image from a noisy one [55] [56]. The goal is to smooth flat areas while protecting edges, preserving textures, and avoiding new artifacts [56]. Modern methods use strong prior information about natural images, such as Non-Local Self-Similarity (NSS), which leverages the fact that similar patches exist at different locations in an image to better distinguish noise from structure [56].
5. Can I use a low-cost analyzer for research-grade impedance measurements? Yes, with optimized experimental conditions. One study successfully transitioned an impedance-based biosensor (ESSENCE) from a ~$50,000 benchtop analyzer (Keysight 4294A) to a ~$200 portable USB oscilloscope (Analog Discovery 2) by carefully optimizing the electrolyte and redox probe concentrations to minimize signal variance and noise [8]. This involved using a buffered electrolyte like PBS with high ionic strength and lowering the redox probe concentration [8].
Troubleshooting Guide
| Symptom | Possible Cause | Solution |
|---|---|---|
| Blurred edges and loss of fine details [56] | Over-smoothing from linear filters (e.g., Mean or Gaussian filters). | Switch to an edge-preserving filter such as a Median filter for impulsive noise or a Bilateral filter for Gaussian noise [55] [56]. |
| Stair-casing effect in flat image regions [56] | Use of Total Variation (TV) denoising. | Consider using a denoising method that incorporates a Non-Local Self-Similarity (NSS) prior, like Non-Local Means (NLM), which does not rely solely on local gradients [56]. |
| Ineffective noise removal with averaging | The signal or instrument drift is unstable over time. | Ensure signal stability. For real-time applications, implement an exponential averager (a recursive moving average) which uses a smoothing constant (α) to place more weight on recent measurements [58]. |
| Poor denoising of signals with varying frequency content | Use of Fourier Transform, which assumes a stationary signal. | Apply Wavelet Transform denoising. It handles non-stationary signals well by performing localized analysis, allowing you to threshold noisy coefficients at different frequency bands [57]. |
| High signal variance with a low-cost analyzer [8] | Suboptimal electrolyte composition and redox probe concentration. | Optimize your background electrolyte. Using a buffered electrolyte like PBS with high ionic strength and lowering the concentration of the redox probe (e.g., ferro/ferricyanide) can reduce standard deviation [8]. |
Comparative Analysis of Denoising Techniques
The table below summarizes key denoising methods to help you select the most appropriate one.
| Technique | Domain | Key Principle | Best for / Advantages | Limitations |
|---|---|---|---|---|
| Signal Averaging [54] | Time | Improves SNR by √n through summing multiple scans. | Stationary signals; simple implementation. | Requires multiple, identical scans; ineffective for non-stationary signals. |
| Moving Average [57] | Time / Spatial | Replaces each point with the average of its neighbors. | Fast computation; effective for high-frequency noise. | Blurs sharp edges and sudden signal changes [57]. |
| Gaussian Smoothing [55] [57] | Time / Spatial | Convolves signal with a Gaussian kernel for weighted averaging. | Effective Gaussian noise reduction; simple. | Sensitive to kernel size (σ); can blur details; assumes Gaussian noise [57]. |
| Median Filter [55] [56] | Spatial | Replaces each pixel with the median of neighboring values. | Impulsive (e.g., salt-and-pepper) noise; preserves edges. | Less effective for non-impulsive Gaussian noise; can be computationally intensive [57]. |
| Wiener Filter [56] | Frequency | Statistical filter that minimizes mean-square error. | Gaussian noise; incorporates signal and noise statistics. | Can blur sharp edges; requires estimation of noise power spectrum [56]. |
| Bilateral Filter [56] | Spatial | Smooths while preserving edges using spatial and intensity domains. | Edge-preserving smoothing; non-linear. | Computationally intensive compared to linear filters [56]. |
| Wavelet Denoising [57] | Time-Frequency | Thresholds coefficients from wavelet decomposition. | Non-stationary signals; good time-frequency localization. | Choice of threshold and wavelet function is critical [57]. |
| Non-Local Means (NLM) [56] | Spatial | Averages pixels based on the similarity of their surrounding patches. | Leverages image self-similarity; powerful for textured images. | Very high computational complexity [56]. |
| Total Variation (TV) [56] | Variational | Minimizes image gradients to enforce piecewise smoothness. | Effective at preserving sharp edges. | Can cause stair-casing effects in smooth regions [56]. |
Experimental Protocols
Protocol 1: Signal Averaging for Improved SNR
Objective: To enhance the Signal-to-Noise Ratio of a repetitive measurement using software-based signal averaging.
Materials:
- Signal source (e.g., function generator, sensor output)
- Data acquisition system (e.g., ADC, oscilloscope)
- Computer with data processing software (e.g., Python, MATLAB)
Methodology:
- Data Acquisition: Collect multiple (n) scans of the signal. Ensure the signal of interest is temporally aligned (triggered) across all scans.
- Averaging: For each discrete time point
t_i, calculate the average value across allnscans.Averaged_Signal(t_i) = (Scan1(t_i) + Scan2(t_i) + ... + Scann(t_i)) / n
- SNR Calculation: The theoretical improvement in SNR is given by
SNR_new = √n * SNR_original[54]. Monitor the reduction in the standard deviation of the noise in a flat region of the signal to confirm the improvement.
Visualization of Signal Averaging Workflow:
Protocol 2: Optimizing Electrolyte for Low-Cost Redox Analyzers
Objective: To minimize signal variance and noise when using a low-cost impedance analyzer by optimizing the background electrolyte and redox probe concentration [8].
Materials:
- Low-cost impedance analyzer (e.g., Analog Discovery 2)
- Electrochemical cell (e.g., ESSENCE platform, standard electrode setup)
- Background electrolytes (e.g., KCl, Phosphate Buffered Saline (PBS))
- Redox probes (e.g., ferro/ferricyanide ([Fe(CN)₆]â´â»/³â»), Tris(bipyridine)ruthenium(II) ([Ru(bpy)₃]²âº))
Methodology:
- Baseline Measurement: Prepare a standard solution with your analyte in a common electrolyte like KCl with a standard redox probe concentration.
- Vary Ionic Strength: Measure the impedance signal (e.g., Nyquist plot) in a buffered electrolyte like PBS with high ionic strength. Observe the shift of the RC semicircle to higher frequencies and note the change in signal standard deviation [8].
- Vary Redox Concentration: Systematically lower the concentration of the redox probe (e.g., ferro/ferricyanide) while keeping the high-ionic-strength background.
- Compare Analyzers: Record the detection limit and signal quality achieved with the low-cost analyzer and compare it with the performance of a high-precision benchtop analyzer using the optimized electrolyte conditions [8].
Key Reagent Solutions:
| Research Reagent | Function in Experiment |
|---|---|
| Phosphate Buffered Saline (PBS) | Provides a buffered electrolyte with high ionic strength, stabilizing pH and improving signal consistency [8]. |
| Potassium Chloride (KCl) | A common, unbuffered background electrolyte used for baseline comparisons [8]. |
| Ferro/Ferricyanide ([Fe(CN)₆]â´â»/³â») | A common redox probe that undergoes reversible oxidation/reduction, generating a Faradaic current for enhanced signal detection [8]. |
| Tris(bipyridine)ruthenium(II) ([Ru(bpy)₃]²âº) | An alternative redox probe used to study the interplay between different redox molecules and the electrolyte [8]. |
Visualization of Electrolyte Optimization Logic:
Solving Common Problems and Fine-Tuning Analyzer Performance
Diagnosing and Resolving Erratic ORP and Impedimetric Readings
Troubleshooting Guides
ORP Measurement Troubleshooting
Problem: My ORP readings are unstable or drifting. Unstable ORP readings are often caused by problems with the electrode, contamination, or environmental interference.
- Electrode Contamination: Debris or residue on the electrode surface is a common cause of erratic readings, slow response, and calibration problems. Contamination insulates the electrode, preventing proper interaction with the solution.
- Aging or Damaged Electrode: Electrodes degrade over time, leading to drift and instability. Physical damage, such as invisible cracks in the glass membrane from temperature shock, can also cause problems [59] [60].
- Solution: Inspect the electrode for physical damage. Replace the electrode if it is cracked, chipped, or has reached the end of its lifespan as specified by the manufacturer [59].
- Reference Electrode Issues: Drifting can occur due to the depletion of KCl from the reference electrolyte, especially if the electrode is used in an incorrect process solution [60].
- Solution: Ensure the reference electrode is filled with the proper electrolyte and is appropriate for your application.
Problem: My ORP meter will not calibrate properly. Calibration issues prevent your instrument from establishing a reliable baseline measurement.
- Expired or Contaminated Calibration Solutions: Using expired or improperly stored standards leads to inaccurate calibration [59].
- Solution: Always use fresh, correctly stored calibration solutions.
- Contaminated Electrodes: As above, a dirty electrode will not respond correctly during calibration [59].
- Solution: Thoroughly clean the electrode before attempting calibration.
- Faulty Temperature Compensation: ORP measurements are temperature-sensitive. A lack of proper temperature compensation can cause inaccurate readings across different solution temperatures [59].
- Solution: Ensure your meter's Automatic Temperature Compensation (ATC) feature is enabled and functioning. If your meter lacks ATC, you must manually adjust readings based on temperature [59].
Problem: My ORP measurements are noisy or erratic. Electrical interference can disrupt the low-voltage signal from an ORP electrode.
- Electromagnetic Interference (EMI): EMI from nearby power cables, motors, or other electrical equipment can disrupt signal transmission [59].
- Solution: Keep the ORP meter and its cables away from sources of EMI. Use shielded cables and ensure the instrument is properly grounded [59].
- Ambient Light Interference: In solutions with low ORP values, exposure to ambient light can affect electrode performance and cause inaccurate readings [59].
- Solution: Shield the electrodes from direct light by using a light-blocking cover or taking measurements in an opaque chamber [59].
Impedimetric Measurement Troubleshooting
Problem: The Nyquist curve from my impedance spectrometer is unstable or has an unexpected shape. The stability and form of impedance data are critical for analysis, particularly in low-cost systems.
- Suboptimal Electrolyte and Redox Probe Composition: The interplay between the electrolyte's ionic strength and the redox probe concentration significantly affects the impedance signal. High ionic strength can mask the signal from the redox reaction, while low concentrations can increase noise [8].
- Solution: Optimize the background electrolyte (e.g., PBS) for high ionic strength and use lower concentrations of the redox probe (e.g., ferro/ferricyanide) to minimize standard deviation and noise. Using a buffered electrolyte like PBS can also result in a lower standard deviation compared to simple KCl solutions [8].
- Non-Specific Adsorption: Biomolecules or other contaminants can non-specifically bind to the electrode surface, attenuating the signal and reducing sensitivity [8].
- Solution: Implement strategies like shear-enhanced flow-through systems in microfluidic designs to mitigate non-specific binding by taking advantage of enhanced shear forces [8].
The following diagnostic workflow can help systematically identify the source of erratic measurements:
Frequently Asked Questions (FAQs)
Q1: How often should I clean my ORP electrode? The frequency depends entirely on your application. Sensors in dirty or fouling process streams may require frequent cleaning, while those in clean lab environments can go much longer. Establish a regular maintenance routine based on observed performance degradation, such as slow response times or drifting readings [60].
Q2: Why is temperature compensation so critical for ORP measurements? ORP measurements are temperature-sensitive. A change in solution temperature can alter the oxidation-reduction potential, leading to significant measurement errors. Automatic Temperature Compensation (ATC) adjusts the reading in real-time to account for this. Without ATC, you must manually correct readings, which is impractical for dynamic systems [59].
Q3: For a low-cost impedimetric analyzer, what is the most important factor to reduce noise? Fundamental studies show that careful optimization of the chemical system is paramount. Specifically, using a buffered electrolyte with high ionic strength (like PBS) while using lower concentrations of a redox probe (e.g., ferro/ferricyanide) can minimize standard deviation and reduce noise, making the signal more robust for less expensive instrumentation [8].
Q4: What does a slow response time from my ORP sensor indicate? A slow response time typically indicates that the sensor junction is coated or plugged, or that a thin film has built up on the sensing surface. This physically impeders the ion exchange necessary for an accurate and rapid measurement. The most common remedy is a thorough cleaning [60].
Experimental Protocols & Data
Detailed Protocol: Electrolyte Optimization for Low-Cost Impedimetric Analysis
This protocol is adapted from fundamental studies aimed at improving the signal-to-noise ratio for low-cost analyzers [8].
Objective: To optimize the background electrolyte and redox probe system to achieve a stable, sensitive impedimetric signal suitable for use with a low-cost analyzer.
Materials:
- Analyzers: A precision impedance analyzer (e.g., Keysight 4294A) for baseline comparison and a low-cost USB oscilloscope (e.g., Analog Discovery 2).
- Electrochemical Cell: A flow-through or standard three-electrode cell.
- Reagents:
- Background electrolytes: Phosphate Buffered Saline (PBS, pH 7.4) and Potassium Chloride (KCl).
- Redox probes: Potassium ferrocyanide(II)/ferricyanide(III) (e.g.,
[Fe(CN)₆]â´â»/³â») and/or Tris(bipyridine)ruthenium(II) chloride ([Ru(bpy)₃]²âº).
Methodology:
- Baseline Measurement:
- Prepare a standard solution (e.g., 1x PBS with 5 mM
[Fe(CN)₆]â´â»/³â»). - Acquire a full impedance spectrum (Nyquist plot) using the precision impedance analyzer.
- Prepare a standard solution (e.g., 1x PBS with 5 mM
Systematic Variation:
- Vary Ionic Strength: Prepare a series of solutions with a fixed, low concentration of redox probe (e.g., 1-2 mM) but increasing ionic strength of the background electrolyte (PBS or KCl).
- Vary Redox Concentration: Prepare a series of solutions with a fixed, high ionic strength background electrolyte but decreasing concentrations of the redox probe.
Low-Cost Analyzer Validation:
- Measure the impedance of the optimized system (e.g., High ionic strength PBS with low redox probe concentration) using the low-cost analyzer (Analog Discovery 2).
- Compare the Nyquist curves and the standard deviation of measurements between the high-cost and low-cost analyzers.
Expected Outcome: The optimized electrolyte/redox system will produce a clear, stable RC semicircle in the Nyquist plot with the low-cost analyzer, achieving a detection limit and sensitivity comparable to the high-end system [8].
Research Reagent Solutions
The following table details key reagents used in optimizing electrochemical systems for low-cost analyzers.
| Reagent | Function / Explanation |
|---|---|
| Phosphate Buffered Saline (PBS) | A buffered background electrolyte that maintains a stable pH (e.g., 7.4), leading to a lower standard deviation in impedimetric signals compared to unbuffered electrolytes like KCl [8]. |
| Ferro/Ferricyanide Redox Couple | A common and cost-effective redox probe ([Fe(CN)₆]â´â»/³â») that undergoes reversible oxidation/reduction, generating a strong Faradaic current that enhances the impedimetric signal from biorecognition events [8]. |
| Tris(bipyridine)ruthenium(II) | An alternative redox probe ([Ru(bpy)₃]²âº) used to study and enhance charge transfer in impedimetric biosensors, offering different electrochemical properties than ferrocyanide [8]. |
| HCl Cleaning Solution (5-10%) | A mild acid solution used to clean ORP and pH sensor membranes by dissolving alkaline deposits or thin organic films that cause slow response times and inaccurate readings [60]. |
| KCl Electrolyte Solution | A common unbuffered electrolyte used in reference electrodes and electrochemical cells. Studies show it can produce a higher signal but also a higher standard deviation compared to buffered systems like PBS [8]. |
The table below summarizes key findings from electrolyte and redox probe studies, which are critical for designing experiments with low-cost instrumentation.
| Parameter Varied | Effect on Nyquist Curve | Recommended for Low-Cost Analyzers |
|---|---|---|
| Increased Ionic Strength (e.g., PBS) | RC semicircle moves to higher frequencies. Lower overall standard deviation [8]. | Yes. Provides a more stable baseline signal. |
| Increased Redox Concentration | RC semicircle moves to higher frequencies. Can increase signal strength [8]. | Use Lower Concentrations. High concentrations can overwhelm the system; lower concentrations minimize noise [8]. |
| Buffered vs. Unbuffered (PBS vs. KCl) | PBS (buffered) results in a lower standard deviation than KCl [8]. | Yes, use buffered electrolytes (e.g., PBS) for improved signal consistency. |
Electrode Maintenance and Cleaning Protocols for Contamination Control
For researchers working with low-cost redox analyzers, maintaining an optimal signal-to-noise ratio (SNR) is paramount for acquiring reliable data. Electrode fouling from complex biological samples represents a significant source of noise and signal drift, directly impacting measurement sensitivity and specificity. This technical support center provides targeted protocols to control contamination through proper electrode maintenance, thereby enhancing the performance and longevity of your electrochemical systems.
Troubleshooting Guides
Common Electrode Performance Issues and Solutions
| Observed Symptom | Possible Cause | Recommended Solution |
|---|---|---|
| Erratic or drifting readings [61] | Clogged reference junction; Dry glass membrane | Clean the junction [61]; Recondition by soaking in pH 4 or 7 buffer for at least 1 hour [61] [62]. |
| Slow electrode response [61] | Clogged junction or fouled glass membrane | Clean using a method specific to the contaminant (see Cleaning Protocols below) [61] [62] [63]. |
| Inaccurate readings/Calibration failure [61] [62] | Oil or protein coating on the membrane; Dehydrated electrode | Clean for oil/grease or protein [61] [62]; Recondition an electrode stored dry by soaking [62]. |
| Noisy signal (High background "noise") [64] [65] | Nonspecific adsorption of biomolecules (biofouling) | Implement antifouling strategies; Clean electrode thoroughly after use [64] [66]. |
| KCl salt formation on electrode [61] | "KCl creep" from the filling solution | Rinse the electrode with clean water and blot dry with a soft, lint-free tissue [61]. |
Electrode Cleaning Protocols
The following table summarizes detailed cleaning methodologies for specific types of contamination.
| Contaminant Type | Cleaning Solution & Procedure | Incubation & Notes |
|---|---|---|
| General/Inorganic residues [61] [62] | Solution: 0.1M HCl or specialized cleaning solution (e.g., 10% thiourea, 1% HCl) [61].Procedure: Immerse the electrode tip in the solution. | Time: 1 hour [61] to 10 minutes [62].Note: For strongly clogged junctions, a longer soak is required [61]. |
| Protein deposits [61] [62] [63] | Solution 1: 1% pepsin in 0.1M HCl [62] [63].Solution 2: Enzymatic cleaning solution (e.g., protease-based or contact lens cleaner) [61] [62]. | Time: 5 minutes for pepsin solution [62]; At least 1 hour for enzymatic solution [61]. |
| Oil & Grease [61] [62] | Solution: Warm, diluted detergent solution or methanol/ethanol [61] [62].Procedure: Wash the electrode pH bulb in the solution. | Time: 5-10 minutes [61].Warning: Do not use organic solvents on plastic-body electrodes [61]. |
| Salt Deposits [62] | Solution: 0.1 M HCl, followed by 0.1 M NaOH.Procedure: Immerse the electrode in each solution sequentially. | Time: 5 minutes in each solution [62]. |
| Reconditioning a Dry Electrode [61] [62] | Solution: pH 4.01 buffer or pH 7.00 buffer.Procedure: Soak the electrode tip completely. | Time: At least 30 minutes to 1 hour [61] [62]. |
Workflow for Electrode Maintenance
The following diagram outlines the logical decision-making process for maintaining and troubleshooting an electrode to control contamination and optimize the signal-to-noise ratio.
Frequently Asked Questions (FAQs)
Q1: What is the correct way to store my pH/redox electrode to maximize its lifespan? For short-term storage (between measurements), soak the electrode in pH 4.01 or pH 7.00 buffer. For long-term storage, use a storage solution or a 4M KCl solution. The key is to keep the glass membrane and reference junction hydrated. Never store an electrode in distilled or deionized water, as this will deplete the essential hydrated layer and damage it [61] [62].
Q2: How does electrode fouling specifically affect the signal-to-noise ratio in my experiments? Fouling, or nonspecific adsorption of molecules onto the electrode surface, creates a physical barrier that interferes with electron transfer. This increases the background "noise" and diminishes the specific electrochemical signal you are trying to measure. The overall effect is a lower signal-to-noise ratio (SNR), making it difficult to detect low-concentration analytes accurately [64] [65] [66].
Q3: My research involves complex samples like serum. Are there advanced strategies to prevent fouling? Yes. Beyond rigorous cleaning, research focuses on engineering antifouling surfaces. A prominent strategy involves modifying the electrode with zwitterionic peptides or other hydrophilic polymers. These materials create a hydration layer that forms a physical and energetic barrier, effectively resisting the nonspecific adsorption of proteins and other biomolecules found in serum, thereby preserving the SNR of your biosensor [64] [66].
Q4: How often should I clean my electrode? Clean your electrode whenever you notice a slowdown in response time, signal drift, or if you are moving between different sample types (e.g., from a buffer to a protein-rich solution). As a best practice, a quick clean after use in a challenging matrix and a more thorough cleaning as part of your weekly maintenance is recommended.
Q5: The refillable electrode in my lab has bubbles inside the sensing tip. What should I do? Gently shake the electrode body, similar to shaking down a mercury thermometer. This centrifugal force will dislodge the trapped bubbles, which can otherwise affect operation and cause unstable readings [61] [62].
Research Reagent Solutions
The following table details key reagents and materials essential for effective electrode maintenance and contamination control.
| Reagent/Material | Function & Purpose |
|---|---|
| 3.33M Potassium Chloride (KCl) [61] | Standard filling solution for refillable reference electrodes. Maintains a stable potential and creates positive head pressure to prevent sample ingress. |
| pH 4.01 & 7.00 Buffer Solutions [61] [62] | Used for electrode calibration and reconditioning. Soaking a dry electrode helps regenerate the essential hydrated glass layer. |
| 0.1M Hydrochloric Acid (HCl) [61] [62] | General-purpose cleaning solution for removing inorganic residues and unclogging the reference junction. |
| 1% Pepsin in 0.1M HCl [62] [63] | Enzymatic cleaning solution specifically formulated to dissolve and remove protein-based contaminants from the glass membrane and junction. |
| Diluted Detergent Solution [61] [62] | Used for cleaning oily and greasy films from the electrode's bulb. A warm solution is often more effective. |
| Enzymatic Cleaner (Protease-based) [61] | A specialized, ready-to-use solution for breaking down stubborn protein fouling without harsh acids. |
| Zwitterionic Peptides [66] | Advanced antifouling material. Can be used to functionalize electrode surfaces to create a barrier against nonspecific protein adsorption in complex samples like blood serum. |
Optimal Calibration Procedures and Frequency for Stable Measurements
Fundamental Calibration Concepts for Stable Measurements
What is the fundamental relationship between calibration and the Signal-to-Noise Ratio (SNR) in my redox analyzer?
Calibration is the process of comparing your measurement device (the "unknown") against a reference standard of known accuracy to identify and correct deviations [67]. For redox measurements, this is crucial because a well-calibrated instrument directly improves your Signal-to-Noise Ratio (SNR), which is the ratio of the magnitude of your desired signal to the background noise [68]. A high SNR is essential for detecting low concentrations of analytes and achieving precise, reliable data. Accuracy encompasses both random error (unpredictable variations seen as imprecision) and systematic error (consistent, predictable bias) [68]. Calibration primarily corrects for systematic error, while proper experimental design and signal averaging help mitigate random error.
Why is it critical to establish a formal calibration schedule?
All instruments experience "drift," a natural degradation of accuracy over time due to factors like mechanical wear, environmental exposure, and aging electronic components [69]. Without a periodic calibration schedule, you have no verified way of knowing if your measurements are accurate. A formal schedule ensures traceability, provides documentation for audits, and is a key component of a quality management system, such as those adhering to ISO standards [69] [67].
Determining Optimal Calibration Frequency
How do I determine the optimal calibration frequency for my equipment?
There is no single answer, as the optimal interval depends on multiple factors. A best practice is to start with a conservative interval and then use data to optimize it [70] [71]. The key factors to consider are summarized in the table below.
Table 1: Key Factors for Determining Calibration Frequency
| Factor | Description | Impact on Frequency |
|---|---|---|
| Manufacturer's Recommendation | A suggested starting point based on design and specifications [70] [71]. | Provides a baseline interval. |
| Criticality of Measurement | How essential the instrument is to final product quality, process safety, or research conclusions [70] [69]. | Higher criticality demands more frequent calibration. |
| Equipment Usage & Environment | Frequency of use and exposure to harsh conditions (vibration, dust, temperature extremes) [69]. | Heavy use or harsh environments require shorter intervals. |
| Historical Performance Data | The recorded "as-found" data from past calibrations, which shows the instrument's drift pattern [70] [69] [71]. | The most reliable guide for adjusting intervals; stable history allows for extension. |
| Industry & Regulatory Standards | Requirements from quality systems (e.g., ISO), safety regulations, or customer contracts [69] [67]. | May mandate minimum frequencies. |
What is a data-driven method for optimizing my calibration interval?
The most effective method is to start with a conservative interval (e.g., 6 months) and analyze the "as-found" calibration data over several cycles [70] [71]. The workflow below illustrates this optimization process.
Diagram 1: Calibration Interval Optimization
For example, if an RTD transmitter shows a consistent drift of +0.065% of span over 6 months, you can confidently predict an annual drift of about 0.13% and set an interval that ensures it stays within a ±0.50% tolerance [70]. Calibration management software can automate this analysis using established guidelines like NCSL RP-1 [71].
Establishing Proper Calibration Tolerances
How tight should my Pass/Fail calibration tolerance be?
Tolerance should be based on the process requirements—the accuracy needed to produce a quality product or valid data safely—not solely on the manufacturer's specifications [70]. An unreasonably tight tolerance can cause problems, including increased costs, frequent failure reports, and unnecessary stress on technicians [70]. A best practice is to set the highest (least strict) tolerance that your process allows, collect performance data, and then tighten it only if necessary for performance or quality reasons [70].
Table 2: Impact of Calibration Tolerance on Process Performance
| Tolerance Setting | Impact on Process & Costs | Recommended Action |
|---|---|---|
| Overly Tight (e.g., ±0.1%) | High calibration costs; frequent "Fail" reports and adjustments; high-cost reference standards required [70]. | Re-evaluate based on actual process need. |
| Moderately Tight (e.g., ±0.25%) | Risk of constant adjustments; prevents analysis of long-term drift pattern [70]. | May be necessary for critical measurements. |
| Optimal (e.g., ±1.0%) | Reduces unnecessary adjustments and technician stress; allows for drift analysis; uses reasonably priced test equipment [70]. | Ideal for most non-critical processes. |
Calibration Procedures and SNR Optimization
What is the detailed procedure for calibrating a redox measurement system?
The following protocol outlines a general approach for calibrating an analytical instrument, such as a redox analyzer, focusing on SNR.
Experimental Protocol: Multi-Point Calibration and SNR Verification
- Scope: This procedure defines the steps for performing a multi-point calibration of an analytical instrument to ensure measurement accuracy and optimize the Signal-to-Noise Ratio.
- Pre-Calibration Requirements:
- Reference Standards: Use certified reference materials (CRMs) or buffer solutions that are traceable to national standards and are within their expiration date [72] [67]. The reference standard should have a Test Uncertainty Ratio (TUR) of at least 4:1 compared to the instrument's tolerance [70] [67].
- Environmental Conditions: Perform the calibration in a stable environment, free from drafts and temperature fluctuations, as these can introduce noise and drift [73].
- Equipment Preparation: Power on the instrument and allow sufficient warm-up time as per the manufacturer's instructions to stabilize electronics.
- Calibration Execution:
- Step 1 - "As-Found" Data: Before any adjustment, measure and record the instrument's reading using the reference standards at a minimum of three points across the operating range (e.g., low, mid, high) [70]. This data is essential for drift analysis.
- Step 2 - Analysis: Compare the "as-found" data to the reference values. If the errors are within the established process tolerance and not significant, consider not adjusting the instrument to allow for long-term drift analysis [70].
- Step 3 - Adjustment: If the readings are outside tolerance, perform adjustment/optimization according to the manufacturer's procedure.
- Step 4 - "As-Left" Data: After adjustment, verify the calibration again using the reference standards and record the "as-left" data [67]. The instrument should now be within the specified tolerance.
- SNR Verification Protocol:
- Step 1 - Signal Measurement: Using a stable standard solution, measure the peak height or steady-state reading (S).
- Step 2 - Noise Measurement: In a clean section of the baseline (or using a blank solution), draw two lines tangentially to the maximum and minimum noise peaks. The vertical distance between these lines is the peak-to-peak noise (N) [73]. For a more rigorous measurement, use the root-mean-square (RMS) noise if your data system provides it.
- Step 3 - Calculation: Calculate the Signal-to-Noise Ratio: SNR = S / N [68] [73].
- Step 4 - Acceptance: A peak is generally considered detectable with an SNR ≥ 3. For reliable quantification, especially in pharmaceutical analysis, an SNR of 10 or even 25 is often targeted to achieve the required precision (e.g., %RSD ≈ 100/SNR) [73].
Troubleshooting Common Calibration and Measurement Issues
Table 3: Troubleshooting Guide for Common Measurement Issues
| Problem | Potential Causes | Corrective Actions |
|---|---|---|
| Drifting Readings | Temperature fluctuations; Old or worn-out electrode/sensor; Unstable sample conditions [72]. | Stabilize sample temperature; Replace old electrode; Check for proper grounding. |
| Erratic/Noisy Signal (Low SNR) | Low battery; Electromagnetic interference; Contaminated electrode or sample; Improper detector settings [72] [73]. | Replace/charge battery; Move away from interference sources; Clean electrode; Increase detector time constant for signal averaging [73]. |
| Slow Response Time | Buildup of debris or biofilm on the probe; Faulty or aging sensor; Incorrect temperature compensation [72]. | Clean and maintain probe following manufacturer's guidelines; Replace sensor; Verify temperature settings. |
| Inconsistent Calibrations | Using expired or improper buffer/reference solutions; Poor storage conditions for equipment; Low quality of electrode/sensor [72]. | Use fresh, correct standards; Store equipment in a clean, dry environment; Invest in high-quality components. |
| Poor Accuracy Despite Calibration | Systematic error (bias); Incorrect calibration procedure; Reference standard inaccuracy [68]. | Check for and correct bias; Follow manufacturer's procedure; Verify traceability of standards. |
Frequently Asked Questions (FAQs)
Q: How can I improve the Signal-to-Noise Ratio in my redox measurements without new hardware? A: You can improve SNR through signal averaging. By averaging multiple observations (N), the SNR improves with the square root of N (SNR ∠√N) [68]. For example, averaging 4 measurements will double your SNR. Other methods include optimizing your detector's time constant, ensuring temperature control, and using high-purity solvents and reagents to reduce chemical noise [73].
Q: My instrument is always within tolerance at calibration. Can I extend the interval? A: Yes. If historical "as-found" data consistently shows the instrument is stable and well within its process tolerance after a full calibration cycle, you have a strong, data-driven justification for extending the interval [70] [71]. This is a core principle of cost-effective calibration management.
Q: What is the difference between calibration and adjustment? A: Calibration is the process of comparing a measurement to a standard and documenting the difference. Adjustment (sometimes called "optimization" or "trimming") is the physical act of changing the instrument's output to bring it into alignment with the standard [67]. You can calibrate an instrument without adjusting it.
Q: What must be included on a calibration certificate? A: A proper calibration certificate must include: "as found" and "as left" data, identification of the reference standards used (with traceability information), a statement of measurement uncertainty, and the date of calibration [69] [67]. This level of detail is required for audit compliance.
The Scientist's Toolkit: Key Research Reagent Solutions
Table 4: Essential Reagents for Redox Cycling-Based Bioassays
| Reagent / Material | Function in Experiment |
|---|---|
| Tetramethylbenzidine (TMB) | A chromogenic substrate oxidized by enzymes (e.g., HRP) or catalysts to produce a blue-colored product, enabling colorimetric detection [74]. |
| Horseradish Peroxidase (HRP) | A common enzyme label that catalyzes the oxidation of substrates like TMB in the presence of H2O2, central to many colorimetric and electrochemical assays [74]. |
| Ascorbic Acid (AA) / Tris(2-carboxyethyl)phosphine (TCEP) | Acts as a reducing agent in redox cycling circuits, regenerating the oxidized form of a mediator (e.g., from DHA back to AA) to amplify the signal [74]. |
| Gold Nanoparticles (AuNPs) | Used as plasmonic substrates in colorimetric sensors; their aggregation and dispersion, influenced by redox reactions, cause a visible color change from red to blue [74]. |
| Hemin / G-Quadruplex DNAzyme | A synthetic DNA-based enzyme mimic with peroxidase-like activity, used as a catalytic label to drive chromogenic reactions, often at lower cost than natural enzymes [74]. |
| Enterolactone | Enterolactone, CAS:185254-87-9, MF:C18H18O4, MW:298.3 g/mol |
| SARS-CoV-2-IN-1 | SARS-CoV-2-IN-1, MF:C31H39N5O7, MW:593.7 g/mol |
Addressing Sensor Drift, Slow Response, and Reference Electrode Failure
Troubleshooting Guides
Sensor Drift
Q: What is sensor drift and what are its primary causes? A: Sensor drift is the gradual deviation of a sensor's output from the true value over time, even when the input remains constant. It is a major challenge for pressure, displacement, and temperature sensors, and can lead to system inaccuracy, false alarms, and process inefficiencies [75]. The primary causes include [75]:
- Temperature Variations: The most common cause. Temperature changes cause internal components made of different materials to expand or contract at different rates, creating mechanical stress and signal offset.
- Aging and Long-Term Usage: Over time, mechanical stress, corrosion, and material fatigue alter the sensor's structural and electrical properties. Component aging (e.g., in electrolytes or semiconductors) changes electrical characteristics.
- Power Supply Fluctuations: Variations in the supply voltage can change the operating point of the sensor's internal circuits.
- Environmental Influences: Factors like humidity, atmospheric pressure, and vibration can impact sensor stability.
Q: What methods can compensate for sensor drift? A: Compensation can be achieved through hardware and software techniques [75].
Table 1: Sensor Drift Compensation Methods
| Method Type | Specific Technique | Description |
|---|---|---|
| Hardware-Based | Thermistor Compensation | Uses temperature-sensitive resistors (thermistors) within or outside the sensor bridge to offset thermal variations. |
| Power Supply Conditioning | Implements filters, regulators, and low-noise power supplies to stabilize the input voltage. | |
| Bridge Arm Resistor Matching | Adds precision resistors to rebalance the arms of a Wheatstone bridge circuit. | |
| Software-Based | Polynomial Fitting | Models the non-linear relationship between temperature and sensor output using polynomial regression. |
| RBF Neural Network | Uses Radial Basis Function neural networks to approximate complex non-linear functions for higher precision compensation. | |
| Zero Drift Subtraction | Measures and subtracts the baseline drift during periods when no valid signal is present. |
Slow Response and Low Signal-to-Noise Ratio (SNR)
Q: My electrochemical sensor has a slow response and poor signal. How can I enhance its performance? A: Slow response and poor signal can be addressed through sensor design, diagnostic techniques, and advanced signal processing.
- Lock-in Amplification: This signal processing technique can dramatically improve the SNR. In one study, switching from DC measurement to an analog lock-in amplifier (LIA) mode increased the signal-to-noise ratio by 30 dB for a redox-based gas sensor, extending its detection limit from ppm to ppb levels [43] [76]. The LIA works by using a modulated (AC) input signal, which helps to isolate the sensor response from low-frequency noise like 1/f flicker noise [76].
- Sensor Health Diagnostics: Techniques like Electrochemical Impedance Spectroscopy (EIS) and chronoamperometry can diagnose sensor health. EIS measures the impedance of the electrochemical cell across a range of frequencies, and changes in the impedance spectrum can correlate with declining sensor sensitivity. Chronoamperometry involves applying a short, small-amplitude voltage pulse and observing the current response; it can be used frequently to check for performance changes without significantly disturbing the sensor [77].
- Optimize Electrode Design: For interdigitated microelectrodes used in detecting bacterial cells, 3D simulations have shown that the sensor's limit of detection is determined by the Signal-to-Noise Ratio (SNR), not just sensitivity. Optimizing the electrode gap, width, and thickness to maximize the SNR, rather than just the sensitivity, is crucial for the best performance [78].
Reference Electrode Failure
Q: Why do my screen-printed reference electrodes (SPREs) fail prematurely? A: Research has identified the primary failure mechanism of screen-printed reference electrodes (SPREs) as the depletion of the KCl electrolyte reservoir. The study found that incorporating a polydimethylsiloxane (PDMS) junction membrane significantly extends the electrode's operational life by slowing down the leaching of chloride (Clâ») ions. Furthermore, increasing the thickness of the electrolyte layer was shown to enhance the lifespan by improving electrolyte retention. The degradation of the Ag/AgCl layer becomes a significant factor only after the KCl reservoir is depleted [79].
Experimental Protocols
Protocol 1: In-Situ Sensor Health Diagnostics using EIS and Cyclic Voltammetry
This protocol provides a framework for the non-destructive, in-situ tracking of electrochemical sensor performance and drift [80].
1. Objective: To diagnostically track the health and identify the drift of electrochemical sensors using Electrochemical Impedance Spectroscopy (EIS) and Cyclic Voltammetry (CV).
2. Materials and Reagents:
- Screen-printed electrodes (SPEs), either unmodified or modified (e.g., with Pt/C) [80].
- A model analyte solution, such as benzenediols (catechol, resorcinol, hydroquinone) in acidic media [80].
- A potentiostat capable of performing both EIS and CV measurements.
3. Procedure:
- Step 1: Initial Characterization. Immerse the sensor in the analyte solution and run initial CV and EIS scans to establish a baseline.
- Step 2: Stress Cycling. Subject the sensor to repeated CV cycles to simulate operational stress and aging.
- Step 3: Periodic Monitoring. At regular intervals throughout the stress cycling, pause and perform EIS and CV measurements.
- Step 4: Data Extraction. From the EIS data, fit the results to an equivalent circuit model and extract key parameters such as polarization resistance (Rp) and effective capacitance (Ceff). From the CV data, calculate the net charge transfer (Qâ‚™).
- Step 5: Multivariate Analysis. Apply Principal Component Analysis (PCA) to the dataset comprising Rp, Ceff, and Qâ‚™. This analysis will synthesize the trends and reveal the directional evolution of the sensor's health, distinguishing between progressive activation and degradation [80].
Protocol 2: Signal-to-Noise Enhancement using Lock-in Amplification
This protocol details the setup for significantly improving the signal-to-noise ratio of a redox-based chemiresistor [76].
1. Objective: To enhance the SNR and lower the detection limit of a redox-based gas sensor by implementing analog lock-in amplification.
2. Materials and Reagents:
- Chemiresistor sensor (e.g., a single ZnO-coated silica nanospring device) [76].
- A gas flow system with synthetic air and a vapor generator (e.g., a bubbler containing the analyte liquid, such as toluene) [76].
- A temperature-controlled heating plate.
- A Keithley 2400 source-sense meter for DC resistance measurements [76].
- A function generator and an analog lock-in amplifier (e.g., Stanford Research Systems SR510) [76].
3. Procedure:
- Step 1: DC Characterization. Place the sensor in the test chamber with a continuous flow of synthetic air. Raise the temperature to the operating point (e.g., 310°C) and allow the resistance to stabilize. Expose the sensor to pulses of the target vapor at varying concentrations (e.g., 10-60 ppm) and record the DC resistance response using the source meter [76].
- Step 2: AC Measurement Setup. Connect the function generator to the sensor to provide a modulated (AC) excitation signal. Connect the sensor's output to the lock-in amplifier.
- Step 3: Lock-in Amplifier Configuration. Set the lock-in amplifier to the correct reference frequency (matching the function generator) and adjust the time constant for an optimal balance between noise reduction and response time.
- Step 4: AC Response Measurement. Repeat the exposure to analyte vapors as in Step 1, but now record the output signal from the lock-in amplifier. The LIA will output a DC voltage proportional to the amplitude of the in-phase AC component of the sensor's signal, effectively filtering out out-of-phase noise [76].
The workflow for this diagnostic and enhancement process is summarized below:
The Scientist's Toolkit: Key Research Reagent Solutions
Table 2: Essential Materials for Redox Sensor and Electrode Fabrication
| Item | Function / Application | Specific Example |
|---|---|---|
| Nafion Membrane | A proton-exchange membrane used as a separator in electrochemical cells and redox flow batteries, allowing selective ion passage. | Nafion N212 membrane, treated with Hâ‚‚Oâ‚‚ and Hâ‚‚SOâ‚„ for impurity removal and activation [50]. |
| Screen-Printed Electrodes (SPEs) | Low-cost, mass-producible electrodes for electroanalysis. Can be unmodified or modified with catalytic layers. | SPEs with Ag/AgCl reference electrode and a carbon working electrode, used with a PDMS junction to extend lifespan [79] [80]. |
| Graphite Felt | A high-surface-area porous material used as an electrode in redox flow batteries, providing a site for electrochemical reactions. | 25 mm x 25 mm pieces of graphite felt, assembled into the flow cell's electrode chamber [50]. |
| Redox Probes (for Characterization) | Model analytes used to characterize and diagnose the performance of electrochemical sensors. | Benzenediols (catechol, resorcinol, hydroquinone) in acidic media [80]. |
| Electrolyte Salts | Provide the ionic medium and active species for electrochemical systems like redox flow batteries. | Vanadium pentoxide (Vâ‚‚Oâ‚…) for vanadium RFB electrolytes; Cerium (III) carbonate hydrate for cerium-based RFBs [50]. |
Systematic Approach to Identifying Grounding and Electrical Interference Issues
Frequently Asked Questions (FAQs)
Q1: What are the most common symptoms of electrical interference in my low-cost electrochemical setup? You may observe a consistently noisy baseline, a persistent 50/60 Hz hum (and its harmonics) in spectral plots, or sudden, unexplained spikes in your data. Inconsistent results between repeated measurements and signal drift are also common indicators of grounding or interference problems [81] [82].
Q2: My low-cost analyzer is noisier than a benchtop instrument. How can I tell if the noise is from the instrument itself or from external interference? First, run the analyzer with its inputs shorted. If the noise persists, a significant portion is internal to the instrument. Next, reintroduce your experiment. If noise increases substantially, the issue is likely external interference or poor grounding in your experimental setup. Optimizing your electrolyte composition, as discussed in the protocols below, can also help mitigate noise inherent to the electrochemical system [8].
Q3: What is a "ground loop" and how does it affect my signal? A ground loop occurs when multiple points in a system that are meant to be at the same ground potential actually have a voltage difference between them. This causes current to flow in the grounding connections themselves, which acts as an antenna and picks up interference, most often manifesting as a strong 50/60 Hz hum in your recordings [81].
Q4: Can the materials in my experiment itself cause interference? Yes, components like pumps, motors, or even switching power supplies for peripheral equipment are common sources of electromagnetic interference (EMI). These can inject noise into your system conductively (through shared power connections) or radiatively (through the air) [83] [82].
Q5: Why is proper cable management important? Cables, especially those connected to high-impedance inputs, can act very effectively as antennas, picking up ambient electromagnetic noise. Keeping cables short, using shielded cables, and avoiding running signal cables parallel to power cables are essential practices for signal integrity [81].
Troubleshooting Guides
Problem 1: Persistent 50/60 Hz Line Noise and Harmonics
Symptoms: A large, steady peak at 50 or 60 Hz, and its multiples (100/120 Hz, 150/180 Hz, etc.), is visible in the frequency spectrum of your signal [81].
Diagnosis and Resolution Flowchart:
Problem 2: Intermittent, High-Frequency Noise Spikes
Symptoms: Random, sharp spikes appear in the data. These may be infrequent or occur in bursts and can resemble physiological signals or action potentials [81].
Diagnosis and Resolution Flowchart:
This protocol helps you methodically locate and characterize sources of electromagnetic interference in your lab environment.
Objective: To identify, locate, and characterize common sources of EMI that can degrade the signal-to-noise ratio in sensitive electrochemical measurements.
Materials Needed:
- Low-cost spectrum analyzer (See Table 1 for options) or an oscilloscope with FFT capability.
- Near-field probe set (H-field and E-field) or a simple homemade probe (a coaxial cable with the center conductor exposed).
- Your redox analyzer setup.
Procedure:
Baseline Measurement:
- Turn off all experimental equipment in the immediate vicinity, including pumps, stirrers, and extra monitors.
- With your redox analyzer running, use the spectrum analyzer to record a baseline frequency spectrum from 10 kHz to at least 1 GHz. This is your "quiet" reference.
Ambient Environment Scan:
- Using your near-field probe connected to the spectrum analyzer, slowly scan the area around your experiment. Pay close attention to:
- Power outlets and power strips.
- Computer monitors and the main computer tower.
- Overhead lighting, especially fluorescent lights with ballasts.
- Walls and floors (which may conceal power conduits).
- Note the frequencies of any significant peaks you discover [81].
- Using your near-field probe connected to the spectrum analyzer, slowly scan the area around your experiment. Pay close attention to:
Systematic Equipment Re-introduction:
- Turn on one piece of equipment at a time (e.g., the fluidic pump).
- After each device is powered on, repeat the frequency scan with both the near-field probe and by observing the output of your redox analyzer.
- Document which device causes the appearance of new noise peaks or an increase in baseline noise.
Analysis and Mitigation:
- Correlate the noise signatures found in steps 2 and 3 with the noise observed on your redox analyzer.
- Apply mitigation strategies based on the type of noise and its source (e.g., relocating equipment, adding ferrite beads to cables, using a linear power supply).
Data Presentation
Table 1: Comparison of Affordable EMI Diagnostic Tools
This table summarizes low-cost equipment suitable for identifying EMI, crucial for maintaining signal integrity in budget-conscious research.
| Tool | Approximate Cost | Key Features | Best Use in SNR Optimization |
|---|---|---|---|
| TinySA | < $100 [84] | Swept spectrum analyzer; 100 kHz - 350 MHz & 240 - 960 MHz; portable with battery. | Initial identification of strong, narrowband EMI sources like clock oscillators. Limited by minimum resolution bandwidth [84]. |
| AirSpy (SDR) | ~$200 [84] | Software Defined Radio; 24 MHz - 1.8 GHz; real-time FFT; very high sensitivity. | Excellent for observing a wide frequency span in real-time and identifying intermittent noise sources using waterfall plots [84]. |
| RF Explorer | ~$130 [84] | Basic handheld analyzer; 240 - 960 MHz (WSUB1G model). | Gross checks for high-frequency emissions. The newer WSUB3G model (15 MHz - 2.7 GHz) offers better frequency coverage [84]. |
| Near-Field Probes | $50 - $300 [83] | Set of magnetic (H-field) and electric (E-field) probes for localizing EMI on PCBs and cables. | Essential for pinpointing the exact component or trace on a custom PCB or cable that is radiating noise [83] [82]. |
| USB Oscilloscope | ~$200 [8] | Digitizes voltage vs. time; often includes FFT software for basic spectral analysis. | Visualizing noise in the time domain; performing the electrolyte optimization protocol below; basic frequency analysis [8]. |
Table 2: Common Noise Signatures and Mitigation Strategies
A guide to diagnosing noise based on its spectral characteristics, a critical skill for researchers using sensitive electrochemistry setups.
| Noise Signature | Frequency Domain Appearance | Likely Cause | Mitigation Strategies |
|---|---|---|---|
| 50/60 Hz "Hum" | Large, sharp peak at 50/60 Hz and its harmonics (100/120, 150/180 Hz) [81]. | Floating ground; Ground loops; Ambient field from power lines. | Check and secure all ground connections. Ensure all equipment is on the same power circuit. Use shorter cables. Relocate experiment away from walls/power conduits [81]. |
| Wideband Noise | Elevated noise floor across a broad frequency range [83]. | Poor connections; Internal noise of a power supply or active component; Intrinsic amplifier noise. | Inspect and clean all connectors. Use a low-noise, linear power supply instead of a switching power supply. Ensure proper grounding [83] [82]. |
| Intermittent Spikes | Short-duration, high-amplitude spikes appearing randomly [81]. | Cell phones/WiFi devices; Switching of pumps/relays/motors; Arcing in faulty electrical components. | Remove all wireless communication devices from the lab. Place ferrite beads on cables to pumps/motors. Inspect equipment for damage [81] [82]. |
| Narrowband Peaks | Sharp peaks at specific high frequencies (e.g., MHz range). | Microprocessor clocks; Digital data lines; Switching frequency of DC-DC converters [83]. | Use near-field probes to locate the source. Apply board-level shielding (e.g., copper tape) to clock oscillators. Use shielded cables [83] [82]. |
Experimental Protocol: Electrolyte and Redox Probe Optimization for Lowered SNR
Objective: To fundamentally optimize the electrochemical system itself to be more compatible with a low-cost analyzer, reducing its susceptibility to interference and improving the signal-to-noise ratio (SNR) for redox species detection [8].
Background: The choice of background electrolyte and redox probe significantly influences the impedance signal. Optimizing their interplay can create a more robust signal that is less susceptible to noise on a low-cost instrument. Using a buffered electrolyte like PBS can lead to a lower standard deviation overall. Adjusting the ionic strength and redox concentration can shift the RC semicircle in Nyquist plots, allowing for tuning that maximizes signal clarity [8].
Materials Needed:
- Low-cost impedance analyzer (e.g., Analog Discovery 2) [8].
- Electrochemical cell (e.g., screen-printed or custom flow-cell).
- Background electrolytes: Phosphate Buffered Saline (PBS), Potassium Chloride (KCl).
- Redox probes: Potassium ferrocyanide(II)/ferricyanide(III) (e.g., 5 mM), Tris(bipyridine)ruthenium(II) chloride.
- DI water.
Procedure:
Electrode Preparation: Clean and prepare your working electrode according to standard protocols for your specific setup.
Baseline Impedance Measurement:
- Prepare a solution of 1x PBS as the electrolyte.
- Measure the electrochemical impedance spectrum of the bare electrode in this solution using your low-cost analyzer. Record the Nyquist plot.
Effect of Redox Probe Addition:
- To the PBS solution, add a low concentration (e.g., 1-5 mM) of the ferro/ferricyanide redox probe.
- Measure the impedance spectrum again. Observe the change in the Nyquist plot, specifically the appearance or shift of a semicircle corresponding to the redox reaction's charge transfer resistance.
- Repeat this step with the [Ru(bpy)3]2+ redox probe and note the differences.
Optimizing Ionic Strength:
- Prepare a PBS solution with a higher ionic strength (e.g., by adding NaCl to a final concentration of 150 mM).
- Measure the impedance with the optimized redox probe concentration from step 3.
- Note how the increased ionic strength affects the shape and position of the semicircle and the standard deviation of the measurement.
Data Analysis and Optimization:
- Compare the Nyquist plots. The goal is to find a combination of buffered electrolyte (like PBS), ionic strength, and redox probe concentration that produces a well-defined, reproducible semicircle at a frequency range easily measurable by your low-cost instrument.
- A combination of high ionic strength PBS and a lowered redox probe concentration can minimize standard deviation and reduce noise susceptibility in low-cost analyzers [8].
The Scientist's Toolkit: Essential Research Reagents & Materials
Core Electrochemical Components
| Item | Function & Rationale |
|---|---|
| Phosphate Buffered Saline (PBS) | A buffered background electrolyte that maintains a stable pH (e.g., 7.4), which is critical for biomolecule stability and consistent electrochemical behavior. Can lead to a lower standard deviation compared to non-buffered electrolytes like KCl [8]. |
| Ferro/Ferricyanide Redox Probe | A common, reversible redox couple used in Faradaic electrochemical sensing. Its electron transfer enhances the impedimetric signal, improving sensitivity. Concentration and interplay with the background electrolyte are key to optimization [8]. |
| Tris(bipyridine)ruthenium(II) | An alternative redox probe with different electrochemical properties. Testing multiple probes allows researchers to select the one that provides the best signal enhancement and stability for their specific sensor interface [8]. |
| Potassium Chloride (KCl) | A classic, high-conductivity supporting electrolyte used to establish a baseline and study fundamental electrochemical properties without the buffering capacity of PBS [8]. |
| Screen-Printed Electrodes (SPEs) | Low-cost, disposable, and user-friendly electrodes ideal for rapid prototyping and testing of electrolyte/redox probe combinations in a consistent platform [8]. |
| Shielded Cables | Cables with a conductive braid that blocks external electromagnetic fields from coupling into the sensitive signal paths, thereby reducing noise [81] [82]. |
| Ferrite Beads/Cores | Passive components that can be snapped onto cables. They present high impedance to high-frequency noise currents, preventing them from traveling along the cable and entering your instrument [82]. |
| Copper Tape | An inexpensive material for creating ad-hoc board-level shields (Faraday cages) around noisy components or sensitive input stages on custom PCBs [83] [82]. |
Validating Low-Cost System Performance Against Benchtop Standards
For researchers focusing on low-cost redox analyzers, understanding the performance benchmarks set by high-end commercial impedance analyzers is crucial. These premium instruments define the standard for data quality against which affordable alternatives must be measured. This guide provides a structured framework for benchmarking your low-cost system, ensuring your optimized signal-to-noise ratio meets the demands of rigorous electrochemical research.
Troubleshooting Guides
FAQ: High-Frequency Measurement Noise
Q: My low-cost analyzer shows significant noise at high frequencies compared to a Keysight 4294A. What steps can I take to mitigate this?
A: High-frequency noise is a common challenge. Implement these strategies:
- Cable Compensation: Use shortest possible shielded cables and perform open/short/load compensation to account for parasitic impedance [85].
- Current Range Selection: Manually select the optimal current input range instead of using auto-range to minimize range switching noise [85].
- Averaging: Apply signal averaging (4-8 measurements) to reduce random noise contributions [86].
- Redox Probe Optimization: Use redox probes at lower concentrations (e.g., 1-5 mM) in high ionic strength buffers (e.g., PBS) to enhance Faradaic current and reduce high-frequency impedance artifacts [8].
FAQ: Low-Frequency Measurement Drift
Q: Measurements under 1 Hz show significant drift and long measurement times on my affordable system. How can I improve low-frequency stability?
A: Low-frequency drift stems from system instability and can be addressed by:
- Temperature Control: Stabilize environmental temperature to within ±1°C as electrochemical interfaces are temperature-sensitive [86].
- DC Bias Control: Apply appropriate DC bias conditions to stabilize the electrode-electrolyte interface, particularly for redox systems [8].
- Extended Settling Time: Allow sufficient time (2-3 times the reciprocal of the lowest frequency) for the system to stabilize before recording measurements [86].
- Non-Faradaic Measurements: For systems where applicable, use non-Faradaic measurements in low ionic strength solutions to minimize electrochemical drift [8].
FAQ: Signal-to-Noise Optimization for Redox Systems
Q: How can I optimize the signal-to-noise ratio specifically for redox probe-enhanced measurements on a limited budget?
A: Strategic experimental design can significantly enhance SNR:
- Redox Probe Selection: Utilize reversible redox couples with fast electron transfer kinetics (e.g., ferro/ferricyanide, [Ru(bpy)₃]²âº) at optimal concentrations (1-5 mM) to enhance Faradaic response without increasing background noise [8].
- Electrolyte Optimization: Use buffered electrolytes like PBS instead of simple KCl solutions to reduce standard deviation and provide more stable pH conditions [8].
- Electrode Surface Preparation: Ensure consistent electrode surface pretreatment (cleaning, polishing, activation) to achieve reproducible electron transfer kinetics [8].
- Frequency Focusing: Concentrate measurement points in frequency ranges most sensitive to your specific redox system rather than distributing evenly across decades [85].
Performance Benchmarking Tables
Table 1: Key Specifications Comparison of Representative Analyzers
| Analyzer Model | Frequency Range | Impedance Range | Basic Accuracy | Estimated Price | Best-suited Applications |
|---|---|---|---|---|---|
| Keysight 4294A [8] | 40 Hz - 110 MHz | 0.1 mΩ - 1 TΩ | ±0.08% | ~$50,000 | Reference measurements, publication-grade data |
| Sciospec ISX-3 [86] | 100 µHz - 100 MHz | 1 mΩ - 1 TΩ | Specification-dependent | Mid-range | General research, material characterization |
| Analog Discovery 2 [8] | Not specified | Not specified | Application-dependent | ~$200 | Low-cost prototyping, educational use, POC development |
| Zurich Instruments MFIA [85] | 1 mHz - 5 MHz | 1 mΩ - 1 TΩ | ±0.05% | Premium | Integrated systems, advanced laboratory research |
| Performance Parameter | Keysight 4294A | Analog Discovery 2 | Performance Gap |
|---|---|---|---|
| Detection Limit | Baseline reference | Slightly higher | Minimal (protocol-dependent) |
| Measurement Time | Standard reference | Comparable | None significant |
| Signal Stability | High | Moderate with optimization | Reducible with protocol |
| Data Reproducibility | Excellent | Good with careful technique | Protocol-dependent |
| Nyquist Resolution | High definition | Clear with noise mitigation | Reducible with averaging |
Experimental Protocols
Protocol 1: Systematic SNR Benchmarking for Redox Systems
Objective: Quantify the signal-to-noise ratio of a low-cost impedance analyzer against a high-end reference instrument using standardized redox solutions.
Materials:
- Phosphate Buffered Saline (PBS), pH 7.4
- Potassium ferrocyanide (1-10 mM in PBS)
- Tris(bipyridine)ruthenium(II) chloride (1-5 mM in PBS)
- Identical electrode systems for both analyzers
- Temperature control chamber (±0.5°C stability)
Procedure:
- System Setup: Connect identical three-electrode cells to both analyzers using equivalent cable lengths and configurations.
- Solution Preparation: Prepare fresh redox solutions at 1, 3, and 5 mM concentrations in PBS (pH 7.4).
- Baseline Measurement: Measure PBS baseline without redox species from 100 kHz to 100 mHz at 10 points per decade.
- Redox Measurement: Replace with redox solutions and measure identical frequency spectra.
- Data Processing: Calculate SNR as (|Zredox - Zbaseline|)/σ_baseline at characteristic frequencies.
- Comparison: Compute SNR ratio between instruments across concentrations and frequencies.
Expected Outcomes: The low-cost analyzer should achieve >80% of reference SNR at mid-frequencies (1 Hz - 10 kHz) with proper optimization.
Protocol 2: Signal-to-Noise Optimization Workflow
This workflow outlines the systematic process for optimizing the signal-to-noise ratio in low-cost redox analyzers through iterative improvements:
Protocol 3: Redox Probe and Electrolyte Optimization Matrix
Objective: Systematically evaluate redox probe and electrolyte combinations to maximize SNR for Faradaic sensing.
Experimental Design:
- Prepare electrolyte matrix: PBS (pH 7.4) and KCl at ionic strengths of 50, 100, and 150 mM.
- Add redox probes: Ferro/ferricyanide (1:1) and [Ru(bpy)₃]²⺠at 1, 3, and 5 mM.
- Measure impedance spectra: 100 kHz to 100 mHz, 10 points/decade.
- Calculate optimization metric: SNR = (|Zâ‚â‚€Hz - Zâ‚₀₀kHz|)/(σ_noise).
Analysis: Identify combinations yielding highest SNR for your specific electrode system and target application.
The Scientist's Toolkit: Research Reagent Solutions
Table 3: Essential Materials for Redox Impedance Research
| Reagent/Material | Function | Example Application | Optimization Tip |
|---|---|---|---|
| Potassium Ferrocyanide [8] | Reversible redox probe for Faradaic enhancement | Biosensor development, electrode characterization | Use at 1-5 mM in buffered solutions for optimal signal |
| Tris(bipyridine)ruthenium(II) [8] | Alternative redox probe with different kinetics | Comparative studies, specialized sensing applications | More stable in some conditions than ferrocyanide |
| Phosphate Buffered Saline (PBS) [8] | pH-stabilized electrolyte with physiological relevance | Biomedical sensor development, biological studies | Superior to simple KCl for reduced standard deviation |
| Potassium Chloride (KCl) [8] | Simple electrolyte for fundamental studies | Basic electrochemical characterization, method development | Higher sensitivity but potentially more noise |
| Nafion Membranes | Ion-selective membrane for modified electrodes | Selective sensors, fuel cell research | Controls ion transport and reduces interference |
| Screen-Printed Electrodes | Disposable, reproducible electrode platforms | Rapid testing, field-deployable sensors | Enables high-throughput optimization studies |
Advanced Technical Considerations
System Integration Architecture
For researchers building custom impedance systems, this architecture illustrates the key components and data flow in a optimized low-cost redox analyzer:
Key Performance Trade-offs in Low-Cost Systems
Understanding the inherent trade-offs in low-cost impedance analyzers helps set realistic expectations and optimization priorities:
Frequency Range vs. Accuracy: Low-cost systems typically maintain specified accuracy only in limited frequency bands, unlike high-end analyzers that maintain accuracy across their full range [86].
Measurement Speed vs. Precision: Affordable systems often require slower measurement times or increased averaging to achieve precision comparable to premium instruments [85].
Hardware vs. Software Complexity: Successful low-cost implementations often shift complexity from expensive hardware to sophisticated software algorithms for compensation and analysis [8].
General Purpose vs. Application-Specific: While high-end analyzers are general-purpose, optimized low-cost systems often excel in specific applications through targeted optimization [8].
Successful benchmarking of low-cost redox analyzers requires systematic approach that addresses both technical specifications and application-specific performance. By implementing the troubleshooting strategies, experimental protocols, and optimization techniques outlined in this guide, researchers can achieve performance that approaches high-end commercial systems at a fraction of the cost, enabling broader access to sophisticated electrochemical impedance capabilities.
Core Concepts: Understanding LoD, Precision, and Accuracy
In the development of low-cost redox analyzers, establishing rigorous analytical validation parameters is fundamental to ensuring that data is reliable and fit-for-purpose. Optimizing the signal-to-noise ratio is a central challenge, as it directly impacts the sensitivity and detection capability of these analytical systems. [87]
- Accuracy refers to the closeness of agreement between a measured value and its accepted true or reference value. It is a measure of correctness and is often expressed as percent error. In the context of signal and noise, high accuracy indicates that the analytical signal is a true representation of the analyte concentration, minimally biased by systematic errors or noise. [88] [89] [90]
- Precision describes the closeness of agreement between independent measurement results obtained under stipulated conditions. It is a measure of reproducibility and scatter, often quantified by standard deviation. High precision in redox analysis means that repeated measurements of the same sample produce very similar signals, indicating low random error or variability in the noise. [88] [89] [90]
- Limit of Detection (LoD) is the lowest concentration of an analyte that can be reliably distinguished from a blank sample (containing no analyte). It is a critical parameter for determining the sensitivity of an analyzer, especially for detecting trace levels. The LoD is intrinsically linked to the signal-to-noise ratio, requiring the analyte signal to be significantly greater than the background noise. [91]
The following diagram illustrates the logical relationship between signal, noise, and the key validation parameters discussed, showing how they interconnect to define assay performance.
Experimental Protocols and Methodologies
Protocol for Determining Limit of Detection (LoD)
The CLSI EP17 guideline provides a standardized, two-step process for determining LoD, which is highly applicable to low-cost redox sensor development. [91]
Step 1: Determine the Limit of Blank (LoB). The LoB is the highest apparent analyte concentration expected to be found when replicates of a blank sample (containing no analyte) are tested.
- Procedure: Measure a minimum of 20 (for verification) to 60 (for establishment) replicate blank samples.
- Calculation: LoB = meanË…blankË… + 1.645 * (SDË…blankË…). This formula estimates the 95th percentile of the blank distribution, assuming a Gaussian distribution. [91]
Step 2: Determine the LoD using a low-concentration sample.
- Procedure: Measure a minimum of 20 to 60 replicates of a sample known to contain a low concentration of the analyte (near the expected LoD).
- Calculation: LoD = LoB + 1.645 * (SDË…low concentration sampleË…). This ensures that the LoD concentration can be distinguished from the LoB with approximately 95% confidence. [91]
Verification: Once a provisional LoD is calculated, test samples at that concentration. No more than 5% of the results should fall below the LoB. If they do, the LoD must be re-estimated at a slightly higher concentration. [91]
Protocol for Establishing Precision
Precision is evaluated at multiple levels to capture different sources of variability, as outlined in ICH Q2(R2) guidelines. [92]
Repeatability (Intra-assay Precision): Assesses precision under the same operating conditions over a short interval.
- Procedure: Using a homogeneous sample (e.g., a QC material at a relevant concentration), perform a minimum of 6 replicate analyses in a single assay run by the same analyst using the same equipment.
- Data Analysis: Calculate the mean, standard deviation (SD), and percent coefficient of variation (%CV). The formula for standard deviation is: $$ s=\sqrt{\frac{\sum{i}{(M{i} - \bar{M})^2}}{n-1}} $$ where Máµ¢ is an individual measurement, MÌ„ is the mean, and n is the number of measurements. [90]
Intermediate Precision: Assesses the impact of variations within a laboratory (e.g., different days, different analysts, different equipment).
- Procedure: Analyze the same homogeneous sample over multiple separate assay runs, incorporating the intended variations.
- Data Analysis: Calculate the overall mean, SD, and %CV from the pooled data from all runs.
Protocol for Establishing Accuracy
Accuracy can be established through several methods, often by comparing the method to a reference standard. [92]
Comparison to a Reference Standard:
- Procedure: Analyze a certified reference material (CRM) or a sample prepared with a known concentration ("spiked" sample) using your analytical procedure. For drug analysis, this typically involves spiking a placebo with a known amount of the analyte. [92]
- Data Analysis: Calculate the percent recovery. $$ \% \; Recovery = \frac{Measured\; Concentration}{Known\; Concentration} \times 100\% $$ Alternatively, calculate percent error: $$ \% \; error = \frac{\left| Observed\; Value - True\; Value \right| }{True\; Value} \times 100 \% $$ [90]
Method Comparison:
- Procedure: Analyze a set of samples covering the analytical range using both the new method and a well-characterized reference method.
- Data Analysis: Use statistical regression (e.g., Deming regression) to assess the agreement and any systematic bias between the two methods.
Troubleshooting Guides & FAQs
Frequently Asked Questions
Q1: Our assay has excellent precision (low %CV) but poor accuracy. What could be the cause? This pattern strongly indicates the presence of a systematic error (bias). Good precision means your measurement process is reproducible, but the consistent offset from the true value suggests a flaw in the method or instrumentation. [88] [89] Investigate the following:
- Calibration: Check the calibration standards for degradation or incorrect preparation. Verify the calibration curve.
- Sample Matrix Effects: Assess whether components in the sample matrix are interfering with the analysis (e.g., enhancing or suppressing the signal). Evaluate specificity. [92]
- Instrument Parameters: Review instrument settings for the redox analyzer. An improperly functioning instrument can introduce consistent bias. [89]
Q2: After optimizing our redox sensor, the signal increased but the LoD did not improve. Why? An improved signal alone does not guarantee a better LoD because the Limit of Detection is dependent on the signal-to-noise ratio (SNR). [87] If your optimization also increased the background noise proportionally, the SNR may not have changed. To lower the LoD, focus on strategies that increase the specific signal more than the background noise, or actively reduce the noise itself. For instance, in fluorescent systems, using substrates with flatter surfaces can drastically reduce background noise and thus lower the LoD. [87]
Q3: What is the difference between LoD and Limit of Quantitation (LoQ)? This is a critical distinction in analytical chemistry:
- Limit of Detection (LoD) is the lowest concentration that can be detected, but not necessarily quantified with acceptable accuracy and precision. It answers the question: "Is the analyte there or not?" [91]
- Limit of Quantitation (LoQ) is the lowest concentration that can be quantitatively measured with stated, acceptable levels of accuracy and precision (bias and imprecision). The LoQ is always greater than or equal to the LoD. [91]
Troubleshooting Common Scenarios
| Problem | Potential Causes | Recommended Investigations |
|---|---|---|
| High Background Noise | - Impure reagents or solvents.- Substrate autofluorescence (in optical sensors).- Non-specific binding of detection elements.- Electrical interference in the detector. | - Run a blank with all components except the analyte.- Use higher purity reagents and solvents.- Include blocking agents (e.g., BSA) to reduce non-specific binding.- Implement electrical shielding. |
| Poor Repeatability (High %CV) | - Pipetting errors.- Unstable light source or power supply.- Inconsistent sensor surface regeneration.- Environmental fluctuations (e.g., temperature). | - Verify pipette calibration and technique.- Monitor the power/output of the light source.- Standardize the washing/regeneration protocol between runs.- Conduct experiments in a temperature-controlled environment. |
| Low Analytical Recovery | - Incomplete sample preparation or extraction.- Chemical interference from the sample matrix.- Degradation of the analyte or reagent during analysis.- Incorrect calibration standard assignment. | - Spike recovery experiments at different stages of sample prep.- Perform a standard addition experiment to check for matrix effects.- Check stability of reagents and standards under analysis conditions.- Prepare fresh calibration standards from a different stock. |
The Scientist's Toolkit: Research Reagent Solutions
The following table details key materials and their functions, particularly relevant to developing and validating low-cost redox and optical biosensors. [93] [87]
| Reagent / Material | Function in Analysis | Key Considerations |
|---|---|---|
| Certified Reference Materials (CRMs) | Used to establish method accuracy by providing a sample with a known, certified analyte concentration. | Ensure the CRM matrix matches your sample matrix as closely as possible to avoid mismatches in analytical behavior. |
| Functional Nanomaterials (e.g., metallic NPs, graphene) | Enhance signal transduction in biosensors. Their high surface-area-to-volume ratio and unique electrical/optical properties increase the detectability of the assay. [93] | Controlled synthesis and biofunctionalization (e.g., with antibodies, aptamers) are critical for reproducibility and selectivity. [93] |
| High-Quality Optical Filters (e.g., ET series) | Isolate specific excitation and emission wavelengths in fluorescence-based detection, crucial for maximizing signal and minimizing noise. [87] | Filter performance is highly sensitive to the angle of incident light. Deviations can allow unwanted light to pass, increasing background noise. [87] |
| Low-Autofluorescence Substrates (e.g., SOI wafers) | Provide a flat, low-noise surface for building microfluidic chips or mounting sensors, directly improving the signal-to-noise ratio for fluorescent imaging. [87] | A flat surface prevents light scattering that can degrade optical filter performance. Using Silicon-on-Insulator (SOI) substrates can reduce fluorescent background by ~5x. [87] |
| Stable Redox Mediators | Facilitate electron transfer in electrochemical biosensors, improving the sensitivity and stability of the electrochemical signal. | Select mediators with a suitable redox potential and ensure they do not degrade or react non-specifically with other sample components. |
| Parameter | Definition | Typical Experimental Approach | Key Calculation / Expression |
|---|---|---|---|
| Limit of Blank (LoB) | Highest apparent analyte concentration expected from a blank sample. [91] | Measure multiple replicates (n=20-60) of a blank sample. | LoB = meanË…blankË… + 1.645(SDË…blankË…) [91] |
| Limit of Detection (LoD) | Lowest concentration reliably distinguished from LoB. [91] | 1. Determine LoB.2. Measure multiple replicates of a low-concentration sample. | LoD = LoB + 1.645(SDË…low concentration sampleË…) [91] |
| Limit of Quantitation (LoQ) | Lowest concentration quantified with acceptable accuracy and precision. [91] | Measure samples with concentrations at or above the LoD and determine where pre-defined bias and imprecision goals are met. | LoQ ≥ LoD. Defined by meeting acceptable %Bias and %CV targets. [91] |
| Precision (Repeatability) | Closeness of agreement under the same conditions. [92] | Analyze a minimum of 6 replicates of a homogeneous sample in one run. | Standard Deviation (s), %CV = (s/mean) * 100% [90] |
| Accuracy | Closeness of agreement to the true value. [92] | Analyze a certified reference material or a spiked sample. | % Recovery = (Measured/Known)*100%% Error = |Measured - True|/True * 100% [90] |
Table 2: Impact of Signal-to-Noise Ratio on Analytical Performance
| Scenario | Signal | Noise | Signal-to-Noise Ratio (SNR) | Impact on LoD | Impact on Precision & Accuracy |
|---|---|---|---|---|---|
| Baseline | Baseline | Baseline | Baseline | Baseline LoD | Baseline performance |
| Optimal Improvement | Increased | Decreased | Significantly Higher | Lower (Improved) | Precision and Accuracy improved |
| Signal Boost Only | Increased | Unchanged / Also Increased | Moderately Higher / Unchanged | Slightly Improved / Unchanged | Precision may improve, Accuracy unaffected if no bias |
| Noise Reduction Only | Unchanged | Decreased | Higher | Lower (Improved) | Precision improved |
The workflow for establishing and troubleshooting these key analytical parameters, from initial setup to data interpretation, is summarized in the following diagram.
Comparative Analysis of Redox Probe Performance in Different Electrolytes
In the development of low-cost electrochemical analyzers, optimizing the signal-to-noise ratio (SNR) is paramount for achieving reliable analytical performance without expensive instrumentation. Redox probes, in conjunction with their background electrolytes, play a critical role in defining the sensitivity and detection limits of Faradaic electrochemical biosensors. The interplay between the redox species and the electrolyte composition—including ionic strength, pH, and chemical compatibility—directly influences electron transfer kinetics and mass transport, thereby dictating the overall signal strength and noise characteristics. Research demonstrates that strategic optimization of these components allows researchers to transition from expensive benchtop analyzers (∼$50,000) to affordable, portable alternatives (∼$200) while maintaining analytical sensitivity [8]. This guide provides troubleshooting and methodological support for researchers aiming to enhance SNR in their electrochemical systems through optimized redox probe and electrolyte selection.
Troubleshooting Guides
Poor Signal-to-Noise Ratio in Faradaic Measurements
Problem: Low signal amplitude or excessive noise in impedance or voltammetric measurements.
Solutions:
- Optimize Redox Probe Concentration: Lowering the concentration of the redox probe ([Fe(CN)₆]³â»/â´â» or [Ru(bpy)₃]²âº) while using a high-ionic-strength electrolyte like phosphate-buffered saline (PBS) can minimize standard deviation and reduce noise, enhancing SNR for low-cost analyzers [8].
- Adjust Square-Wave Voltammetry Parameters: Tune the frequency of the square-wave pulse. For sensors using redox-tagged oligonucleotides, lower frequencies (e.g., ~10 Hz) can significantly enhance signal gain and even convert a "signal-off" sensor into a "signal-on" one. The optimal frequency depends on the binding-induced change in the flexibility of the molecular probe [94].
- Verify Electrode Integrity: Contaminated or damaged electrodes can cause noisy, unstable readings. Clean electrodes with specialized cleaning solutions and inspect for physical damage like cracks or discoloration. For ORP meters with a platinum band electrode, ensure it is clean and free of deposits [59] [95].
- Check for Electrical Interference: Electromagnetic interference (EMI) from nearby equipment can disrupt signals. Use shielded cables, proper grounding, and relocate the instrument away from power cables and motors [59].
Signal Drift and Instability
Problem: ORP or current readings exhibit gradual drift or fail to stabilize during measurements.
Solutions:
- Inspect for Electrode Aging: Degraded electrodes are a common source of drift. Replace electrodes at the manufacturer-recommended intervals. Proper maintenance and storage in recommended solutions (e.g., pH-4/KCl solution for ORP sensors) extend their lifespan [59] [95].
- Ensure Proper Temperature Compensation: Fluctuations in sample temperature can cause significant signal drift. Use a meter with Automatic Temperature Compensation (ATC) or manually adjust readings based on temperature [59].
- Allow Adequate Equilibrium Time: For solubility measurements of redox-active molecules, ensure saturated solutions are stabilized for a sufficient time (e.g., 8 hours) to reach thermodynamic equilibrium, preventing concentration-driven drift [96].
Inaccurate Calibration or Measurement
Problem: Calibration fails or readings do not correspond to expected values.
Solutions:
- Use Fresh, Properly Stored Reagents: Expired or improperly stored calibration solutions and redox reagents are a common source of error. Prepare fresh solutions and ensure correct storage conditions [59].
- Confirm Electrolyte Compatibility: The electrolyte must be chemically compatible with both the redox probe and the electrode surface. For instance, the charge of immobilized molecules on the electrode can significantly affect the measured signal. Systematic evaluation of buffers like PBS versus KCl is recommended [8].
- Understand ORP Calibration: Note that ORP sensors measure voltage (mV) and typically cannot be calibrated in the traditional sense. Calibration with standard solutions may actually worsen accuracy, as the mV response is dictated by the amplifier system [95].
Frequently Asked Questions (FAQs)
Q1: What are the most common redox probes used in Faradaic biosensors, and how do I choose? Two of the most common and well-characterized redox probes are the ferro/ferricyanide couple ([Fe(CN)₆]â´â»/³â») and tris(bipyridine)ruthenium(II) ([Ru(bpy)₃]²âº). Your choice should be based on compatibility with your system. The ferro/ferricyanide system is widely used and inexpensive, but its performance can be sensitive to the ionic strength and composition of the background electrolyte [8]. [Ru(bpy)₃]²⺠is another popular option, and its performance may vary differently with changes in the electrolyte compared to ferro/ferricyanide. Empirical testing in your specific electrolyte is the best approach for selection.
Q2: How does the background electrolyte affect my redox probe's performance? The background electrolyte is crucial for carrying current and influences the double-layer structure at the electrode interface. Key factors are:
- Ionic Strength: Increasing ionic strength can compress the double layer, often enhancing electron transfer kinetics and sharpening the voltammetric response. However, very high ionic strength can sometimes reduce signal sensitivity [8].
- Buffer vs. Simple Salt: Buffered electrolytes like PBS can lead to a lower standard deviation in measurements compared to simple salts like KCl, making them preferable for stable, reproducible results [8].
- pH: The pH can affect the charge state of immobilized biomolecules and the stability of some redox probes, thereby influencing the electron transfer efficiency.
Q3: I am using a low-cost impedance analyzer. How can I optimize my electrolyte for the best SNR? A fundamental study suggests a clear path for optimization:
- Use a buffered electrolyte with high ionic strength (e.g., PBS).
- Use a lower concentration of your chosen redox probe. This combination was shown to minimize noise and standard deviation, allowing a low-cost analyzer to achieve a detection limit similar to an expensive benchtop instrument [8].
Q4: Why is my ORP sensor reading unstable, and how can I fix it? Unstable ORP readings are often related to electrode issues. First, perform a basic functionality test by placing the sensor in standard buffer solutions and comparing the mV readings to expected values (e.g., ~410-430 mV for pH 4 buffer). If readings are erratic, clean the electrode with a suitable cleaning solution to remove any deposits or contamination. Also, ensure all connections (e.g., BNC) are secure. If problems persist, the electrode may be damaged or aged and require replacement [59] [95].
Experimental Protocols & Data Presentation
Protocol: Optimization of Electrolyte and Redox Probe for Enhanced SNR
Objective: To identify the optimal combination of redox probe and background electrolyte for maximizing the Signal-to-Noise Ratio in a Faradaic impedance biosensor.
Materials:
- Redox Probes: 5 mM potassium ferrocyanide (K₄[Fe(CN)₆]) / potassium ferricyanide (K₃[Fe(CN)₆]) equimolar mixture, or 5 mM Tris(bipyridine)ruthenium(II) chloride ([Ru(bpy)₃]Cl₂).
- Background Electrolytes: 1x Phosphate Buffered Saline (PBS, pH 7.4), 1 M Potassium Chloride (KCl).
- Equipment: Electrochemical workstation or low-cost impedance analyzer (e.g., Analog Discovery 2), three-electrode system (working, counter, and reference electrodes).
Methodology:
- Prepare Electrolyte Solutions: For each redox probe, prepare solutions in both PBS and KCl backgrounds. A suggested starting concentration is 1-5 mM for the redox probe.
- Electrochemical Impedance Spectroscopy (EIS):
- Set up the electrochemical cell with the chosen electrolyte/redox probe solution.
- Run an EIS scan over a frequency range from 100 kHz to 0.1 Hz with a small AC amplitude (e.g., 10 mV) at the open circuit potential.
- Record the Nyquist plot (imaginary impedance, -Z'' vs. real impedance, Z').
- Data Analysis:
- Note the diameter of the semicircle in the Nyquist plot, which corresponds to the electron transfer resistance (Rₑₜ).
- Evaluate the signal stability by running triplicate measurements and calculating the standard deviation.
- The system with a well-defined semicircle and the lowest standard deviation for replicate measurements is considered to have superior SNR for that analytical setup.
Performance Data of Redox Probes in Different Electrolytes
Table 1: Comparative performance of redox probes in different background electrolytes, adapted from [8].
| Redox Probe | Background Electrolyte | Key Finding | Recommended Application |
|---|---|---|---|
| Ferro/Ferricyanide | Potassium Chloride (KCl) | Significant change in Nyquist curve; RC semicircle position is concentration-dependent. | General purpose use with optimized concentration. |
| Ferro/Ferricyanide | Phosphate Buffered Saline (PBS) | Lower standard deviation and overall signal, leading to lesser sensitivity but better reproducibility. | Low-cost analyzers where noise minimization is critical. |
| [Ru(bpy)₃]²⺠| Potassium Chloride (KCl) | Displays a distinct RC semicircle in the Nyquist plot. | Systems where alternative electron transfer kinetics are beneficial. |
| [Ru(bpy)₃]²⺠| Phosphate Buffered Saline (PBS) | Similar to ferro/ferricyanide, the buffer provides more stable measurements. | Low-noise applications compatible with ruthenium chemistry. |
Protocol: High-Throughput Solubility Screening for Redox-Active Molecules
Objective: To rapidly determine the solubility of a redox-active organic molecule (ROM) in various single and binary solvents for redox flow battery applications.
Materials:
- Target ROM: e.g., 2,1,3-benzothiadiazole (BTZ).
- Solvent Library: A curated library of organic solvents (e.g., 22 candidates).
- Equipment: High-throughput robotic platform with liquid handling, NMR tubes, quantitative NMR (qNMR) instrument.
Methodology [96]:
- Sample Preparation: A robotic arm dispenses powder ROM and solvents into vials to create saturated solutions using the 'excess solute' (shake-flask) method.
- Equilibration: The saturated solutions are allowed to stabilize at a fixed temperature (e.g., 20°C) for 8 hours to reach thermodynamic equilibrium.
- Sampling and Analysis: The robotic system automatically transfers aliquots of the saturated solution into NMR tubes. Quantitative NMR is used to determine the molar concentration of the dissolved ROM.
- Active Learning Guidance: The solubility data is fed into a Bayesian Optimization (BO) algorithm. The BO model predicts the solubility of untested solvent combinations and suggests the most promising candidates for the next round of testing, drastically reducing the number of experiments required.
The Scientist's Toolkit: Research Reagent Solutions
Table 2: Essential materials and reagents for redox probe and electrolyte research.
| Item | Function / Application | Key Consideration |
|---|---|---|
| Potassium Ferro/Ferricyanide | Common redox probe for Faradaic EIS and voltammetry. | Sensitive to light and pH; prepare solutions fresh. |
| Tris(bipyridine)ruthenium(II) | Alternative redox probe with different electron transfer kinetics. | Often used in electrochemiluminescence (ECL) applications. |
| Phosphate Buffered Saline (PBS) | A high-ionic-strength buffered electrolyte. | Provides stable pH and ionic strength, leading to lower signal noise [8]. |
| Potassium Chloride (KCl) | A simple salt for creating high-ionic-strength conditions. | Lacks buffering capacity; pH may drift during experiments. |
| 1-Butyl-3-methylimidazolium Chloride | Ionic liquid for enhancing solubility and stability in non-aqueous RFBs [97]. | Can increase viscosity, which may slow mass transport. |
| 2,1,3-Benzothiadiazole (BTZ) | A model redox-active organic molecule (anolyte) for flow batteries. | Solubility in organic solvents is a key determinant of energy density [96]. |
Signaling Pathways and Workflow Visualizations
Diagram 1: Troubleshooting workflow for improving SNR in redox-based electrochemical sensors. SWV: Square-Wave Voltammetry; EMI: Electromagnetic Interference. Based on [94] [59] [8].
Diagram 2: Active learning workflow for accelerated discovery of high-solubility electrolytes. HTE and ML are integrated in a closed loop to efficiently screen thousands of solvent candidates, as demonstrated for the molecule 2,1,3-benzothiadiazole (BTZ) [96].
Assessing Long-Term Stability and Reproducibility of Measurements
Frequently Asked Questions (FAQs)
Q1: What is the fundamental difference between repeatability and reproducibility? A: Repeatability refers to the consistency of measurement results under identical conditions, using the same instrument, same operator, and over a short period. It reflects the stability of the instrument's current working status and environment. Reproducibility, in contrast, assesses the ability to achieve consistent results under changed conditions, such as different operators, different instruments, or across longer time periods. It evaluates long-term stability and the influence of these varying factors on the measurement [98] [99].
Q2: Why is assessing long-term stability critical for low-cost redox analyzers? A: Low-cost analyzers, while economically attractive, can be more susceptible to signal drift and performance degradation over time. Assessing long-term stability ensures that the cost-saving measures do not compromise data integrity. For instance, a study transitioning from a ~$50k benchtop impedance analyzer to a ~$200 portable unit required careful optimization of electrolytes and redox probes to maintain similar sensitivity and ensure the device's readings remained reliable over its lifespan [8].
Q3: How does the Signal-to-Noise Ratio (SNR) relate to measurement quality? A: SNR is a measure that compares the level of a desired signal to the level of background noise. A high SNR means the signal is clear and easy to detect, leading to more reliable and precise measurements. A low SNR means the signal is obscured by noise, making it difficult to distinguish true measurements from random fluctuations. In practice, an SNR exceeding 3 is often considered a minimum threshold to confirm a signal is real and not a random artifact [1] [100].
Q4: What are common strategies to improve SNR in electrochemical measurements? A: Key strategies include:
- Optimizing Electrolyte Composition: Using buffered electrolytes like PBS with high ionic strength can lead to a lower standard deviation and reduced noise [8].
- Using Redox Probes: Adding redox-active molecules like the ferro/ferricyanide couple can significantly enhance the Faradaic (signal) current, thereby improving SNR [8].
- Adjusting Instrument Parameters: Decreasing the electrochemical scan rate or using a working electrode with a smaller surface area can reduce charging currents (a source of noise) [101].
Troubleshooting Guides
Guide 1: Addressing Poor Signal-to-Noise Ratio
Symptoms: Voltammograms are noisy, baseline is unstable, small peaks are indistinguishable from background, measurement data has high variability.
| Possible Cause | Diagnostic Steps | Corrective Action |
|---|---|---|
| Electrical Noise & Poor Connections | Check for voltage/current compliance errors on the potentiostat. Inspect cables and connectors for damage. Ensure all electrodes are properly connected and submerged [101]. | Reconnect all cables. Replace damaged components. Ensure the electrochemical cell is properly set up. |
| Unoptimized Electrolyte/Redox System | Perform a background scan without the analyte. Compare the noise level with scans using different background electrolytes or redox probe concentrations [8]. | Use a buffered electrolyte (e.g., PBS). Optimize the concentration of the redox probe (e.g., ferro/ferricyanide). Increase electrolyte ionic strength [8]. |
| Unclean or Faulty Working Electrode | Visually inspect the electrode surface. Run a control experiment with a standard redox couple like potassium ferricyanide [101]. | Polish the working electrode with alumina slurry (e.g., 0.05 μm). Clean via electrochemical cycling in a suitable solution (e.g., 1 M H₂SO₄ for Pt electrodes) [101]. |
| Inappropriate Scan Parameters | Run the same experiment at a slower scan rate. Observe if the baseline hysteresis and noise decrease [101]. | Reduce the scan rate. This reduces capacitive charging currents, which are a major source of noise at high scan rates. |
Guide 2: Investigating Poor Long-Term Reproducibility & Drift
Symptoms: Measurements of the same sample yield different results over days or weeks, a consistent upward or downward trend is observed in control samples.
| Possible Cause | Diagnostic Steps | Corrective Action |
|---|---|---|
| Instrument Calibration Drift | Regularly measure a certified reference material or a stable calibration phantom. Track its measured values over time to identify drift [102]. | Implement a rigorous calibration schedule. For some instruments, asynchronous calibration (monthly phantom scans) can be as effective as simultaneous calibration for long-term stability [102]. |
| Environmental Fluctuations | Monitor laboratory temperature and humidity. Correlate environmental changes with measurement discrepancies [99]. | Implement environmental controls (e.g., air conditioning, humidity control). Allow instruments and samples to acclimate to the measurement environment. |
| Operator Variability | Conduct a Gage R&R (Repeatability & Reproducibility) study involving multiple operators. | Develop and enforce detailed Standard Operating Procedures (SOPs). Provide comprehensive training for all operators. Automate processes where feasible [99]. |
| Aging Reagents or Contamination | Prepare fresh solutions from new chemical stocks and repeat the experiment. | Establish strict shelf-life protocols for chemical reagents. Use high-purity reagents and proper storage conditions. |
Experimental Protocols
Protocol 1: Taguchi Method for Optimizing Electrodeposition of Reduced Graphene Oxide (rGO) to Minimize Charge Transfer Resistance
This protocol outlines a systematic approach to optimize multiple parameters simultaneously for a robust process with improved signal quality [103].
1. Objective: To minimize the charge transfer resistance of electrodeposited rGO by optimizing four key parameters: pH, GO concentration, scan rate, and number of cycles.
2. Materials:
- Potentiostat/Galvanostat
- Indium Tin Oxide (ITO) working electrode
- Platinum wire counter electrode
- Saturated Calomel Reference Electrode (SCE)
- Graphene Oxide (GO) aqueous dispersion
- Phosphate buffer solutions (for pH control)
3. Experimental Design and Procedure:
- Define Factors and Levels: Select the parameters to optimize and their test values as shown in the table below.
- Select Orthogonal Array: Use the Taguchi Lâ‚₈ orthogonal array, which can efficiently handle one six-level factor and three four-level factors with only 18 experimental runs [103].
- Run Experiments: Perform the electrodeposition via cyclic voltammetry for each of the 18 parameter combinations specified by the array.
- Measure Response: For each experiment, measure the charge transfer resistance (Râ‚â‚œ) using Electrochemical Impedance Spectroscopy (EIS).
- Calculate Signal-to-Noise (S/N) Ratio: Since the goal is to "minimize" the response (Râ‚â‚œ), use the "smaller-the-better" S/N ratio [103]:
- S/N = -10 log( Σ y² / n )
- where 'y' is the measured Râ‚â‚œ for each run and 'n' is the number of observations.
- Data Analysis: Analyze the mean S/N ratio for each factor level. The level with the highest S/N ratio represents the optimum condition. Perform an Analysis of Variance (ANOVA) to determine the statistical significance of each parameter.
Table: Optimized Parameters for rGO Electrodeposition
| Factor | Level 1 | Level 2 | Level 3 | Level 4 | Level 5 | Level 6 | Optimal Level |
|---|---|---|---|---|---|---|---|
| pH | 5 | 7 | 9 | - | - | - | 5 [103] |
| GO Concentration (mg) | 1 | 3 | 6 | 9 | 12 | 15 | 1 [103] |
| Scan Rate (mV/s) | 1 | 10 | 100 | - | - | - | 100 [103] |
| Number of Cycles | 1 | 3 | 5 | - | - | - | 1 [103] |
Protocol 2: Assessing Long-Term Stability Using a Calibration Phantom
This methodology is adapted from studies in quantitative imaging and can be applied to analytical instruments to monitor drift and reproducibility over extended periods [102].
1. Objective: To evaluate the long-term stability and reproducibility of an analytical instrument by tracking measurements of a stable calibration standard.
2. Materials:
- A stable, certified reference material or calibration phantom (e.g., European Spine Phantom for densitometry, or a stable electrochemical standard).
- The instrument under test.
3. Procedure:
- Baseline Measurement: Perform an initial, highly precise measurement of the phantom to establish a baseline value.
- Schedule Periodic Measurements: Measure the phantom at regular intervals (e.g., weekly or monthly) over an extended period (e.g., 12 months). Ensure measurement conditions are as consistent as possible.
- Data Analysis:
- Calculate Precision: Determine the precision (or coefficient of variation) of the measurements over the mid-term (e.g., first 12 weeks) and long-term (e.g., entire 1.5 years) [102].
- Check for Drift: Perform a linear regression of the measured values against time. A statistically significant slope indicates a systematic drift in the instrument.
- Compare Calibration Methods: If applicable, compare the results using simultaneous calibration (phantom measured with every sample) versus asynchronous calibration (phantom measured monthly, with data corrected post-hoc). Studies show asynchronous calibration can provide excellent long-term reproducibility and may be more practical [102].
Visualizations
Diagram 1: Relationship of Key Metrology Concepts
Key Metrology Concepts
Diagram 2: Workflow for Long-Term Stability Assessment
Stability Assessment Workflow
The Scientist's Toolkit: Research Reagent Solutions
Table: Essential Materials for Redox-Based Electrochemical Biosensing
| Item | Function/Explanation | Example from Literature |
|---|---|---|
| Phosphate Buffered Saline (PBS) | A buffered electrolyte that maintains a stable pH (e.g., 7.4), which is critical for the stability of biological elements (antibodies, DNA) and consistent electrochemical performance. Using PBS instead of simple KCl can lead to a lower standard deviation [8]. | Used as a background electrolyte in the ESSENCE biosensor platform [8]. |
| Redox Probe / Mediator | A reversible redox-active molecule that shuttles electrons between the electrode surface and the solution, generating a strong, measurable Faradaic current. This enhances the signal and improves SNR. Common examples include the ferro/ferricyanide couple ([Fe(CN)₆]³â»/â´â») and [Ru(bpy)₃]²⺠[8]. | Ferro/ferricyanide and [Ru(bpy)₃]²⺠were studied to understand and enhance impedimetric signals [8]. |
| Potassium Chloride (KCl) | A common supporting electrolyte used to increase the ionic strength of a solution, which decreases solution resistance and can affect the frequency response of the redox couple's semicircle in Nyquist plots [8]. | Used in fundamental studies to understand the interplay between electrolyte ionic strength and redox probes [8]. |
| Calibration Phantom | A stable, well-characterized physical standard with known properties, used to calibrate instruments and track their performance and drift over time. This is fundamental for ensuring long-term reproducibility [102]. | The European Spine Phantom was used to assess the long-term reproducibility of bone densitometry measurements over 1.5 years [102]. |
Inter-laboratory Validation and Standardized Testing Protocols
Troubleshooting Guides
Guide 1: Troubleshooting Common ORP Analyzer Issues
This guide addresses frequent problems with Oxidation-Reduction Potential (ORP) analyzers, which measure a solution's electron transfer capacity to quantify its oxidizing or reducing potential [104].
| Problem | Symptoms | Possible Causes | Diagnosis & Solutions |
|---|---|---|---|
| Accuracy Problems | Fluctuating or incorrect readings [30]. | Improper calibration, sensor malfunction, external interference, poor grounding [30]. | 1. Check Calibration: Recalibrate regularly [30].2. Clean/Replace Sensors: Address fouling or clogging [30].3. Verify Grounding: Ensure the analyzer is properly grounded [30]. |
| Malfunctioning Sensors | Inconsistent or erratic signals [30]. | Wear and tear, clogging, electrical shorts, open circuits [30]. | 1. Clean/Replace Sensors: Remove debris or replace faulty units [30].2. Check Electrical Continuity: Verify the integrity of the sensor circuit [30]. |
| Electrode Polarization | Consistent measurement errors [30]. | Aged electrodes, improper installation, alignment issues [30]. | 1. Replace Electrodes: Install new electrodes [30].2. Adjust Alignment: Ensure proper positioning [30]. |
| Interfering Ions | Measurement errors due to other ions [30]. | Contaminated samples or cross-contamination [30]. | 1. Use Blank Adjustments: Calibrate properly [30].2. Ensure Clean Samples: Maintain sample purity [30]. |
Guide 2: Troubleshooting Signal-to-Noise Ratio in Redox Assays
This guide helps resolve issues related to poor signal-to-noise ratio (SNR) in analytical methods, a key factor in achieving high sensitivity [105].
| Problem | Impact on SNR | Root Cause | Corrective Actions |
|---|---|---|---|
| High Background Scattering | Poor SNR due to high background interference [105]. | High X-ray scattering in the energy range of interest (e.g., in XRF analysis) [105]. | Apply Optimized Filtering: Use a secondary target or filter (e.g., a 100-140 μm Cu filter for Cr detection) to remove primary photons that cause interfering scattering [105]. |
| Suboptimal Redox Cycling | Low signal amplification [74]. | Inefficient regeneration of signaling species or slow reaction rates [74]. | Optimize Redox Mediators: Use effective redox couples (e.g., TMB/Cysteine) [74] and ensure the presence of necessary catalysts (e.g., Iâ», Cu²âº) to accelerate the cycling process [74]. |
| Electrode Fouling | Drifting or noisy ORP signals. | Build-up of organic matter or coatings on the sensor electrode. | Regular Maintenance: Clean the electrode according to the manufacturer's guide. For critical measurements, keep a spare electrode on hand [106]. |
| Low Signal in Optical Bioassays | Weak colorimetric or fluorescent signal. | Inefficient enzyme catalysis or suboptimal reaction conditions. | Implement Redox Cycling: Use a system like ALP/AAP to generate ascorbic acid, coupled with TCEP to reduce DHA back to AA, creating a signal-amplifying loop [74]. |
Frequently Asked Questions (FAQs)
General ORP and Redox Concepts
1. What is ORP and what does it measure? ORP (Oxidation-Reduction Potential) is a measurement that determines water’s oxidizing or reducing potential. It quantifies a solution's electron transfer capacity in millivolts (mV). Positive values indicate oxidizing conditions (e.g., presence of chlorine, oxygen), while negative values indicate reducing conditions (e.g., presence of hydrogen sulfide, decaying organic matter) [104].
2. How often should I calibrate my ORP analyzer? The frequency must be determined empirically, as the rate of drift and debris accumulation differs for each application. Checking the offset during calibration will indicate if the electrode is still viable [106].
3. What is the typical lifespan of an ORP electrode? ORP electrodes last an average of three years, but this can vary from 6 months to 5 years based on the solution properties being measured, such as pH, flow rate, and ion concentration [106].
Validation and Protocol Design
4. Why is inter-laboratory validation important for redox methods? Inter-laboratory validation establishes that an analytical method provides true, reliable, and reproducible data across different settings. It is critical for standardizing methods, especially when developing new assays or using them outside their intended scope [107]. For example, a pre-validation study for an oxidative stress reporter gene assay showed low variability between labs, confirming its suitability for screening nanomaterials [108].
5. What are the key criteria for validating an examination method? When validating a method, several performance criteria should be assessed [107]:
- Robustness: Test by varying method-critical parameters.
- Selectivity: Ensure the method measures only the intended variable.
- Detection and Quantitation Limits: Identify the limits of linearity.
- Reproducibility and Repeatability: Perform repeated testing to ensure consistent results.
- Correctness: Participate in proficiency testing schemes or use internal quality controls.
Experimental Best Practices
6. How can I improve the sensitivity of a colorimetric redox assay? Integrating redox cycling amplification can significantly improve sensitivity. For instance, in an ELISA, using Alkaline Phosphatase (ALP) to generate ascorbic acid (AA), which is then cycled between its oxidized and reduced forms by a reducing agent like TCEP, can generate abundant colored product and lower detection limits by orders of magnitude [74].
7. What is a "potential buffer" and when is it used? A potential buffer is a solution containing a reversible redox couple (e.g., Fe³âº/Fe²⺠or Fe(CN)₆³â»/Fe(CN)₆â´â»). It is used in potentiometric flow injection analysis to provide a stable measuring potential for a redox electrode. The sample reacts with the buffer, changing its composition and causing a measurable potential shift proportional to the analyte concentration [109].
The Scientist's Toolkit: Key Research Reagent Solutions
| Reagent / Material | Function in Redox Analysis | Example Application |
|---|---|---|
| Fe(III)-Fe(II) Redox Couple | Serves as a core component of a potential buffer solution for stable potentiometric measurement [109]. | Determination of oxidative species like bromate or hydrogen peroxide in flow injection analysis [109]. |
| Tetramethylbenzidine (TMB) | A chromogenic substrate that changes color (colorless to blue) upon oxidation [74]. | Used in HRP-based ELISA and redox-cycling amplified colorimetric assays for Hâ‚‚Oâ‚‚ or cholesterol detection [74]. |
| Tris(2-carboxyethyl)phosphine (TCEP) | A strong reducing agent used to regenerate signaling molecules in redox cycling loops [74]. | Amplifies colorimetric signal in ELISA by reducing dehydroascorbic acid (DHA) back to ascorbic acid (AA) [74]. |
| Ascorbic Acid 2-Phosphate (AAP) | A substrate for alkaline phosphatase (ALP). ALP catalyzes its dephosphorylation to produce ascorbic acid [74]. | Serves as the initial trigger for redox cycling amplification in enzyme-linked immunoassays [74]. |
| Potassium Hexacyanoferrate (III/II) | A reversible redox couple (Fe(CN)₆³â»/Fe(CN)₆â´â») used as a potential buffer [109]. | Potentiometric determination of reducing sugars and other redox-active species [109]. |
| Cerium(IV)-Cerium(III) Couple | A redox couple with a high reduction potential, useful for detecting strong reducing agents [109]. | Determination of trace amounts of hydrazine [109]. |
Standardized Experimental Workflows
Workflow 1: Inter-laboratory Validation Procedure
This standardized procedure ensures a method performs consistently across different laboratories.
Workflow 2: Redox Cycling Amplification Assay
This workflow depicts a general principle for enhancing sensitivity in optical bioassays using redox cycling.
Data Presentation: Key Validation Metrics
Table: Example Inter-laboratory Validation Data for an Oxidative Stress Assay
The following table summarizes quantitative results from a pre-validation study of an NRF2 reporter gene assay used to screen nanobiomaterials for oxidative stress induction. Such data is crucial for assessing the robustness and transferability of a method [108].
| Nanomaterial Tested | Induction of NRF2 | Mean Intra-Lab Standard Deviation | Mean Inter-Lab Standard Deviation |
|---|---|---|---|
| Fe₃O₄-PEG-PLGA | Very Limited | 0.16 | 0.28 |
| Ag (NM300K) | Yes | 0.16 | 0.28 |
| TiOâ‚‚ (NM101) | No | 0.16 | 0.28 |
Source: Adapted from a pre-validation study involving seven laboratories [108].
Conclusion
Optimizing the signal-to-noise ratio in low-cost redox analyzers is not only feasible but essential for expanding access to reliable electrochemical measurements in biomedical research. By integrating foundational knowledge of SNR, applying methodical optimization of electrolytes and redox probes, adhering to rigorous troubleshooting protocols, and validating performance against gold-standard equipment, researchers can achieve data quality comparable to far more expensive systems. The successful implementation of these strategies paves the way for more affordable, portable point-of-care diagnostics and high-throughput drug screening platforms, ultimately accelerating discovery and improving the accessibility of advanced analytical techniques.
References
- 1. Signal-to-noise ratio - Wikipedia [https://en.wikipedia.org/wiki/Signal-to-noise_ratio]
- 2. What is signal-to-noise ratio and how is it measured?| Definition from TechTarget [https://www.techtarget.com/searchnetworking/definition/signal-to-noise-ratio]
- 3. Optimization of Electrolytes with Redox Reagents to ... [https://www.mdpi.com/2079-6374/13/12/999]
- 4. What is Signal to Noise Ratio and How to calculate it? | Advanced PCB Design Blog | Cadence [https://resources.pcb.cadence.com/blog/2020-what-is-signal-to-noise-ratio-and-how-to-calculate-it]
- 5. Signal-to-noise Ratio – S/N ratio, shot noise, detection bandwidth, heterodyne detection, lock-in detection, balanced detection, upconversion, preamplifier [https://www.rp-photonics.com/signal_to_noise_ratio.html]
- 6. 在线å¼ORP分æžä»ªçš„基本工作原ç†ä»‹ç» [https://www.instrument.com.cn/netshow/SH118190/news_803344.htm]
- 7. ORP Sensor Troubleshooting and FAQs [https://www.vernier.com/til/1437?srsltid=AfmBOors9Ua18tT8j6FVR7onZR-z9vwt1-88sVBjERGkBZIcal4ZC6eX]
- 8. Optimization of Electrolytes with Redox Reagents to ... [https://pmc.ncbi.nlm.nih.gov/articles/PMC10741443/]
- 9. FAQ & Support - Sensorex Liquid Analysis Technology [https://sensorex.com/faq-support/?srsltid=AfmBOory-0Pqk_OJU_MqNN3oVBnYX4zxxUbX57VvtZrWxElcHyR8Xudj]
- 10. Electrochemical Noise - an overview [https://www.sciencedirect.com/topics/chemistry/electrochemical-noise]
- 11. Electrochemical noise [https://en.wikipedia.org/wiki/Electrochemical_noise]
- 12. The Basics of Oxidation-Reduction Potential (ORP) [https://www.phionics.com/2021/03/11/the-basics-of-oxidation-reduction-potential/]
- 13. Understanding ORP: Oxidation-Reduction Potential - Blog [https://blog.orendatech.com/understanding-orp]
- 14. Electrochemical Noise [https://www.icorr.org/electrochemical-noise/]
- 15. What is Noise and How to Avoid it in Electrochemical ... [https://electrochemistrystore.com/blogs/experiments/what-is-noise-and-how-to-avoid-it-in-electrochemical-measurements?srsltid=AfmBOor4x2m7OfDI7qPrRjQQS455SJSJuEIKJoD-IX83ujRD21sGPj-w]
- 16. Advances in Imaging-Based Digital Sensing for Biomedical ... [https://www.sciencedirect.com/science/article/abs/pii/S0165993625002742]
- 17. A systematic investigation of detectors for low signal-to- ... [https://pmc.ncbi.nlm.nih.gov/articles/PMC10997989/]
- 18. Improvement of the signal to noise ratio for fluorescent ... [https://pmc.ncbi.nlm.nih.gov/articles/PMC9640556/]
- 19. Remote Sensing Low Signal-to-Noise-Ratio Target ... [https://www.mdpi.com/1424-8220/23/6/3314]
- 20. Signal-to-Noise Ratio Measures Efficacy of Biological ... [https://pmc.ncbi.nlm.nih.gov/articles/PMC4485182/]
- 21. Development and Performance Analysis of a Low-Cost ... [https://www.mdpi.com/2227-9717/12/7/1461]
- 22. A low-cost design approach to vanadium redox flow test cell [https://www.sciencedirect.com/science/article/abs/pii/S0013468624007229]
- 23. Making Sense of PSNR, SSIM, VMAF [https://visionular.ai/vmaf-ssim-psnr-quality-metrics/]
- 24. peak signal to noise ratio - an overview [https://www.sciencedirect.com/topics/computer-science/peak-signal-to-noise-ratio]
- 25. 图åƒè´¨é‡è¯„ä»·æŒ‡æ ‡PSNR å’ŒSSIM - Eslzzyl [https://www.cnblogs.com/eslzzyl/p/17908894.html]
- 26. Peak signal-to-noise ratio [https://en.wikipedia.org/wiki/Peak_signal-to-noise_ratio]
- 27. Peak Signal-to-Noise Ratio as an Image Quality Metric [https://www.ni.com/en/shop/data-acquisition-and-control/add-ons-for-data-acquisition-and-control/what-is-vision-development-module/peak-signal-to-noise-ratio-as-an-image-quality-metric.html?srsltid=AfmBOoqXTBInySUJ-ysGYnyb-hoQBbtiiTxqz9Il-PJPgCGYlj47uzWQ]
- 28. ã€CV知识】PSNR&SSIMæŒ‡æ ‡ - Max Liu's Blog [http://maxliu245.github.io/2021/03/25/%E3%80%90CV%E7%9F%A5%E8%AF%86%E3%80%91PSNR-SSIM%E6%8C%87%E6%A0%87/]
- 29. PSNRã€SSIMç‰å›¾åƒè´¨é‡è¯„ä¼°æŒ‡æ ‡è¯¦è§£åŽŸåˆ› [https://blog.csdn.net/m0_66890670/article/details/144551212]
- 30. How to Troubleshoot ORP Analyzer Issues [https://www.boquinstrument.com/a-how-to-troubleshoot-orp-analyzer-issues.html]
- 31. How to Troubleshoot Your PH ORP Meter's Electrode Issues [https://www.boquinstrument.com/how-to-troubleshoot-your-ph-orp-meter-s-electrode-issues.html]
- 32. Effects of Buffer Concentration on the Sensitivity of Silicon ... [https://pmc.ncbi.nlm.nih.gov/articles/PMC8309807/]
- 33. The impact of ionic and background strength on pH... electrolyte [https://pubmed.ncbi.nlm.nih.gov/16765363/]
- 34. Effects of biologically compatible buffers on the electrical ... [https://www.sciencedirect.com/science/article/abs/pii/S0925400515302975]
- 35. Redox-active electrolyte-based printed ionologic devices [https://www.nature.com/articles/s41467-025-59746-7]
- 36. Practical considerations for using redox probes in ... [https://www.sciencedirect.com/science/article/abs/pii/S0013468624016104]
- 37. Troubleshooting Electrochemical Cell [https://redox.me/blogs/good-measurement-practices/troubleshooting-electrochemical-cell]
- 38. Hydrogen evolution reaction as an environmentally friendly ... [https://www.sciencedirect.com/science/article/abs/pii/S0026265X25035209]
- 39. How to Calculate Signal to Noise Ratio [https://www.horiba.com/usa/scientific/technologies/fluorescence-spectroscopy/how-to-calculate-signal-to-noise-ratio/]
- 40. Low-cost biosensor for rapid detection of SARS-CoV-2 at the ... [https://pmc.ncbi.nlm.nih.gov/articles/PMC8106877/]
- 41. Portable 3D-printed electrochemiluminescence sensor for ... [https://www.nature.com/articles/s41598-025-18109-4]
- 42. A Cost-Effective and Rapid Manufacturing Approach for ... [https://www.mdpi.com/2072-666X/16/3/343]
- 43. Signal-to-Noise Enhancement of a Nanospring Redox ... [https://pubmed.ncbi.nlm.nih.gov/26053754/]
- 44. Top 10 Techniques for Optimizing Manufacturing ... [https://www.fieldex.com/en/blog/top-10-techniques-for-optimizing-manufacturing-processes-in-2025]
- 45. Kalman filter [https://en.wikipedia.org/wiki/Kalman_filter]
- 46. Troubleshoot - Checking ORP Calibration - Help Center [https://helpcenter.vivoaquatics.com/knowledge/how-to-check-orp-probe-calibration]
- 47. The impact of common redox mediators on cellular health [https://pubs.rsc.org/en/content/articlehtml/2025/an/d5an00017c]
- 48. pH Meter Calibration Problems? Check Out These 12 Tips! [https://www.ysi.com/ysi-blog/water-blogged-blog/2013/04/ph-meter-calibration-problems-check-out-these-12-tips?srsltid=AfmBOoqM7d2yw0Qqm5bYL_M-FAK4U8-BozVsZsS4AaU3ZxbOR061GCMR]
- 49. Analysis of environmental pollutants using ion ... [https://www.sciencedirect.com/science/article/abs/pii/S0304389423012359]
- 50. Open-Source Equipment Design for Cost-Effective Redox ... [https://www.mdpi.com/2305-7084/8/6/120]
- 51. Towards a high efficiency and low-cost aqueous redox flow ... [https://www.sciencedirect.com/science/article/abs/pii/S0378775324001939]
- 52. How to Troubleshoot pH Biosensor Problems in 6 Steps [https://www.linkedin.com/advice/1/what-do-you-your-ph-biosensors-working-properly-zkpkf]
- 53. The Example of Blood Glucose Meters [https://www.mdpi.com/2227-9040/13/8/300]
- 54. 5.3: Signal-to-Noise Enhancement [https://chem.libretexts.org/Bookshelves/Analytical_Chemistry/Instrumental_Analysis_(LibreTexts)/05%3A_Signals_and_Noise_(TBD)/5.03%3A_Signal-to-Noise_Enhancement]
- 55. What is Image Denoising? Techniques, Challenges ... [https://www.tredence.com/blog/image-denoising-techniques-challenges-and-solutions]
- 56. Brief review of image denoising techniques | Visual Computing for... [https://vciba.springeropen.com/articles/10.1186/s42492-019-0016-7]
- 57. “Understanding Signal Denoising Techniques: A ... [https://medium.com/@ishi.sohani/understanding-signal-denoising-techniques-a-comprehensive-overview-fc9b2b80d4a4]
- 58. How do you do signal averaging on a realtime data? [https://dsp.stackexchange.com/questions/64215/how-do-you-do-signal-averaging-on-a-realtime-data]
- 59. How to Troubleshoot Common ORP Meter Issues [https://www.boquinstrument.com/a-news-how-to-troubleshoot-common-orp-meter-issues.html]
- 60. Troubleshooting Problems With pH/ORP Sensors [https://nesentrol.com/troubleshooting-problems-with-ph-orp-sensors/]
- 61. pH Electrode Care and Maintenance Procedures [https://www.horiba.com/usa/water-quality/support/technical-tips/electrodes/ph-electrode-care-and-maintenance-procedures/]
- 62. How to Store, Clean, and Recondition pH Electrodes [https://www.coleparmer.com/tech-article/how-to-store-clean-and-recondition-ph-electrodes]
- 63. Cleaning & reconditioning pH electrodes [https://www.chromservis.eu/en/cleaning-reconditioning-ph-electrodes]
- 64. Antifouling Strategies for Electrochemical Biosensing: Mechanisms and... [https://pubmed.ncbi.nlm.nih.gov/33765383/]
- 65. A framework to enhance the signal - to - noise for... | PLOS One ratio [https://journals.plos.org/plosone/article?id=10.1371/journal.pone.0330718]
- 66. Highly selective and antifouling electrochemical biosensors for... [https://link.springer.com/article/10.1007/s00216-020-03025-5]
- 67. Calibration Methods and Best Practices Ensuring Quality ... [https://www.tek.com/en/blog/calibration-methods-and-best-practices-ensuring-quality-and-efficiency]
- 68. Science, Part II: Systematic Error, Calibration - Signal - to ... Noise Ratios [https://www.cannabissciencetech.com/view/calibration-science-part-ii-systematic-error-signal-to-noise-ratios-and-how-to-reduce-random-error]
- 69. How to Create an Optimal Calibration Schedule | Learn More [https://constellationpowerlabs.com/how-to-create-optimal-calibration-schedule]
- 70. Optimal Calibration Parameters for Process Instrumentation [https://blog.beamex.com/optimal-calibration-parameters-for-process-instrumentation]
- 71. How to Optimize Calibration Intervals [https://gagetrak.com/how-to-optimize-calibration-intervals/]
- 72. How to Troubleshoot Common Issues with Your PH ORP ... [https://www.boquinstrument.com/how-to-troubleshoot-common-issues-with-your-ph-orp-meter.html]
- 73. The Role of the Signal-to-Noise Ratio in Precision ... [https://www.chromatographyonline.com/view/role-signal-noise-ratio-precision-and-accuracy-0]
- 74. Optical Bioassays Based on the Signal Amplification of Redox ... [https://pmc.ncbi.nlm.nih.gov/articles/PMC11201508/]
- 75. Sensor Drift: Causes, Mechanisms, and Effective ... [https://zeroinstrument.com/sensor-drift-causes-mechanisms-and-effective-compensation-methods/]
- 76. Signal-to-Noise Enhancement of a Nanospring Redox ... [https://www.mdpi.com/1424-8220/15/6/13110]
- 77. Overcoming the Technical Challenges of Electrochemical ... [https://www.analog.com/en/resources/technical-articles/overcoming-the-technical-challenges-of-electrochemical-gas-sensing.html]
- 78. Signal-to-noise ratio optimization for detecting bacteria with ... [https://www.sciencedirect.com/science/article/abs/pii/S0925400512013172]
- 79. Investigating the Failure Mechanisms of Screen-Printed ... [https://www.ssrn.com/abstract=4690019]
- 80. Multivariate diagnostics of electrochemical sensor drift by ... [https://www.sciencedirect.com/science/article/pii/S2214180425001370]
- 81. Causes of Noise in Electrophysiological Recordings [https://plexon.com/blog-post/causes-of-noise-in-electrophysiological-recordings/]
- 82. Electromagnetic interference (EMI): Identification and ... [https://www.tme.com/us/en-us/news/library-articles/page/68660/electromagnetic-interference-emi-identification-and-prevention-methods-in-electronics/]
- 83. Practical Guide to Detecting Electromagnetic Interference [https://xgrtec.com/blog/practical-guide-to-detecting-electromagnetic-interference/]
- 84. Choosing an Affordable Spectrum Analyzer [https://www.signalintegrityjournal.com/blogs/17-practical-emc/post/2613-choosing-an-affordable-spectrum-analyzer]
- 85. Impedance Analyzer Tutorials [https://www.zhinst.com/china/en/tutorials/impedance-analyzer]
- 86. Exploration of the Impedance Analyzer - Hyer [https://www.hyer.eu/exploration-of-the-impedance-analyzer-a-comprehensive-guide-for-novices/]
- 87. Improvement of the signal to noise ratio for fluorescent ... [https://www.nature.com/articles/s41598-022-23426-z]
- 88. 3.12: Accuracy and Precision [https://chem.libretexts.org/Bookshelves/Introductory_Chemistry/Introductory_Chemistry_(CK-12)/03%3A_Measurements/3.12%3A_Accuracy_and_Precision]
- 89. Accuracy, Precision, Mean and Standard Deviation [https://www.inorganicventures.com/icp-guide/accuracy-precision-mean-and-standard-deviation]
- 90. Accuracy and Precision - UCalgary Chemistry Textbook [https://chem-textbook.ucalgary.ca/version2/review-of-background-topics/measurements-and-data/uncertainty-accuracy-and-precision/accuracy-and-precision/]
- 91. Limit of Blank, Limit of Detection and Limit of Quantitation [https://pmc.ncbi.nlm.nih.gov/articles/PMC2556583/]
- 92. ICH and FDA Guidelines for Analytical Method Validation [https://www.labmanager.com/ich-and-fda-guidelines-for-analytical-method-validation-34252]
- 93. Low-Cost Biosensor Technologies for Rapid Detection of ... [https://pmc.ncbi.nlm.nih.gov/articles/PMC11537281/]
- 94. Exploiting Binding-Induced Changes in Probe Flexibility for ... [https://pmc.ncbi.nlm.nih.gov/articles/PMC2802819/]
- 95. Go Direct ORP Sensor Troubleshooting and FAQs [https://www.vernier.com/til/3967?srsltid=AfmBOooLUld1vP4syTxVfYcHJT5XML8Gx7kdHFRO1dht6-1BgfjbNB9b]
- 96. An integrated high-throughput robotic platform and active ... [https://pmc.ncbi.nlm.nih.gov/articles/PMC10980761/]
- 97. Next-generation vanadium redox flow batteries [https://pubs.rsc.org/en/content/articlehtml/2025/ra/d5ra02901e]
- 98. What are the differences between repeatability and ... [https://www.bettersizeinstruments.com/learn/bettersize-wiki/what-are-the-differences-between-repeatability-and-reproducibility/]
- 99. Reproducibility in Metrology [https://advancedspectral.com/reproducibility-in-metrology/]
- 100. Signal-to-Noise Ratio - an overview [https://www.sciencedirect.com/topics/materials-science/signal-to-noise-ratio]
- 101. Troubleshooting Cyclic Voltammetry and Voltammograms [https://www.ossila.com/pages/cyclic-voltammetry-troubleshooting]
- 102. Long-Term Reproducibility of BMD-Measurements with ... [https://pmc.ncbi.nlm.nih.gov/articles/PMC11531420/]
- 103. The optimization of effective parameters for ... [https://www.sciencedirect.com/science/article/abs/pii/S0263224119301332]
- 104. Understanding Oxidation-Reduction Potential (ORP) in Water [https://www.ysi.com/parameters/orp-redox?srsltid=AfmBOorxnb_876-W8bbUWKlsQKllllq5u8DOcvLhfOP4CySBCtxoLOcP]
- 105. Signal-to-noise ratio optimization in X-ray fluorescence ... [https://www.sciencedirect.com/science/article/pii/S0039914021001570]
- 106. STs Series ORP (redox) FAQ [https://www.phionics.com/resources/sts-series-orp-faq/]
- 107. Write an SOP on validation of examinations and equipment [https://extranet.who.int/lqsi/content/write-sop-validation-examinations-and-equipment]
- 108. Pre-validation of a reporter gene assay for oxidative stress for ... [https://pmc.ncbi.nlm.nih.gov/articles/PMC9511406/]
- 109. Rapid and Automated Analytical Methods for Redox ... [https://pmc.ncbi.nlm.nih.gov/articles/PMC3092505/]