A Researcher's Guide to Minimizing Oxidative Damage in Redox Measurements
Accurate measurement of reactive oxygen species (ROS) and redox potential is critical for biomedical research, yet the reactive and short-lived nature of these species makes measurements prone to artifacts and...
A Researcher's Guide to Minimizing Oxidative Damage in Redox Measurements
Abstract
Accurate measurement of reactive oxygen species (ROS) and redox potential is critical for biomedical research, yet the reactive and short-lived nature of these species makes measurements prone to artifacts and oxidative damage during the assay process itself. This article provides a comprehensive framework for researchers and drug development professionals to overcome these challenges. It covers the foundational principles of redox chemistry, details best-practice methodologies for direct and indirect measurement, offers troubleshooting strategies for sample handling and assay selection, and outlines a rigorous approach for data validation. By integrating these strategies, scientists can generate more reliable, reproducible, and biologically relevant redox data to advance therapeutic development and clinical diagnostics.
Understanding Redox Biology and the Sources of Measurement Artifact
In redox biology research, a clear understanding of core concepts and precise measurement techniques is fundamental to obtaining reliable data and minimizing experimental artifacts. This guide provides troubleshooting support for common challenges encountered during research on Reactive Oxygen Species (ROS), oxidative stress, and redox homeostasis.
- Reactive Oxygen Species (ROS) is a collective term for a variety of oxygen-derived, chemically reactive molecules, including both radicals (e.g., superoxide, O₂•â»; hydroxyl, OH•) and non-radicals (e.g., hydrogen peroxide, Hâ‚‚Oâ‚‚). They are not a single entity and possess vastly different chemical reactivities, biological lifespans, and cellular targets [1] [2].
- Oxidative Stress is formally defined as "an imbalance between oxidants and antioxidants in favor of the oxidants, leading to a disruption of redox signaling and control and/or molecular damage" [2]. It's crucial to differentiate between eustress (physiological, signaling roles) and distress (pathological, damaging roles) [3].
- Redox Homeostasis refers to the dynamic equilibrium where the generation of oxidants is balanced by the action of antioxidant systems, allowing for proper redox signaling while preventing molecular damage [4] [3]. Disruption of this balance is a hallmark of many pathophysiological processes.
? Frequently Asked Questions (FAQs)
1. My ROS detection assay shows high signal, but my oxidative damage markers are low. What does this mean? This discrepancy often indicates that the observed ROS are likely functioning in signaling (eustress) rather than causing damage. Signaling molecules like Hâ‚‚Oâ‚‚ are less reactive and exist at low, controlled concentrations [1]. Ensure you are using specific probes and confirm results with multiple methods. A functional antioxidant system may also be effectively scavenging the ROS [2].
2. Why do I get different oxidative potential (OP) results when using protocols from different literature? Variations in OP results are frequently due to differences in calculation methods, not just the assays themselves. A 2025 study showed that using the ABS and CC2 calculation methods provides more consistent results for both dithiothreitol (OPDTT) and ascorbic acid (OPAA) assays compared to other methods, which can cause variations of over 10-18% [5]. Always explicitly detail the calculation method in your protocol.
3. I used a common "antioxidant" like N-acetylcysteine (NAC), but saw no effect on my Hâ‚‚O2 measurement. Why? Many so-called "antioxidants" have specific and limited targets. NAC has low reactivity with Hâ‚‚Oâ‚‚ and its effects are often due to other mechanisms, such as boosting cellular glutathione levels or cleaving protein disulfides [1]. The effect of an intervention should only be attributed to an antioxidant activity if it is chemically plausible for the specific ROS being studied.
4. How can I be sure I'm measuring a specific ROS and not something else? No single method is perfectly specific. The best practice is to use a multi-faceted approach [2] [6]. Combine direct ROS detection methods with measurements of downstream oxidative damage biomarkers (e.g., lipid peroxidation, protein carbonylation) and assessments of the antioxidant defense system. Using genetically encoded systems for controlled ROS generation can also provide more definitive evidence [1].
Troubleshooting Guides
Guide 1: Selecting and Validating ROS Detection Probes
A frequent source of error is the inappropriate use and interpretation of fluorescent ROS probes.
Table 1: Troubleshooting Common ROS Detection Probes
| Probe/Assay | Intended Target | Common Pitfalls & Limitations | Best Practice Solutions |
|---|---|---|---|
| Dihydroethidium (DHE) | Superoxide (O₂•â») | Oxidized to both 2-OH-E+ (specific) and ethidium (non-specific); fluorescence overlap causes false positives [7]. | Use HPLC separation to specifically quantify the 2-hydroxyethidium (2-OH-E+) adduct [7]. |
| Dichlorodihydrofluorescein (DCFH) | General Oxidants | Often mistakenly used for Hâ‚‚Oâ‚‚; it does not react directly with Hâ‚‚Oâ‚‚. It is oxidized by various one-electron oxidants and can itself redox cycle, generating more ROS [7]. | Avoid for quantitative Hâ‚‚O2 measurement. If used, interpret results as "cellular oxidative activity" and confirm with a more specific method [1]. |
| Dihydrorhodamine (DHR) | Peroxynitrite (ONOOâ») | Not specific; also oxidized by other one-electron oxidants like HOCl. The intermediate radical can be reduced by cellular antioxidants, leading to false negatives [7]. | Use as a general indicator of strong one-electron oxidants, not as a definitive ONOOâ» probe [7]. |
| Amplex Red | Hydrogen Peroxide (H₂O₂) | Highly specific in simple systems, but can be interfered with by reducing agents (e.g., apocynin, NADH). The presence of O₂•⻠can alter the assay's stoichiometry [7]. | Add superoxide dismutase (SOD) to the assay to convert O₂•⻠to H₂O₂ and ensure accurate quantification [7]. |
Guide 2: Standardizing Oxidative Potential (OP) Calculations
Inconsistent calculation methods are a major source of variability in OP studies. Follow this workflow to ensure comparability.
Recommended Protocol:
- Measure: Obtain absorbance values over time for your PM sample and appropriate blanks.
- Calculate Slope: Apply linear regression to the initial, linear phase of the reaction to determine the consumption rate (slope, k).
- Apply Methods: Use the ABS (based on raw absorbance) and CC2 (based on concentration) methods for calculation, as they show the best agreement across different sample types [5].
- Normalize: Normalize the final OP value by air volume and/or sampled mass.
- Report: Explicitly state the calculation method (ABS or CC2) in your manuscript to enable cross-study comparisons.
Guide 3: A Multi-Faceted Approach to Assess Oxidative Stress
Relying on a single assay gives an incomplete picture. The diagram below outlines an integrated strategy.
? The Scientist's Toolkit: Essential Reagents & Materials
Table 2: Key Reagent Solutions for Redox Research
| Reagent / Assay | Primary Function | Critical Notes on Usage |
|---|---|---|
| Dithiothreitol (DTT) Assay | Measures the oxidative potential (OPDTT) of samples by monitoring DTT consumption [5]. | Standardize calculation methods (prefer ABS/CC2); results vary with method choice [5]. |
| Ascorbic Acid (AA) Assay | Measures the oxidative potential (OPAA) of samples by monitoring ascorbic acid consumption [5]. | Similar to DTT assay, ensure calculation method is consistent and reported [5]. |
| Superoxide Dismutase (SOD) | Enzymatic scavenger of superoxide (O₂•â»). Converts O₂•⻠to Hâ‚‚Oâ‚‚ [3]. | Use as a tool to confirm the involvement of O₂•⻠in a detected signal or process [7]. |
| Catalase | Enzymatic scavenger of hydrogen peroxide (Hâ‚‚Oâ‚‚). Converts Hâ‚‚Oâ‚‚ to water and oxygen [3] [8]. | Use to confirm the specific involvement of Hâ‚‚Oâ‚‚ in an observed biological effect. |
| N-acetylcysteine (NAC) | A precursor for glutathione synthesis and a thiol reductant [1]. | Do not interpret effects solely as Hâ‚‚Oâ‚‚ scavenging; it has low reactivity with Hâ‚‚Oâ‚‚ and multiple other modes of action [1]. |
| MitoSOX Red | Mitochondria-targeted fluorescent probe for superoxide [7]. | Subject to the same limitations as DHE; requires HPLC validation for specific 2-OH-E+ detection to confirm O₂•⻠[7]. |
| Amplex Red | Fluorogenic substrate for highly sensitive detection of Hâ‚‚Oâ‚‚ via horseradish peroxidase (HRP) [7]. | Add SOD to the assay to prevent interference from superoxide. Be aware of potential auto-oxidation [7]. |
| Spin Traps (e.g., DMPO) | Compounds that form stable adducts with short-lived radicals for detection by Electron Paramagnetic Resonance (EPR) [7]. | React slowly with O₂•⻠and require high, potentially toxic concentrations. Newer analogs (e.g., DEPMPO) offer some improvements [7]. |
| Ferric glycinate | Ferrous Bisglycinate | High Purity Iron Supplement | High purity Ferrous Bisglycinate for research. Study its superior bioavailability & GI tolerance. For Research Use Only (RUO). Not for human consumption. |
| 2-Aminobenzimidazole | 2-Aminobenzimidazole | High-Purity Reagent | High-purity 2-Aminobenzimidazole for research applications. For Research Use Only. Not for human or veterinary diagnostic or therapeutic use. |
FAQs on Reactive Oxygen Species (ROS) in Research
1. What does the "double-edged sword" nature of ROS mean in practical research terms? In experimental biology, the "double-edged sword" refers to the context-dependent effects of Reactive Oxygen Species (ROS). At low or moderate concentrations, ROS function as crucial signaling molecules that activate pathways promoting cell proliferation and survival, such as the PI3K/Akt and NF-κB pathways [9] [10]. However, at high concentrations, ROS cause oxidative damage to lipids, proteins, and DNA, leading to cell death pathways like apoptosis and autophagy [9] [11]. This duality means that experimental outcomes are highly sensitive to the exact ROS levels, which are influenced by the cellular model, the timing of measurements, and the subcellular location of ROS production [10] [1].
2. Why is my assay for "total ROS" giving misleading or inconsistent results? The term "ROS" encompasses a diverse range of chemical species with vastly different reactivities and biological half-lives [1]. Common problems arise from:
- Probe Specificity: Many commercial "total ROS" probes, like H2DCFDA, are non-specific and can be oxidized by various ROS/RNS, or their signal can be influenced by cellular factors like pH or peroxidase activity [1] [12].
- Probe Localization: A probe that localizes to the cytosol will not detect ROS generated in the mitochondria or other organelles, leading to an incomplete picture [12].
- Calibration and Artifacts: Probes can undergo auto-oxidation or be influenced by other environmental factors, producing artifacts. It is critical to use appropriate controls and validate results with multiple methods [1].
3. What are the best practices for selectively measuring a specific ROS, like superoxide or hydrogen peroxide? Best practices involve using tools and reagents designed for specific ROS [1] [12]:
- Superoxide: Use MitoSOX Red or MitoSOX Green reagents for selective detection of mitochondrial superoxide. For cytosolic superoxide, dihydroethidium (DHE) can be used, but its oxidation products require careful characterization to confirm specificity [12].
- Hydrogen Peroxide: Genetically encoded sensors like roGFP (rationetric) or the Premo Cellular H2O2 Sensor allow for specific and often rationetric detection of H2O2, which is more reliable than chemical probes susceptible to interference [1] [12]. Always corroborate findings using complementary techniques, such as measuring specific byproducts of oxidative damage or using enzymatic inhibitors.
4. How can I effectively modulate ROS levels in my experiments without causing off-target effects?
- To Increase ROS:
- Selectively: Use compounds like paraquat to generate superoxide or MitoPQ to target superoxide production to mitochondria. For controlled H2O2 generation, consider genetically expressing d-amino acid oxidase (DAAO) and titrating its substrate, d-alanine [1].
- Inhibitors: Avoid non-specific inhibitors like apocynin or diphenyleneiodonium (DPI). Instead, use validated, specific NOX inhibitors or genetic knockdown/knockout of NOX isoforms [1].
- To Decrease ROS (Antioxidants): Be precise. The term "antioxidant" is overly broad. Use specific compounds like Tempol or mito-TEMPO (superoxide dismutase mimetics) or boost endogenous systems (e.g., by providing precursors for glutathione synthesis). Note that common "antioxidants" like N-acetylcysteine (NAC) have multiple biological effects beyond ROS scavenging [1].
5. Why might my antioxidant treatment be failing to show a protective effect in my model of oxidative damage? Several factors could be at play:
- Incorrect Targeting: The antioxidant may not be reaching the correct subcellular compartment where the pathological ROS are being generated (e.g., the mitochondrial matrix) [13].
- Ineffective Scavenging: Many small-molecule antioxidants are poor scavengers of specific ROS like H2O2. Their efficacy is highly dependent on concentration, reactivity, and location [1].
- Disruption of Redox Signaling: Non-specific scavenging can inadvertently quench physiologically important ROS signals that are required for normal cellular function and adaptive responses (a process known as mitohormesis) [13].
- Pro-oxidant Effects: Some antioxidants, including ascorbate and carotenoids, can act as pro-oxidants under certain conditions, such as in the presence of transition metal ions [13].
Troubleshooting Guides for Redox Measurements
Guide 1: Troubleshooting Common ORP (Redox Potential) Meter Problems
ORP meters measure the oxidation-reduction potential of a solution, providing a global measure of its redox balance. Common issues and solutions are [14] [15]:
| Problem | Possible Causes | Solutions |
|---|---|---|
| Inaccurate Readings | Dirty or contaminated probe; expired calibration solution; old or degraded electrode. | Clean the probe (distilled water, fine polishing powder); use fresh calibration solution; replace old electrode [15]. |
| Slow Response Time | Dirty probe; aging electrode; temperature of the measured liquid is outside the recommended range. | Clean the probe thoroughly; ensure sample temperature is correct; replace aged electrode [15]. |
| Drift in Readings | Normal wear of the reference electrode; reaction to trace impurities or dissolved oxygen (in pure water). | This is expected over time. For pure water, use flow fittings to eliminate interference from atmospheric oxygen [14]. |
| Failure to Calibrate | Defective electrode; dirty probe; expired calibration solution. | Follow manufacturer's instructions for recalibration; clean probe; use fresh solution [15]. |
| Sensor Not Turning On | Dead batteries; broken or incorrectly plugged power cord. | Replace batteries; inspect and properly connect the power cord [15]. |
Guide 2: Troubleshooting Specific ROS Detection Assays
This guide addresses common pitfalls in fluorescence-based ROS detection.
| Assay | Common Pitfalls | Best Practice Solutions |
|---|---|---|
| General ROS (e.g., H2DCFDA) | Lack of specificity; photo-instability; auto-oxidation; signal influenced by cellular esterase activity and pH. | Use as a preliminary tool; confirm results with more specific probes. Include rigorous controls (e.g., antioxidant-treated, ROS-generating) and minimize light exposure [1]. |
| Mitochondrial Superoxide (MitoSOX) | Potential off-target oxidation; signal overlap with other fluorophores; two excitation peaks (396 nm and 510 nm) can cause confusion. | For selective detection, use an excitation of 396 nm instead of 510 nm. Use in combination with mitochondrial inhibitors/uncouplers to validate the source [12]. |
| Lipid Peroxidation (e.g., Image-iT Kit) | The BODIPY 581/591 C11 probe can be photosensitive. The assay measures a process, not a single molecule. | Use the ratiometric measurement (shift from red to green fluorescence) to confirm specificity. Protect from light during staining and imaging [12]. |
| Glutathione Levels (e.g., ThiolTracker) | Measures total low-molecular-weight thiols, not just GSH. Fixation can affect signal. | Use in live cells for best results. Correlate with other measures of redox status, such as GSH/GSSG ratio assays [12]. |
Research Reagent Solutions for Redox Biology
The table below details key reagents for detecting and modulating ROS in experimental models [1] [12].
| Reagent Name | Specificity / Function | Key Applications & Notes |
|---|---|---|
| MitoSOX Red/Green | Mitochondrial Superoxide | Live-cell imaging, flow cytometry. Highly selective for superoxide in mitochondria [12]. |
| CellROX Reagents | General Oxidative Stress | Live-cell compatible, fluoresce upon oxidation by ROS. Different colors (Green, Orange, Deep Red) allow multiplexing [12]. |
| H2DCFDA | Broad-Spectrum ROS | Detects peroxides, but is non-specific. Susceptible to artifacts; best for initial screens [12]. |
| roGFP Sensors | Rationetric H2O2 | Genetically encoded; provides rationetric readout (Ex400/488, Em515), highly specific for H2O2 and redox potential [1] [12]. |
| Image-iT Lipid Peroxidation Kit | Lipid Peroxidation | Uses BODIPY 581/591 C11; ratiometric shift (red to green) upon oxidation; ideal for live-cell analysis [12]. |
| Paraquat (PQ) | Superoxide Generator | Redox-cycling compound that generates superoxide primarily in the cytosol [1]. |
| MitoPQ | Mitochondrial Superoxide Generator | Conjugates paraquat to a triphenylphosphonium cation, targeting superoxide production specifically to mitochondria [1]. |
| d-Amino Acid Oxidase (DAAO) | Controlled H2O2 Generation | Genetically expressed enzyme; allows precise, titratable generation of H2O2 by adding d-alanine substrate [1]. |
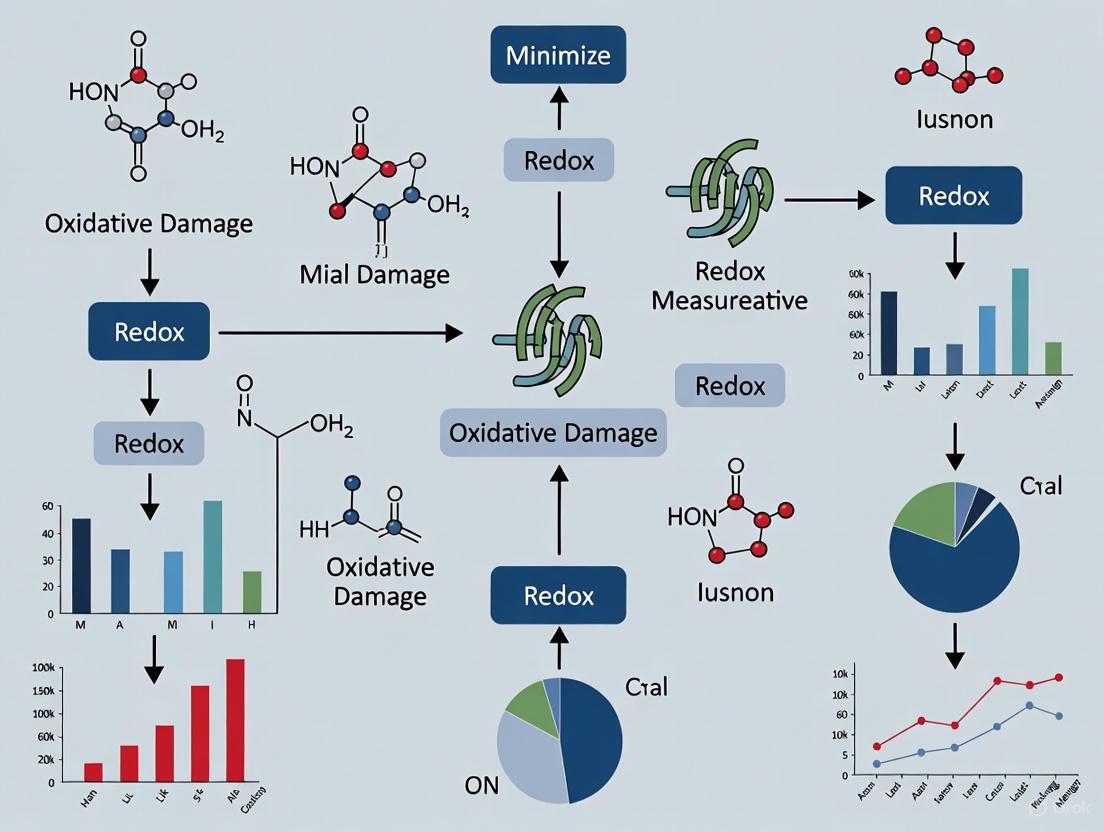
Experimental Workflow for Reliable Redox Measurement
The following diagram outlines a robust methodology for investigating ROS, from experimental design to data interpretation, emphasizing practices that minimize oxidative damage and artifacts.
Diagram 1: A workflow for reliable redox measurement in research, emphasizing method selection, validation, and damage assessment.
Key Signaling Pathways Modulated by ROS
The dual role of ROS is mediated through its impact on critical cellular signaling pathways. The diagram below illustrates how different ROS concentrations influence these pathways, leading to divergent cellular outcomes.
Diagram 2: Key cellular signaling pathways modulated by different concentrations of ROS, showing the double-edged sword effect.
Accurately measuring reactive oxygen species (ROS) and oxidative damage is fundamental to redox biology research. However, many common laboratory techniques can inadvertently introduce oxidative artifacts, skewing experimental results and leading to flawed conclusions. This guide details specific pitfalls and provides validated protocols to help researchers obtain reliable data by minimizing technique-induced oxidative damage.
FAQs on Measurement Pitfalls and Solutions
How can the use of fluorescent probes lead to oxidative damage?
Fluorescent probes, while widely used, are a major source of artifactural oxidative stress.
- Pitfall: Probes like DCFDA can undergo auto-oxidation or produce ROS, particularly under light exposure, leading to overestimation of cellular ROS levels [16]. Furthermore, to detect a signal, these probes must react with ROS, thereby scavenging them and potentially perturbing the very redox signalling pathways under investigation [1].
- Solution:
- Minimize Light Exposure: Keep plates and samples in the dark as much as possible during staining and analysis.
- Shorten Incubation: Use the shortest possible probe incubation time.
- Include Controls: Always run vehicle-only controls (probe without experimental treatment) and unstained cells to account for background auto-oxidation.
- Validate with Specific Assays: Confirm key findings with alternative, non-fluorescent methods, such as Electron Spin Resonance (ESR) or by measuring stable oxidative damage biomarkers like malondialdehyde (MDA) or protein carbonyls [2].
What are the common mistakes when using 'antioxidants' in experiments?
The term 'antioxidant' is often used imprecisely, leading to chemically implausible experimental interpretations [1].
- Pitfall: Using a single, non-specific "antioxidant" (e.g., N-acetylcysteine, NAC) and attributing any biological effect solely to ROS scavenging. NAC has low reactivity with Hâ‚‚Oâ‚‚ and can affect cells through other mechanisms, such as altering glutathione levels or cleaving protein disulphides [1]. Many compounds like TEMPOL are better described as 'redox modulators' rather than specific scavengers [1].
- Solution:
- Define the Mechanism: Explicitly state the specific ROS the antioxidant is intended to target.
- Verify Chemical Plausibility: Ensure the antioxidant's rate constant, cellular concentration, and location make the proposed effect feasible.
- Confirm Activity: Use multiple antioxidants with different mechanisms and confirm their effect by demonstrating a measurable decrease in a specific oxidative damage marker [1].
- Use Genetic Tools: Where possible, use genetic models (e.g., NOX knockdown) or controlled ROS-generation systems (e.g., d-amino acid oxidase) to complement pharmacological approaches [1].
How can sample preparation artificially increase oxidative damage?
The process of getting a sample ready for analysis is a critical point where oxidative artifacts can be introduced.
- Pitfall: Homogenizing tissue without a suitable buffer can release free transition metal ions (e.g., Fe²âº, Cuâº) from storage proteins. In the presence of ambient oxygen or residual Hâ‚‚Oâ‚‚, these ions can catalyze Fenton chemistry, generating highly reactive hydroxyl radicals (•OH) that oxidize biomolecules in the test tube [1].
- Solution:
- Use Chelating Agents: Include metal chelators (e.g., diethylenetriaminepentaacetic acid - DTPA) in all homogenization and storage buffers to sequester free metal ions.
- Maintain Low Temperature: Perform homogenizations on ice.
- Add Enzyme Inhibitors: Include inhibitors of enzymes that produce ROS (e.g., xanthine oxidase) during sample preparation.
Why is measuring a single oxidative stress marker insufficient?
Relying on a single assay often provides an incomplete and potentially misleading picture of the redox state.
- Pitfall: A change in one biomarker (e.g., lipid peroxidation) does not reflect changes in other macromolecules (e.g., protein or DNA oxidation). Furthermore, the level of any damage marker is a net result of its production and removal by repair and degradation systems [2].
- Solution: Adopt a multi-faceted approach [17]. Measure multiple biomarkers across different classes to build a comprehensive profile. Table: Key Categories of Oxidative Stress Assessments
| Assessment Category | Specific Biomarkers | Key Considerations |
|---|---|---|
| Lipid Peroxidation | Malondialdehyde (MDA), 4-Hydroxynonenal (4-HNE), 8-isoprostane [18] [16] | TBARS assay is common but not entirely specific for MDA [16]. |
| Protein Oxidation | Protein carbonyls, 3-nitrotyrosine, Advanced Oxidation Protein Products (AOPP) [18] [16] | Protein carbonyls are a broad marker of protein oxidation [2]. |
| DNA/RNA Damage | 8-hydroxydeoxyguanosine (8-OHdG), AP sites [2] [18] | 8-OHdG is a predominant and commonly measured lesion [2]. |
| Antioxidant Status | GSH/GSSG ratio, Enzyme activities (SOD, Catalase, GPx) [2] [16] | The GSH/GSSG ratio indicates the cellular redox state [16]. |
What are the pitfalls of common "Total Antioxidant Capacity" (TAC) assays?
Assays like ORAC, FRAP, and TEAC are popular but have significant limitations for biological systems.
- Pitfall: These assays provide an oversimplified, non-physiological measure by testing the ability of a complex sample to reduce a single oxidant in a test tube. This does not reflect the compartmentalized, enzyme-driven antioxidant defense network within a cell [18]. The concept of "total" antioxidant capacity has been strongly criticized for its lack of in vivo relevance [18].
- Solution:
- Measure Specific Enzymes: Quantify the activity of key endogenous antioxidant enzymes like superoxide dismutase (SOD), catalase (CAT), and glutathione peroxidase (GPx) [2].
- Measure Specific Molecules: Determine the levels of individual antioxidants like glutathione (and its redox ratio), vitamin E, and ascorbate.
- Interpret with Caution: Use TAC assays only for initial screening and always complement them with more specific analyses of the antioxidant defense system.
Troubleshooting Guides
Problem: Inconsistent results from the TBARS (lipid peroxidation) assay.
The TBARS assay is a common but tricky method for assessing lipid peroxidation via malondialdehyde (MDA).
- Potential Causes & Solutions:
- Interference from other compounds.
- Solution: For more specific results, use an HPLC- or GC-MS-based method to quantify MDA or other specific peroxidation products like 4-HNE [2].
- Variability in sample heating time and temperature.
- Solution: Strictly adhere to the optimized protocol for the assay kit. Use a calibrated heat block and a timer to ensure consistent heating across all samples.
- High background in reagent blanks.
- Solution: Prepare fresh thiobarbituric acid (TBA) reagent and use high-purity water. Ensure all glassware is meticulously cleaned to avoid contamination.
- Interference from other compounds.
Problem: No signal or low signal from fluorescent ROS probes.
A weak signal can be misinterpreted as low ROS when it may be a technical failure.
- Potential Causes & Solutions:
- Probe is degraded.
- Solution: Aliquot probes upon arrival and store at the recommended temperature (often -20°C or lower, protected from light). Avoid repeated freeze-thaw cycles.
- Incorrect loading conditions.
- Solution: Confirm the optimal loading concentration, temperature, and duration for your specific cell type. A loading temperature of 37°C is often necessary for proper probe uptake and esterification.
- Instrument settings are not optimized.
- Solution: Use a positive control (e.g., cells treated with a known ROS inducer like paraquat or menadione) to establish robust signal detection and set appropriate instrument gains [1].
- Probe is degraded.
Standard Operating Procedure: Measuring Lipid Peroxidation via TBARS with Minimal Artifacts
Principle: This protocol quantifies malondialdehyde (MDA), a secondary product of lipid peroxidation, by its reaction with thiobarbituric acid (TBA) to form a pink chromophore that can be measured colorimetrically [16].
Reagents:
- Lysis Buffer: 50 mM Potassium Phosphate Buffer, pH 7.4, containing 1 mM DTPA (metal chelator).
- TBA Reagent: 0.375% Thiobarbituric acid in 0.25M HCl.
- MDA Standard: A series of dilutions from a 1M Tetramethoxypropane (MDA precursor) stock.
- Butylated Hydroxytoluene (BHT): 0.01% in the lysis buffer to prevent further peroxidation during the assay.
Procedure:
- Sample Preparation: Homogenize tissue or lyse cells in ice-cold lysis buffer containing BHT and DTPA. Centrifuge at 10,000 x g for 10 minutes at 4°C to remove debris.
- Reaction Setup:
- Mix 100 µL of clear supernatant with 200 µL of TBA reagent in a microcentrifuge tube.
- Prepare a standard curve with known MDA concentrations and a blank (lysis buffer only).
- Incubation: Cap the tubes tightly and incubate in a heating block at 95°C for 60 minutes exactly.
- Cooling & Measurement: Immediately cool the tubes on ice for 10 minutes. Centrifuge briefly to pellet any precipitate.
- Absorbance Reading: Transfer 200 µL of the supernatant to a clear 96-well plate. Measure the absorbance at 532 nm against the blank [16].
Analysis: Calculate the MDA concentration in your samples by comparing their absorbance to the standard curve. Normalize the values to the total protein content of the sample.
Experimental Pathways and Workflows
Artifact Formation Pathway in Redox Measurements
Best-Practice Workflow for Reliable Redox Assessment
The Scientist's Toolkit: Key Research Reagents
Table: Essential Reagents for Minimizing Artifacts in Redox Biology
| Reagent / Tool | Function | Considerations for Use |
|---|---|---|
| Metal Chelators(e.g., DTPA, Desferoxamine) | Sequesters free metal ions (Fe²âº, Cuâº) to prevent Fenton chemistry during sample prep [1]. | Include in all homogenization and storage buffers. Choose a chelator specific for the metal of concern. |
| Controlled ROS Generators(e.g., d-amino acid oxidase, MitoPQ, paraquat) | Provides a specific, regulated source of ROS (Hâ‚‚Oâ‚‚ or O₂•â») to study downstream effects without crude oxidant addition [1]. | Allows for spatial and temporal control of ROS generation. Preferable to adding high doses of Hâ‚‚Oâ‚‚ directly. |
| Specific NOX Inhibitors(e.g., GKT136901) | More selective inhibition of NADPH Oxidase (NOX) enzymes [1]. | Avoid non-specific inhibitors like apocynin or diphenyleneiodonium (DPI) as sole evidence for NOX involvement [1]. |
| Validated Fluorescent Probes(e.g., DCFDA, MitoSOX Red) | Detects general ROS or specific species like mitochondrial superoxide in live cells [16]. | Acknowledge limitations: potential for artifact, scavenging behavior. Always include stringent controls and validate findings. |
| ESR (Electron Spin Resonance) | The "gold standard" for direct detection and identification of free radicals due to their unpaired electrons [2]. | Technically demanding and requires specialized equipment. Often used with spin traps to stabilize short-lived radicals. |
| Stable Biomarker Assay Kits(e.g., for MDA, Protein Carbonyls, 8-OHdG) | Measures enduring products of oxidative damage to lipids, proteins, and DNA, providing a snapshot of cumulative stress [18] [16]. | Prefer kits that use HPLC or ELISA for higher specificity over less specific methods like the TBARS assay. |
| Orcokinin | Orcokinin Peptide | Research-grade Orcokinin for studying reproduction, sleep, and pigmentation. This product is for Research Use Only (RUO). Not for human or veterinary use. |
| Strombine | (S)-2-((Carboxymethyl)amino)propanoic Acid|RUO |
Core Concepts: ROS Chemical Diversity
Reactive Oxygen Species (ROS) is a collective term for a variety of oxygen-containing, chemically reactive molecules and radicals. Their pronounced differences in reactivity, half-life, and biological activity mean that treating "ROS" as a single entity is a primary source of experimental error. The key ROS, their lifetimes, and their primary chemical characteristics are summarized in Table 1.
Table 1: Key Reactive Oxygen Species (ROS) and Their Properties
| ROS Species | Chemical Formula | Half-Life | Reactivity and Key Characteristics |
|---|---|---|---|
| Hydroxyl Radical | •OH | ~10â»â¹ seconds [19] | Extremely reactive; non-selectively oxidizes all nearby biomolecules; formed via Fenton reaction [20] [21]. |
| Superoxide Anion | O₂•⻠| Milliseconds (enzyme-dependent) [22] | Relatively less reactive; cannot cross membranes; key precursor to other ROS; reacts with •NO to form peroxynitrite [20] [23]. |
| Hydrogen Peroxide | Hâ‚‚Oâ‚‚ | Stable (minutes) [22] | Poorly reactive; membrane-permeable; major redox signaling molecule; substrate for peroxidases [20] [24]. |
| Singlet Oxygen | ¹O₂ | Microseconds [22] | Highly reactive; can be generated by photosensitizers; oxidizes unsaturated lipids [21] [23]. |
| Peroxynitrite | ONOO⻠| < 1 second [22] | Powerful oxidant; formed in a rapid reaction between superoxide and nitric oxide (•NO) [25] [21]. |
The biological impact of a specific ROS is dictated by this combination of reactivity and lifetime. Highly reactive species like the hydroxyl radical cause immediate, localized damage, while more stable molecules like hydrogen peroxide can diffuse from its site of production and act as a widespread signaling messenger [20] [26].
Troubleshooting Common Experimental Issues
FAQ 1: My "total ROS" measurement with a commercial probe increased, but I cannot link it to a specific biological outcome. What is wrong?
Issue: The problem likely stems from treating ROS as a single entity. Commercial probes often lack specificity and may react with multiple ROS or even other cellular oxidants, providing a misleading "total ROS" signal that is chemically ambiguous [20].
Solution:
- Identify the Specific ROS: Base your experimental design on a hypothesis about a specific ROS. Use tools that modulate or measure particular species.
- Use Selective Probes and Inhibitors: Employ chemically validated, selective probes for specific ROS where possible. Correlate measurements with the use of selective genetic or pharmacological tools, not just general "antioxidants" [20].
- Measure Downstream Markers: Supplement probe data with direct measurements of specific oxidative damage biomarkers, such as lipid peroxidation products, oxidized proteins (e.g., carbonylated proteins), or oxidized DNA bases (e.g., 8-oxo-dG) [20] [23].
FAQ 2: I used a common "antioxidant" like N-acetylcysteine (NAC), but my results are confusing or contradictory. Why?
Issue: Many commonly used "antioxidants" have pleiotropic and non-specific effects. NAC, for example, is a poor direct scavenger of Hâ‚‚Oâ‚‚. Its effects are often attributed to boosting cellular glutathione levels, cleaving disulfide bonds, or other non-antioxidant signaling roles [20].
Solution:
- Define the Mechanism: For any intervention, state the specific chemical species it is supposed to target and provide evidence that this action is chemically plausible in your experimental context (consider its rate constant, location, and concentration) [20].
- Use Targeted Tools: Replace non-specific agents with more targeted tools.
- Confirm Antioxidant Effect: Where possible, confirm that the "antioxidant" actually decreased a specific marker of oxidative damage in your system [20].
FAQ 3: My assays for oxidative damage are highly variable. How can I improve reliability?
Issue: The final measured level of any oxidative damage biomarker is a net result of its rate of production and its rate of removal by repair, degradation, and excretion systems. High variability can arise from not controlling for these metabolic clearance pathways [20].
Solution:
- Explicitly Define Chemistry: In your methods, explicitly state the chemical processes by which your measured biomarker is formed and the exact method used for its quantification [20].
- Control for Repair Systems: Consider the activity of cellular repair systems (e.g., DNA repair enzymes, glutathione peroxidases) when interpreting data. Assays should ideally be conducted under conditions where repair is inhibited or accounted for.
- Use Multiple Assays: Do not rely on a single method. Use multiple, well-validated techniques (e.g., HPLC-MS, immunohistochemistry with validated antibodies) to quantify the same biomarker for confirmation [20] [23].
Experimental Protocols & Best Practices
Protocol 1: Selective Generation of Specific ROS
To establish a causal link between a specific ROS and a biological outcome, controlled generation is more powerful than blanket induction of oxidative stress.
- Superoxide (O₂•â») Generation:
- Reagents: Paraquat (PQ) or other quinones to induce cytosolic superoxide; MitoPQ to selectively generate superoxide within the mitochondrial matrix [20].
- Methodology: Treat cells or model organisms with defined concentrations of PQ or MitoPQ. Always confirm increased superoxide production using a specific method like HPLC-based detection of 2-hydroxyethidium or electron paramagnetic resonance (EPR) with a superoxide-specific spin trap [20] [19].
- Hydrogen Peroxide (Hâ‚‚Oâ‚‚) Generation:
- Reagents: Glucose oxidase (for in vitro systems); Genetically encoded d-amino acid oxidase (DAAO) for intracellular use [20].
- Methodology: For DAAO, stably express the enzyme in cells, potentially targeting it to specific organelles. The flux of Hâ‚‚Oâ‚‚ generation is precisely controlled by titrating the concentration of the substrate, d-alanine. This method avoids the metabolic perturbations caused by bolus additions of Hâ‚‚Oâ‚‚ [20] [25].
Protocol 2: Investigating NADPH Oxidase (NOX) Involvement
NOX enzymes are major physiological sources of ROS for signaling and pathology.
- Inhibition Protocols:
- Avoid Non-specific Inhibitors: Do not use apocynin or diphenyleneiodonium (DPI) as the sole evidence for NOX involvement, as they have numerous off-target effects [20] [24].
- Use Specific Inhibitors: Employ newer, more specific NOX inhibitors (e.g., GKT136901, GKT831) according to the manufacturer's protocols [20].
- Genetic Knockdown/Knockout:
- Methodology: Use siRNA, shRNA, or CRISPR/Cas9 to knock down or knock out specific NOX isoform genes (e.g., NOX2, NOX4). This provides the most compelling evidence for their involvement. Always confirm knockdown/knockout at the protein level and measure the consequent loss of ROS production with a specific assay [20] [24].
The following diagram illustrates the decision-making workflow for implicating a specific ROS in a biological process, from hypothesis to confirmation.
The Scientist's Toolkit: Key Research Reagents
Table 2: Essential Reagents for ROS and Redox Biology Research
| Reagent / Tool | Function and Target | Key Considerations and Caveats |
|---|---|---|
| d-Amino Acid Oxidase (DAAO) | Genetically encoded system for controlled, titratable generation of Hâ‚‚Oâ‚‚ within cells [20] [25]. | Allows precise spatial and temporal control of Hâ‚‚Oâ‚‚ production without metabolic disruption. Superior to bolus Hâ‚‚Oâ‚‚ addition. |
| MitoPQ | Mitochondria-targeted compound that generates superoxide (O₂•â») specifically within the mitochondrial matrix [20] [19]. | Provides organelle-specific ROS generation. Confirm mitochondrial localization and superoxide production. |
| Paraquat (PQ) | Redox-cycling compound that generates superoxide primarily in the cytosol [20]. | A classic tool; can induce complex metabolic adaptations beyond ROS production. |
| TEMPOL / Mito-TEMPO | Cell-permeable and mitochondria-targeted nitroxides that can catalytically scavenge superoxide [20]. | Better described as "redox modulators" than simple antioxidants due to complex redox cycling. |
| Specific NOX Inhibitors (e.g., GKT-series) | Pharmacological inhibitors designed to target specific NADPH oxidase isoforms (e.g., NOX1/4) [20] [24]. | Prefer over non-specific inhibitors like apocynin and DPI. Check isoform selectivity for your model. |
| N-Acetylcysteine (NAC) | Precursor for glutathione synthesis; can reduce disulfide bonds [20]. | A weak, non-specific ROS scavenger. Effects are often due to thiol supplementation or other signaling, not direct antioxidant action. Interpret results with caution. |
| Viburnitol | (-)-vibo-Quercitol | High-purity (-)-vibo-Quercitol for research. A key chiral building block for synthesizing pharmaceuticals and glycosidase inhibitors. For Research Use Only. Not for human consumption. |
| 6-Methoxyflavonol | 3-Hydroxy-6-methoxyflavone|High-Purity Research Compound | 3-Hydroxy-6-methoxyflavone is For Research Use Only (RUO). It is a flavonoid studied for its synergistic antimicrobial effects against resistant pathogens and GABA receptor modulation. Not for human or veterinary diagnostic/therapeutic use. |
Selecting and Implementing Robust Redox Assessment Techniques
Within the realm of cellular biology, reactive oxygen species (ROS) such as superoxide (O₂•â») and hydrogen peroxide (Hâ‚‚Oâ‚‚) play a dual role. At physiological levels, they are crucial signaling molecules that regulate processes including cell proliferation and immune response; however, at excessive concentrations, they cause oxidative damage to biomolecules, contributing to disease pathogenesis [27] [1]. Accurate measurement of these species is therefore fundamental to advancing our understanding of health and disease. Electron Spin Resonance (ESR) and fluorescent probe-based methods are two primary techniques for the direct detection of ROS. This guide is designed to help researchers navigate the practical challenges of these methods, with a constant focus on minimizing oxidative artifacts and ensuring data fidelity in redox measurements.
Troubleshooting Guide: ESR & Fluorescent Probes
Frequently Asked Questions (FAQs)
Q1: Our ESR signals using DMPO spin traps are weak and fade quickly. What could be the issue?
- Potential Cause: The DMPO/•OOH adduct has a short half-life (approximately 45 seconds) and can undergo reductive degradation in the cellular environment, leading to signal loss [28].
- Solutions:
- Use more stable probes: Switch to a spin trap like DEPMPO, which forms a more stable adduct with O₂•⻠(half-life of ~15 minutes) [28].
- Validate with controls: Always include a control experiment with a superoxide dismutase (SOD) mimic. A reduction in signal confirms the detection of O₂•⻠and helps distinguish it from other radicals [28].
- Consider hydroxylamines: Use cyclic hydroxylamine probes like CMH or CPH. They react with O₂•⻠at a faster rate and form a stable radical product with a significantly longer half-life [28].
Q2: Our fluorescent probe data suggests high Hâ‚‚Oâ‚‚ levels, but a genetic ROS sensor contradicts this. Which result is reliable?
- Potential Cause: A lack of probe specificity. Many widely used "Hâ‚‚Oâ‚‚-specific" fluorescent probes, such as those based on boronate esters, cross-react with other ROS/RNS, particularly peroxynitrite (ONOOâ»), at a much faster rate [27] [1]. The genetic sensor (e.g., roGFP-Orp1) is typically more specific.
- Solutions:
- Do not rely on a single probe: Corroborate findings with multiple methods.
- Understand probe chemistry: Actively consult the literature to understand the known limitations and cross-reactivities of your chosen fluorescent probe [27].
- Use pharmacological modulators: Employ controlled generation of Hâ‚‚Oâ‚‚ (e.g., with d-amino acid oxidase) and specific inhibitors (e.g., catalase) to validate the source and identity of the ROS [1].
Q3: We are unable to detect any ROS in our cell culture model using ESR, despite functional evidence of oxidative stress. What are we missing?
- Potential Cause 1: Sensitivity limitations. The concentration of ROS might be below the detection limit of your ESR setup, especially for short-lived species.
- Solutions:
- Optimize instrumentation: Ensure your resonator is tuned for small biological samples. Using a higher microwave frequency can improve sensitivity [29].
- Use highly specific and sensitive probes: As in Q1, consider switching to cyclic hydroxylamine probes like CMH, which offer improved sensitivity and stability for biological systems [28].
- Potential Cause 2: Improper probe permeability or distribution. The spin probe may not be effectively reaching the intracellular site of ROS production.
- Solution: Select a spin probe with confirmed membrane permeability and appropriate lipophilicity, such as MC-PROXYL, which effectively crosses the blood-brain barrier and can serve as a model for cellular uptake [30].
Q4: How can we be sure that our "antioxidant" treatment is working through a direct scavenging mechanism?
- Potential Cause: Many compounds used as "antioxidants" (e.g., N-acetylcysteine, TEMPOL) have multiple, off-target effects that are unrelated to ROS scavenging [1].
- Solutions:
- Confirm a decrease in oxidative damage: Do not infer antioxidant activity from biological effect alone. Directly measure a decrease in a specific biomarker of oxidative damage (e.g., protein carbonylation, lipid peroxidation) following treatment [1].
- Check chemical plausibility: Evaluate if the rate constant, concentration, and subcellular localization of the antioxidant render a scavenging effect chemically plausible. Most low-mass antioxidants are unlikely to effectively scavenge Hâ‚‚Oâ‚‚ in vivo [1].
Troubleshooting Tables
Table 1: Common ESR Spin Probes and Their Characteristics
| Probe Name | Target ROS | Key Advantages | Key Limitations & Troubleshooting |
|---|---|---|---|
| DMPO | O₂•â», •OH | Widely available and characterized [28] | - Short adduct half-life (~45 sec for •OOH) [28]. - DMPO/•OOH can degrade to DMPO/•OH, causing misinterpretation [28]. |
| DEPMPO | O₂•⻠| Forms a more stable adduct (tâ‚/â‚‚ ~15 min) [28] | Still susceptible to reductive degradation; requires SOD controls [28]. |
| CPH/CMH | O₂•⻠| Fast reaction rate; forms very stable radical product (tâ‚/â‚‚ >5 hours) [28] | Can be oxidized by other ROS; requires specific scavenger controls [28]. |
Table 2: Limitations of Common Fluorescent Probes and Validation Strategies
| Probe / Class | Intended Target | Major Specificity Challenges | Essential Validation Experiments |
|---|---|---|---|
| Dichlorodihydro-fluorescein (DCFH) | "General ROS" | Oxidized by multiple ROS and redox-active species; reflects general cellular redox state, not a specific molecule [27]. | Avoid for definitive studies of specific ROS. Use only as a general indicator alongside more specific methods. |
| Boronate-based probes | Hâ‚‚Oâ‚‚ | Reacts much more rapidly with peroxynitrite (ONOOâ») [27] [1]. | Use controlled Hâ‚‚Oâ‚‚ generation systems (e.g., d-amino acid oxidase) and catalase to confirm signal origin [1]. |
| "Antioxidants" (e.g., NAC) | Scavenging | NAC has poor reactivity with Hâ‚‚Oâ‚‚; its effects are often from altering glutathione levels or other mechanisms [1]. | Measure oxidative damage biomarkers directly. Use genetic tools (e.g., KO, knockdown) for more specific validation. |
Experimental Protocols for Robust Redox Measurement
Protocol: Detecting Superoxide with ESR Spin Trapping
This protocol outlines the steps for using the CPH probe to reliably detect extracellular O₂•â».
1. Principle: The membrane-impermeable hydroxylamine probe CPH reacts with O₂•⻠to form the stable, EPR-detectable nitroxide radical CP•. The rate of CP• formation is proportional to the rate of O₂•⻠production [28].
2. Reagents and Materials:
- CPH (1-hydroxy-3-carboxy-2,2,5,5-tetramethylpyrrolidine hydrochloride)
- Appropriate cell culture medium or buffer (e.g., Krebs-HEPES)
- Metal chelators (e.g., DTPA) to suppress Fenton chemistry
- Superoxide dismutase (SOD)
- ESR spectrometer and a flat cell aqueous sample resonator
3. Step-by-Step Methodology: a. Preparation: Dissolve CPH in deaerated buffer to a final stock concentration of 10-100 mM. Keep on ice and protected from light. b. Sample Incubation: Mix your cell suspension or tissue homogenate with the CPH probe (final concentration 0.5-1 mM) in the presence of metal chelators. c. Controls: For every experiment, run a parallel sample containing SOD (50-100 U/mL) to confirm the signal is derived from O₂•â». d. Measurement: Transfer the mixture to a flat cell and record the ESR spectrum at room temperature. Typical settings: modulation frequency 100 kHz, modulation amplitude 1-2 G, microwave power 10-20 mW. e. Quantification: Measure the peak-to-peak amplitude of the low-field component of the CP• spectrum. Compare the initial rates of CP• formation in experimental vs. control samples.
4. Critical Notes for Minimizing Oxidative Artifacts:
- Auto-oxidation: Always include a "cell-free" control with the CPH probe to account for any signal from auto-oxidation.
- Specificity: While CPH is relatively specific, the addition of SOD is the most critical control to attribute the signal to O₂•â».
Protocol: Validating Hâ‚‚Oâ‚‚ Detection with Genetically Encoded Sensors
This protocol describes how to use the hyper-sensor HyPer to validate measurements from small-molecule fluorescent probes.
1. Principle: The HyPer protein is a genetically encoded, rationetric fluorescent sensor whose emission spectrum shifts upon specific reaction with Hâ‚‚Oâ‚‚, allowing for quantitative, specific measurement of Hâ‚‚Oâ‚‚ dynamics in live cells [1].
2. Reagents and Materials:
- Plasmid DNA encoding HyPer (targeted to desired cellular compartment)
- Cell transfection reagents
- Fluorescence microscope or plate reader capable of rationetric measurements (excitation 420/500 nm, emission 516 nm)
- d-Alanine and d-Amino Acid Oxidase (DAAO) for controlled Hâ‚‚Oâ‚‚ generation [1]
3. Step-by-Step Methodology: a. Cell Preparation: Transfect cells with the HyPer plasmid and culture for 24-48 hours to allow for expression. b. Baseline Measurement: Acquire rationetric images (F500/F420) of your cells to establish a baseline Hâ‚‚Oâ‚‚ level. c. Experimental Stimulus: Apply the stimulus you are studying (e.g., a growth factor). d. Validation with Controlled Generation: In a separate set of experiments, transfert cells with a DAAO construct. After baseline measurement, add d-alanine to the medium to induce controlled, intracellular Hâ‚‚Oâ‚‚ production. This creates a positive control for the sensor's response [1]. e. Data Analysis: Calculate the ratio (F500/F420) for each cell over time. The ratio is directly proportional to Hâ‚‚Oâ‚‚ concentration.
4. Critical Notes for Minimizing Oxidative Artifacts:
- Sensor Saturation: Be aware of the dynamic range of HyPer to avoid saturation, which leads to underestimation of Hâ‚‚Oâ‚‚ levels.
- pH Confounders: Since HyPer is pH-sensitive, run parallel controls with a pH-only sensor (e.g., SypHer) if your experimental condition could alter intracellular pH.
The following workflow diagram illustrates the decision process for selecting and validating a direct measurement method, incorporating the key troubleshooting points from this guide.
The Scientist's Toolkit: Essential Research Reagents
Table 3: Key Reagents for Redox Signaling and Oxidative Stress Research
| Reagent / Tool | Function / Target | Critical Considerations for Use |
|---|---|---|
| DMPO / DEPMPO | ESR spin traps for O₂•⻠and •OH [28] | DEPMPO offers superior adduct stability. Always use SOD controls to confirm O₂•⻠detection [28]. |
| CPH / CMH | Hydroxylamine-based ESR probes for O₂•⻠[28] | Offer faster kinetics and greater stability than nitrone traps. Check for interference from other oxidants [28]. |
| Boronate-based probes | Small-molecule fluorescent probes for Hâ‚‚Oâ‚‚ [27] | Major limitation: High reactivity with peroxynitrite. Use for screening, not definitive identification [27] [1]. |
| Genetically encoded sensors (e.g., HyPer, roGFP) | Specific, rationetric detection of Hâ‚‚Oâ‚‚ or redox potential in live cells [1] | High specificity but requires genetic manipulation. Ideal for validating chemical probes and spatial imaging [1]. |
| d-Amino Acid Oxidase (DAAO) | Enzyme system for controlled, intracellular generation of Hâ‚‚Oâ‚‚ [1] | Crucial tool for validating Hâ‚‚Oâ‚‚ probes and signaling pathways by providing a known, tunable stimulus [1]. |
| Superoxide Dismutase (SOD) | Enzyme that catalyzes O₂•⻠dismutation [1] | An essential control for any O₂•⻠detection experiment. A reduction in signal with SOD confirms specificity [1]. |
| Catalase | Enzyme that decomposes Hâ‚‚Oâ‚‚ [1] | An essential control for Hâ‚‚Oâ‚‚ detection. Confirms the identity of the oxidant being measured. |
| Angelic acid | Angelic acid, CAS:565-63-9, MF:C5H8O2, MW:100.12 g/mol | Chemical Reagent |
| Ac-Ala-OH | N-Acetyl-L-alanine|Research Chemical|RUO |
Troubleshooting Guides and FAQs
Lipid Peroxidation (MDA & 4-HNE)
Q1: My TBARS assay shows high background absorbance. What is the cause and how can I fix it? A: High background is often due to interfering substances or reagent degradation.
- Causes: Contaminated or old Thiobarbituric Acid (TBA), heme groups in samples, or sucrose in buffers.
- Solutions:
- Use HPLC or LC-MS/MS for higher specificity instead of the spectrophotometric TBARS assay.
- Purify the TBA reagent by recrystallization before use.
- Include a sample blank without TBA to subtract non-specific absorbance.
- Use a solid-phase extraction (SPE) step to purify the MDA-TBA adduct before measurement.
Q2: My 4-HNE ELISA results are inconsistent. How can I improve reliability? A: Inconsistency stems from 4-HNE's reactivity and instability.
- Causes: 4-HNE-protein adduct instability, antibody cross-reactivity, or sample degradation.
- Solutions:
- Derivatize samples immediately with dinitrophenylhydrazine (DNPH) to stabilize 4-HNE adducts.
- Include a reducing agent like BHT (butylated hydroxytoluene) in buffers to prevent further peroxidation.
- Validate the antibody for specificity against other aldehydes (e.g., MDA, acrolein).
- Standardize the protein concentration across all samples.
Protein Carbonyls
Q3: The DNPH-based protein carbonyl assay has low sensitivity. How can I enhance it? A: Low sensitivity is typically an issue of detection method or derivatization efficiency.
- Causes: Insufficient derivatization time, low protein concentration, or inadequate detection.
- Solutions:
- Ensure a 10-15 minute incubation with DNPH in the dark.
- Concentrate protein samples to ≥ 5 mg/mL before the assay.
- Switch from spectrophotometric to immunoblot detection (using anti-DNP antibodies) for visualizing specific protein targets.
- Confirm the DNPH reagent is fresh and prepared in a strong acid (e.g., 2M HCl).
8-Hydroxy-2'-Deoxyguanosine (8-OHdG)
Q4: My 8-OHdG measurements are artificially high. How do I prevent this? A: Artifactual oxidation during DNA isolation and processing is the primary culprit.
- Causes: Phenol-based DNA extraction, exposure to ambient oxygen, or metal contamination.
- Solutions:
- Use chelating agents (e.g., deferoxamine) in all buffers to chelate redox-active metals.
- Implement a chaotropic NaI-based DNA extraction method, which minimizes artifactual oxidation.
- Perform all steps under an inert atmosphere (e.g., nitrogen) when possible.
- Include an enzymatic digestion step (nuclease P1 and alkaline phosphatase) to ensure complete DNA hydrolysis to nucleosides for accurate LC-MS/MS analysis.
General Oxidative Damage Analysis
Q5: How can I ensure my sample preparation minimizes ex vivo oxidation? A: A rigorous, protective protocol is essential.
- General Protocol:
- Lysis: Use ice-cold lysis buffers containing metal chelators (e.g., 0.1 mM EDTA, 0.1 mM deferoxamine) and antioxidants (e.g., 1 mM BHT for lipids, 10 mM N-ethylmaleimide for thiols).
- Processing: Keep samples on ice at all times. Centrifuge at 4°C.
- Storage: Aliquot and snap-freeze samples in liquid nitrogen. Store at -80°C. Avoid repeated freeze-thaw cycles.
- Analysis: Process samples quickly and under controlled conditions.
Data Presentation
Table 1: Comparison of Key Indirect Oxidative Damage Markers
| Marker | Analytical Methods | Sample Type | Advantages | Limitations |
|---|---|---|---|---|
| MDA | TBARS, HPLC, LC-MS/MS | Plasma, serum, tissue homogenate | Low-cost, well-established (TBARS) | Low specificity (TBARS), reactive and volatile |
| 4-HNE | ELISA, GC/MS, LC-MS/MS | Tissue, cells, plasma | Highly reactive & biologically active | Forms adducts, unstable, requires derivatization |
| Protein Carbonyls | Spectrophotometry, Western Blot, ELISA | Plasma, tissue homogenate, cells | Broad indicator of protein damage | Can be influenced by glycation and nitration |
| 8-OHdG | ELISA, HPLC-ECD, LC-MS/MS | Urine, DNA isolates, tissue | Specific DNA damage marker, non-invasive (urine) | Prone to artifactual oxidation during DNA extraction |
Experimental Protocols
Protocol 1: Protein Carbonyl Content Assay (Spectrophotometric DNPH Method)
- Principle: DNPH reacts with protein carbonyl groups to form hydrazones, which are measured spectrophotometrically.
- Procedure:
- Split 100-200 µg of protein sample into two tubes.
- To one tube, add 2M HCl (sample blank). To the other, add an equal volume of 0.2% (w/v) DNPH in 2M HCl.
- Incubate in the dark for 15 minutes with vortexing every 5 minutes.
- Precipitate proteins by adding 20% (w/v) trichloroacetic acid (TCA). Centrifuge.
- Wash the pellet 3x with an Ethanol:Ethyl Acetate (1:1) mixture to remove free DNPH.
- Dissolve the final pellet in 6M Guanidine HCl.
- Measure absorbance at 370 nm. Calculate carbonyl content using the molar absorptivity of 22,000 Mâ»Â¹cmâ»Â¹.
Protocol 2: DNA Extraction for 8-OHdG Analysis (Artifact-Minimizing Method)
- Principle: Isolate DNA under conditions that suppress Fenton chemistry.
- Procedure:
- Homogenize tissue in a buffer containing 10 mM deferoxamine and 100 µM BHT.
- Add NaI (final concentration 1M) and 1-butanol to the homogenate to dissociate nucleoproteins.
- Precipitate DNA by adding 2-propanol. Wash the DNA pellet with a solution of 40% 2-propanol, 0.1M NaI, and 10 mM deferoxamine.
- Re-dissolve DNA in a chelator-containing buffer (e.g., 10 mM Tris-HCl, 1 mM deferoxamine, pH 8.0).
- Digest DNA to nucleosides using nuclease P1 and alkaline phosphatase.
- Analyze 8-OHdG content via LC-MS/MS or HPLC-ECD.
Visualizations
Diagram 1: Oxidative Damage Pathway & Markers
Diagram 2: 8-OHdG Analysis Workflow
The Scientist's Toolkit
Table 2: Essential Research Reagent Solutions
| Reagent | Function | Key Consideration |
|---|---|---|
| Butylated Hydroxytoluene (BHT) | Lipid-soluble antioxidant; halts ongoing lipid peroxidation. | Add to lysis buffers (50-100 µM) for lipid-related assays. |
| Deferoxamine Mesylate | Iron chelator; prevents Fenton reaction and artifactual oxidation. | Crucial for DNA isolation for 8-OHdG (0.1-1 mM). |
| Dinitrophenylhydrazine (DNPH) | Derivatizing agent; reacts with protein carbonyls to form detectable hydrazones. | Prepare fresh in 2M HCl and protect from light. |
| N-Ethylmaleimide (NEM) | Thiol-blocking agent; prevents disulfide bond rearrangement. | Use in protein carbonyl assays to stabilize oxidation state. |
| Thiobarbituric Acid (TBA) | Reacts with MDA to form a pink chromogen (TBA-MDA adduct). | Prone to interference; recrystallize for purity or use HPLC-grade. |
| Bis-PEG7-PFP ester | Bis-PEG7-PFP ester, CAS:1334170-01-2, MF:C30H32F10O11, MW:758.6 g/mol | Chemical Reagent |
| Cyclo(Pro-Val) | Cyclo(Pro-Val), CAS:5654-87-5, MF:C10H16N2O2, MW:196.25 g/mol | Chemical Reagent |
Key Enzymatic Assays: Methodologies and Protocols
This section provides detailed experimental protocols for assessing the activity of core enzymatic antioxidants.
Spectrophotometric Assay for Catalase (CAT) Activity
The following protocol quantifies catalase activity based on its ability to decompose hydrogen peroxide (Hâ‚‚Oâ‚‚) [31].
- Principle: Catalase activity is determined by measuring the rate of disappearance of its substrate, Hâ‚‚Oâ‚‚, which is observed as a decrease in absorbance at 240 nm.
- Reagents:
- Potassium phosphate buffer (50 mM, pH 7.0)
- Hydrogen peroxide (Hâ‚‚Oâ‚‚) solution, 7.5 mM in buffer
- Plasma or tissue homogenate sample
- Procedure:
- Pipette 2.275 mL of potassium phosphate buffer (50 mM, pH 7.0) into a quartz cuvette.
- Add 0.025 mL of plasma sample to the cuvette.
- Set the spectrophotometer temperature to 25°C and zero it using a blank with buffer only.
- Initiate the reaction by rapidly adding 0.655 mL of 7.5 mM Hâ‚‚Oâ‚‚ solution for a final concentration of 7.5 mM.
- Immediately record the decrease in absorbance at 240 nm for 1-2 minutes.
- Calculation: One unit of catalase activity is typically defined as the amount of enzyme that decomposes 1 μmol of Hâ‚‚Oâ‚‚ per minute per mg of protein. Use the molar extinction coefficient of Hâ‚‚Oâ‚‚ (ε = 43.6 Mâ»Â¹ cmâ»Â¹) to calculate the activity based on the rate of absorbance change.
Superoxide Dismutase (SOD) Activity Assessment
SOD activity is commonly measured by its ability to inhibit the reduction of a detector compound by superoxide anion radicals generated in a system [2].
- Principle: A common assay uses xanthine and xanthine oxidase to generate superoxide radicals, which reduce a tetrazolium salt (e.g., cytochrome c or WST-1) to a colored formazan. SOD inhibits this reduction by scavenging the superoxide radicals. The degree of inhibition is proportional to SOD activity.
- Reagents:
- Assay buffer (e.g., 50 mM phosphate buffer, pH 7.4, containing EDTA)
- Xanthine solution
- Xanthine oxidase solution
- Tetrazolium salt solution (e.g., WST-1)
- Sample (plasma, erythrocyte lysate, or tissue homogenate)
- Procedure:
- Prepare a reaction mixture containing assay buffer, xanthine, and the tetrazolium salt.
- Add the sample to the test reaction. Prepare a control reaction without the sample.
- Start the reaction by adding xanthine oxidase to all tubes.
- Incubate the reaction mixture at 25°C for 20 minutes.
- Stop the reaction as per kit instructions (e.g., with a specific inhibitor).
- Measure the absorbance of the formazan dye at its specific wavelength (e.g., 450 nm for WST-1).
- Calculation: One unit of SOD activity is typically defined as the amount of enzyme that causes 50% inhibition of the reduction reaction under specified conditions. Activity is expressed as units per mg protein or per mL plasma.
Glutathione Peroxidase (GPx) Activity Assay
GPx activity is measured by coupling its action to the oxidation of glutathione (GSH), which is then recycled by glutathione reductase (GR) using NADPH [32].
- Principle: GPx reduces hydroperoxides (e.g., Hâ‚‚Oâ‚‚ or cumene hydroperoxide) while oxidizing GSH to GSSG. Glutathione reductase then recycles GSSG back to GSH using NADPH as a reducing agent. The consumption of NADPH, measured by a decrease in absorbance at 340 nm, is proportional to GPx activity.
- Reagents:
- Potassium phosphate buffer (pH 7.0) with EDTA
- Glutathione (GSH)
- Glutathione Reductase (GR)
- NADPH
- Sodium Azide (to inhibit catalase)
- Cumene hydroperoxide or Hâ‚‚Oâ‚‚
- Procedure:
- To a cuvette, add buffer, GSH, GR, NADPH, sodium azide, and sample.
- Pre-incubate the mixture at 25°C for a few minutes.
- Initiate the reaction by adding the hydroperoxide substrate.
- Record the decrease in absorbance at 340 nm for several minutes.
- Calculation: GPx activity is calculated based on the molar extinction coefficient of NADPH (ε = 6.22 mMâ»Â¹ cmâ»Â¹). One unit of GPx is often defined as the amount of enzyme that oxidizes 1 μmol of NADPH per minute per mg of protein.
Troubleshooting Guides and FAQs
This section addresses common challenges researchers face when measuring antioxidant parameters.
FAQ 1: Why are my measured antioxidant enzyme activities inconsistent or irreproducible?
- Potential Cause: Improper sample handling and preparation.
- Solution:
- Stability: Process samples quickly on ice. For plasma, centrifuge blood samples promptly and aliquot the plasma to avoid repeated freeze-thaw cycles. Enzyme activities in plasma can be stable for up to two months at -20°C, but long-term storage should be at -80°C [31].
- Hemolysis: Avoid hemolysis during blood collection and processing, as red blood cells are rich in antioxidants and can contaminate plasma readings.
- Homogenization: For tissues, ensure consistent and thorough homogenization in an appropriate cold buffer to liberate enzymes without denaturing them.
FAQ 2: My Total Antioxidant Capacity (TAC) values do not align with the individual enzyme activities. What could be the reason?
- Potential Cause: TAC and enzyme activities measure different aspects of the antioxidant defense system.
- Solution: Understand the scope of each assay. TAC measures the cumulative, non-enzymatic antioxidant capacity from all small molecules (e.g., vitamins, glutathione, uric acid, polyphenols) in a sample, often using assays like ABTS, DPPH, FRAP, or ORAC [33]. It generally does not reflect the activity of enzymatic antioxidants like SOD, CAT, and GPx. A comprehensive assessment requires measuring both TAC and specific enzyme activities to get a complete picture of the antioxidant barrier [2].
FAQ 3: My negative control shows significant signal in the TAC assay. How can I resolve this?
- Potential Cause: Interference from the sample matrix (e.g., buffers, solvents, or sample color).
- Solution:
- Blank Correction: Always run a sample blank containing the sample and all reagents except the probe radical (e.g., ABTS•+) or the oxidant. Subtract this blank value from your test readings.
- Sample Dilution: If the blank signal is high, try diluting the sample and re-running the assay. Ensure the solvent used for dilution is compatible with the assay (e.g., aqueous for ABTS, alcoholic for DPPH).
- Purification: For complex samples like plant extracts, consider purifying the sample via solid-phase extraction to remove interfering compounds.
FAQ 4: What is the best way to select a TAC assay for my research?
- Potential Cause: No single TAC assay can capture all antioxidant mechanisms due to differences in reaction principles, radicals used, and solvent systems [33].
- Solution: Select an assay based on your research question.
- For a broad screen of radical-scavenging capacity in a physiological context, the ABTS assay (operational at various pH levels and in both aqueous and organic solvents) is a good choice [33].
- To assess the ability to quench biologically relevant peroxyl radicals, the ORAC assay is more appropriate, though more complex [33].
- For measuring reducing power, the FRAP or CUPRAC assays are suitable. The CUPRAC assay is advantageous as it works at a near-physiological pH of 7 [33].
- It is highly recommended to use more than one TAC method to compare results and draw robust conclusions [2].
Research Reagent Solutions
The table below lists key reagents and their critical functions in antioxidant defense assays.
Table 1: Essential Reagents for Antioxidant Defense Assessment
| Reagent/Kit | Primary Function in Assays |
|---|---|
| ABTS (2,2'-Azinobis(3-ethylbenzothiazoline-6-sulfonic acid)) | Used to generate the stable ABTS•+ radical cation to measure TAC via a decolorization assay [33]. |
| DPPH (2,2-Diphenyl-1-picrylhydrazyl) | A stable free radical used to evaluate free radical scavenging activity in organic solvents [34] [33]. |
| Trolox (6-hydroxy-2,5,7,8-tetramethylchroman-2-carboxylic acid) | A water-soluble vitamin E analog used as a standard to quantify TAC results, expressed as Trolox Equivalents (TE) [33]. |
| NADPH (Nicotinamide Adenine Dinucleotide Phosphate) | A cofactor used as an electron donor in the glutathione peroxidase (GPx) recycling assay [32]. |
| Glutathione (Reduced, GSH) | The substrate for Glutathione Peroxidase (GPx); it is oxidized during the reduction of hydroperoxides [32]. |
| Xanthine/Xanthine Oxidase | A common enzyme-based system used to generate superoxide radicals (O₂•â») for SOD activity assays [2]. |
Visualizing the Antioxidant Defense Workflow and Signaling
The following diagrams illustrate the core biochemical relationships and experimental strategy for assessing antioxidant defense.
Diagram 1: Core Antioxidant Enzyme Functions. This diagram shows the sequential detoxification of reactive oxygen species (ROS) by key enzymes. SOD converts superoxide to hydrogen peroxide, which is then neutralized to water and oxygen by CAT or GPx. The Fenton reaction shows the potential for harmful hydroxyl radical formation if Hâ‚‚Oâ‚‚ is not cleared.
Diagram 2: Experimental Strategy for Antioxidant Assessment. This workflow outlines the parallel paths for evaluating the antioxidant defense system, emphasizing the need to measure both specific enzymatic activities and the overall TAC for a comprehensive analysis.
This technical support center provides targeted guidance for researchers using Oxidation-Reduction Potential (ORP) measurements in studies aimed at minimizing oxidative damage. Achieving a accurate "composite redox snapshot" is critical for understanding redox biology, signaling pathways, and the efficacy of therapeutic interventions. The following guides and FAQs address common experimental pitfalls to ensure the reliability of your ORP data within integrated measurement platforms.
Core Concepts: ORP in Redox Research
What ORP Measures: ORP (Oxidation-Reduction Potential) is a millivolt (mV) measurement that quantifies the tendency of a solution to either gain or lose electrons. It provides a composite, net value of the overall balance between oxidizing and reducing species in a system. [35] [36] In the context of oxidative stress research, it serves as a valuable, indirect indicator of the collective redox environment.
The Link to Oxidative Damage: Oxidative stress occurs from an imbalance between the production of Reactive Oxygen Species (ROS)—such as superoxide anion (O₂•â»), hydrogen peroxide (Hâ‚‚Oâ‚‚), and hydroxyl radicals (•OH)—and the biological system's ability to detoxify them. [37] [38] While ORP does not identify specific ROS, a significant shift in ORP values reflects a change in the redox equilibrium that can predispose cellular structures like proteins, lipids, and DNA to oxidative damage. [37] [1]
Frequently Asked Questions (FAQs)
1. How can I be sure my ORP readings are accurate for my specific biological medium?
Accuracy begins with sensor selection. The chemical composition of your sample must be compatible with your sensor's materials to prevent corrosion and measurement drift. [39]
- Best Practice: Match the sensor body and reference junction to your media. For example, use general-purpose sensors with platinum bands for standard solutions and gold sensors for strong alkaline environments. [39] Always consult manufacturer compatibility charts.
2. My ORP values are drifting. What is the most likely cause?
The most common causes of drift are improper calibration, electrode fouling, and inadequate maintenance. [40] [35]
- Solution: Establish a strict calibration and maintenance protocol. Calibrate using fresh commercial ORP standards at least monthly, or more frequently for intensive use. [40] Clean the electrode with a suitable solution before calibration and after use in dirty or biologically active samples to prevent fouling. [40] [35]
3. Can I use ORP to infer the concentration of a specific ROS, like Hâ‚‚Oâ‚‚?
No, ORP should not be used to infer concentrations of specific ROS. ORP provides a composite snapshot of all redox-active couples in the solution. [1] [36] A change in ORP indicates a shift in the overall redox environment but cannot distinguish the contribution of individual species like Hâ‚‚Oâ‚‚ from superoxide or other oxidants. [1] For specific ROS measurement, employ targeted techniques and probes as outlined in specialized guidelines. [1]
4. How does ORP relate to controlling oxidative damage in my experiments?
By monitoring ORP, you can maintain the redox environment within a desired range, thereby minimizing uncontrolled oxidative stress. For instance, in a bioreactor, ensuring ORP stays within a non-stressful window can help prevent the unwanted oxidative damage to cells or sensitive molecules. [36] ORP is thus a control parameter for stabilizing the system against redox fluctuations.
Troubleshooting Guides
Problem: Erratic or Non-Sensical ORP Readings
| Step | Action | Rationale & Additional Details |
|---|---|---|
| 1 | Perform a Primary Test | Place the sensor in a buffer solution of known pH and check the mV reading. Typical values are +270 to +280 mV for pH 7, +350 to +360 mV for pH 4, and +100 to +110 mV for pH 10. [41] This verifies basic functionality. |
| 2 | Inspect and Clean the Electrode | Visually inspect for physical damage, coating, or fouling. Clean the electrode with a soft cloth and a suitable cleaning solution (e.g., mild detergent or solvents compatible with the electrode material) to remove contaminants. [40] |
| 3 | Verify Calibration | Perform a two-point calibration using commercial ORP standards, especially if absolute accuracy is critical for your experiment. [41] |
| 4 | Check for Electrical Interference | Ensure the sensor cable is away from power cables and other sources of strong electromagnetic fields, which can introduce signal noise. |
Problem: Slow Sensor Response Time
| Possible Cause | Investigation & Solution |
|---|---|
| Electrode Fouling | A coated electrode membrane cannot react quickly with the solution. This is common in wastewater, biological broths, or protein-rich samples. [35] Solution: Implement a more aggressive and regular cleaning regimen appropriate for your contaminant. [40] |
| Aging or Degraded Electrode | Over time, the electrode's sensitivity declines. Solution: If cleaning and calibration do not restore performance, the electrode may need to be replaced. |
| Clogged Reference Junction | The porous junction that connects the reference electrolyte to the solution can become blocked. Solution: Follow manufacturer instructions for cleaning or rejuvenating the junction. |
Experimental Protocols for Reliable ORP Measurement
Protocol 1: Initial Sensor Setup and Calibration for High-Precision Research
Objective: To ensure the ORP sensor provides accurate and traceable data at the start of an experimental series.
Materials:
- ORP Meter/Sensor with platinum or gold electrode [35] [39]
- Two commercial ORP standard solutions (e.g., +200 mV and +465 mV)
- Clean beakers and rinse solution (deionized water)
- Data logging software or interface
Method:
- Hydration: If the sensor is new or has been dry-stored, hydrate the electrode by immersing it in the recommended storage solution (often pH 4 buffer with KCl) for the time specified by the manufacturer. [41]
- Rinsing: Rinse the electrode tip thoroughly with deionized water into a waste beaker.
- First Point Calibration: Immerse the sensor in the first ORP standard solution. Gently swirl the beaker to ensure a homogeneous solution around the electrode. In the instrument software, initiate a two-point calibration and enter the known mV value of the first standard. Confirm the reading is stable before accepting the point.
- Rinsing: Repeat the rinsing step to avoid cross-contamination of standards.
- Second Point Calibration: Immerse the sensor in the second ORP standard solution. Enter the known mV value and confirm once stable.
- Verification: Rinse the sensor and place it back into the first standard to verify the calibration. A drift of more than a few mV may indicate a need for sensor maintenance or replacement.
- Documentation: Record the calibration date, standards used, and final calibration values for quality control purposes.
Protocol 2: Integrating ORP Measurement with Targeted Redox Manipulation
Objective: To acquire a composite redox snapshot (ORP) while specifically modulating a particular ROS to study its biological impact.
Materials:
- Calibrated ORP sensor and meter.
- Cell culture or biological sample.
- Reagents for specific ROS generation or scavenging (e.g.,
d-amino acid oxidasefor Hâ‚‚Oâ‚‚,paraquatfor superoxide, orN-acetylcysteine (NAC)as a redox modulator). [1]
Diagram: Workflow for correlating specific redox manipulation with composite ORP measurement.
Method:
- Baseline Measurement: Place the ORP sensor in your biological sample (e.g., cell culture media) and allow the reading to stabilize. Record this as your baseline ORP.
- Controlled Intervention: Introduce a specific redox modulator.
- Monitor Composite Response: Continuously log the ORP value, observing the trajectory and magnitude of change in the composite redox snapshot following your intervention.
- Correlative Analysis: Terminate the experiment at key ORP milestones to assay specific endpoints of oxidative damage (e.g., lipid peroxidation, protein carbonylation, 8-OHdG for DNA damage). [37] [1] This links the composite ORP measurement to specific molecular consequences.
The Scientist's Toolkit: Key Reagent Solutions
The following table lists essential reagents used in advanced redox research to manipulate and measure the redox environment.
| Research Reagent | Primary Function in Redox Research | Key Considerations for Use |
|---|---|---|
| d-amino acid oxidase (DAAO) | Controlled Hâ‚‚Oâ‚‚ generation. When provided with its substrate (e.g., d-alanine), DAAO produces Hâ‚‚Oâ‚‚ at a tunable rate, ideal for mimicking physiological signaling or stress. [1] | Can be genetically targeted to specific cellular compartments. The flux is controlled by substrate concentration. [1] |
| Paraquat (PQ) | Superoxide (O₂•â») generation. Readily undergoes redox cycling in biological systems, primarily generating superoxide anions. [1] | Its use will also indirectly increase Hâ‚‚Oâ‚‚ via superoxide dismutation. It is a potent toxicant. [1] |
| N-acetylcysteine (NAC) | Redox modulator. Often used as an "antioxidant," its mechanisms are diverse: it can boost glutathione levels, cleave disulphides, and generate Hâ‚‚S. [1] | It has poor reactivity with Hâ‚‚Oâ‚‚. Biological effects are often misattributed to direct ROS scavenging; describe it as a "redox modulator" instead. [1] |
| ORP Standard Solutions | Sensor Calibration. Provides known redox potentials essential for calibrating ORP sensors to ensure quantitative accuracy. [40] [41] | Use fresh, properly stored solutions. A two-point calibration is required for high-accuracy experiments. [40] |
| N-Acetylornithine | N-Acetylornithine|6205-08-9|For Research | |
| Daphnecinnamte B | Caffeic Acid Undecyl Ester|Research Compound | Caffeic acid undecyl ester (CAUE) is a potent cytotoxic agent for cancer research. For Research Use Only. Not for human or veterinary diagnostic or therapeutic use. |
ORP Reference Ranges for Biological Processes
The table below summarizes typical ORP ranges for key processes in biological and environmental systems, providing context for interpreting your composite snapshot. [36]
| Process / Environment | Typical ORP Range | Redox Context & Significance |
|---|---|---|
| Nitrification | +100 to +350 mV | Oxidizing conditions favorable for ammonia-oxidizing bacteria. |
| Denitrification | +50 to -50 mV | Transitional, moderately reducing conditions. |
| Biological Phosphorus Release | -100 to -225 mV | Reducing, anaerobic conditions. |
| Methane Production | -175 to -400 mV | Strongly reducing, strictly anaerobic conditions. |
| cBOD Degradation (Aerobic) | +50 to +250 mV | Oxidizing conditions with available molecular oxygen. |
Optimizing Pre-Analytical Steps and Troubleshooting Common Workflow Errors
FAQs on Anticoagulant Selection and Redox Analysis
1. How does the choice between heparin and citrate directly impact the measurement of redox biomarkers? The choice of anticoagulant fundamentally influences the biochemical environment of your blood sample, potentially altering the activity of redox-sensitive enzymes and the stability of oxidative biomarkers. Citrate works by chelating calcium ions, which are also essential cofactors for some pro-oxidant enzymes and processes involved in coagulation [42] [43]. This chelation may inadvertently suppress certain calcium-dependent oxidative pathways. Heparin, an anion-binding polymer, acts by enhancing the activity of antithrombin III and does not chelate calcium [42]. The table below summarizes the general characteristics and redox-related considerations for each anticoagulant.
Table 1: Key Characteristics of Heparin and Citrate Anticoagulants
| Characteristic | Heparin | Sodium Citrate |
|---|---|---|
| Mechanism of Action | Activates antithrombin III [42] | Chelates calcium ions (Ca²âº) [42] [43] |
| Effect on Sample | Minimal dilution; preserves ionized calcium [42] | Dilutes sample; reduces ionized calcium [42] |
| Primary Clinical Use | Systemic anticoagulation [42] | Regional anticoagulation (e.g., in extracorporeal circuits) [42] [43] |
| Considerations for Redox Studies | Maintains native calcium levels, which may preserve certain oxidative processes. Associated with higher bleeding risk in clinical settings [42]. | Calcium chelation may suppress calcium-dependent oxidative reactions. Enables significant heparin dose reduction in clinical procedures [43]. |
2. My research focuses on oxidative stress in chronic inflammation. Are there any special handling considerations? Yes. Research indicates that oxidative stress (OS) and reductive stress (RS) are interconnected modulators of immune function [44]. When studying chronic inflammatory models, it is critical to process samples rapidly to preserve the in vivo redox state. Delays can lead to ex vivo oxidative changes, obscuring the true biological signal. For consistent results, standardize the time between sample collection and plasma separation, and consider flash-freezing samples in liquid nitrogen if they cannot be analyzed immediately [45]. The goal is to capture the delicate balance between pro-oxidant and antioxidant species, as a deviation toward either oxidation or reduction can contribute to inflammatory pathology [44].
3. I need to measure a panel of redox biomarkers. Which sample type is most suitable: plasma, whole blood, or RBC lysates? Whole blood (WB) is emerging as a highly sensitive sample for comprehensive redox profiling. A 2022 study demonstrated that a wide panel of antioxidant and oxidant status biomarkers could be accurately measured in canine WB and red blood cell (RBC) lysates [45]. The research found that WB was more sensitive in detecting in vitro changes induced by the addition of ascorbic acid and offered the advantage of easier sample preparation compared to preparing RBC lysates [45]. This suggests WB is a promising sample for evaluating overall redox status, with potential applications across species.
Table 2: Redox Biomarkers Measurable in Whole Blood and RBC Lysates
| Category | Biomarker | Full Name / Significance |
|---|---|---|
| Antioxidant Status | CUPRAC | Cupric Reducing Antioxidant Capacity |
| FRAP | Ferric Reducing Ability of Plasma | |
| TEAC | Trolox Equivalent Antioxidant Capacity | |
| Thiol | Measures sulfhydryl groups on proteins | |
| PON-1 | Paraoxonase type 1 [45] | |
| Oxidant Status | TOS | Total Oxidant Status |
| POX-Act | Peroxide Activity | |
| d-ROMs | Reactive Oxygen-Derived Compounds | |
| AOPP | Advanced Oxidation Protein Products | |
| TBARS | Thiobarbituric Acid Reactive Substances (measures lipid peroxidation) [45] |
Troubleshooting Guide
Problem: Inconsistent results in antioxidant capacity assays.
- Potential Cause: Variation in sample handling time or temperature.
- Solution: Implement a strict standard operating procedure (SOP) for sample processing. The 2022 redox methodology study highlights the importance of precise and accurate handling. For WB, freeze the entire blood aliquot at -80°C for at least two hours before analysis. For RBC lysates, ensure a strict protocol of four washes with isotonic saline after plasma separation, followed by hemolysis in a 1:4 dilution with ultrapure water before storage at -80°C [45].
Problem: Suspected ex vivo oxidation in plasma samples.
- Potential Cause: Slow centrifugation or prolonged exposure to room temperature after blood draw.
- Solution: Reduce the time between collection and plasma separation to an absolute minimum. Centrifuge samples at 4°C to slow metabolic activity. If analyzing lipid peroxidation (e.g., via TBARS), consider adding the antioxidant butylated hydroxytoluene (BHT) to your collection tubes to prevent artifactual oxidation during processing.
Problem: Clotting in samples collected with citrate.
- Potential Cause 1: Incorrect blood-to-anticoagulant ratio.
- Solution: Verify that the vacuum tube is filling to the correct volume. An under-filled tube will contain an excess of citrate, which can osmotically affect cells and skew your results.
- Potential Cause 2: Incomplete mixing after collection.
- Solution: Gently invert the collection tube 8-10 times immediately after drawing blood to ensure complete mixing with the anticoagulant.
Experimental Protocol: Validating Anticoagulant Effects on Redox Biomarkers
This protocol is adapted from methods used to validate redox biomarkers in whole blood and RBCs [45].
Objective: To assess the impact of heparin and citrate on the measurement of a selected redox biomarker panel.
Materials:
- Research reagent solutions are listed in the table below.
- Blood collection tubes (heparin and sodium citrate).
- Microplate reader (or other suitable spectrophotometer).
- Centrifuge.
- -80°C freezer.
Table 3: Research Reagent Solutions for Redox Biomarker Analysis
| Reagent / Material | Function / Application |
|---|---|
| CUPRAC Reagent | Measures total antioxidant capacity via reduction of Cu²⺠to Cu⺠[45]. |
| FRAP Reagent | Measures antioxidant capacity via reduction of Fe³âº-TPTZ to Fe²⺠[45]. |
| TBARS Reagent | Quantifies lipid peroxidation by reacting with malondialdehyde [45]. |
| DTNB (Ellman's Reagent) | Measures total thiol groups by reacting with sulfhydryl groups to form a yellow chromophore [45]. |
| Phosphate Buffered Saline (PBS) | Used for washing cells and as a dilution buffer. |
| Ultrapure Water | Used for preparing RBC lysates via osmotic shock [45]. |
Procedure:
- Sample Collection: Draw blood from consented donors or animal models, dividing it equally between heparin and citrate tubes.
- Sample Preparation: For each anticoagulant type, prepare two sets of samples:
- Whole Blood (WB): Aliquot whole blood directly into cryovials and store at -80°C.
- Red Blood Cell (RBC) Lysate: Centrifuge a portion of the blood at 3000 rpm for 10 minutes at 4°C. Discard the plasma and buffy coat. Wash the packed RBCs four times with isotonic saline. After the final wash, lyse the cells with ultrapure water (1:4 dilution) and store the lysate at -80°C [45].
- Biomarker Analysis: Perform your chosen redox assays (e.g., CUPRAC, FRAP, TBARS) on all sample types in duplicate. Follow previously validated methods for each assay [45].
- Data Analysis: Compare the mean values of each biomarker between heparin and citrate samples for both WB and RBC lysates using appropriate statistical tests (e.g., paired t-test). Report the intra- and inter-assay coefficients of variation (CV) to demonstrate precision.
Visual Workflow: Anticoagulant Evaluation in Redox Research
The diagram below outlines the logical workflow for designing an experiment to evaluate the impact of anticoagulants on redox biomarker measurements.
Troubleshooting Guide: Common Issues and Solutions
| Problem | Possible Cause | Recommended Solution |
|---|---|---|
| Decreased ORP signal after freeze-thaw [46] | Sample degradation or alteration of redox-active molecules. | Analyze samples immediately without freezing. Use heparin anticoagulant instead of citrate [46]. |
| Increased variability in metabolic profiling [47] | Compound degradation or precipitation from repeated freezing and thawing. | Limit freeze-thaw cycles. Analyze fresh samples when possible; if freezing is necessary, aliquot to avoid multiple cycles [47]. |
| Increase in oxidative stress biomarkers (e.g., 8-iso-PGF2α) [48] | Ex vivo oxidation induced by the freeze-thaw process. | Add antioxidants (e.g., 4-hydroxy-2,2,6,6-tetramethylpiperidin-1-oxyl) to sample before storage/freezing [48]. |
| Instability of specific chemistry analytes (e.g., LDH, uric acid) [49] | Analyte-specific sensitivity to pre-analytical handling. | Consult analyte-specific stability literature. Minimize storage time and freeze-thaw cycles for unstable analytes [49]. |
| Poor reproducibility in HR-MS data [47] | Combined effect of instrument variability and sample degradation. | Use internal standards. Perform instrument calibration. Limit sample storage time and freeze-thaw cycles [47]. |
Frequently Asked Questions (FAQs)
Q1: How do freeze-thaw cycles affect Oxidation-Reduction Potential (ORP) measurements? A: Freeze-thawing can lead to a statistically significant decrease in measured ORP values. One study observed decreases of approximately 10 mV for citrated plasma and 6 mV for heparinized plasma after a freeze-thaw cycle. The signal decrease is even more pronounced in samples with exogenously elevated ORP [46].
Q2: Which common clinical chemistry analytes are most stable and least stable after freeze-thaw cycles? A: According to stability studies, the following patterns are observed [49]:
- Generally Stable Analytes: AST, ALT, CK, GGT, Direct Bilirubin, Glucose, Creatinine, Cholesterol, Triglycerides, HDL.
- Less Stable Analytes: Lactate Dehydrogenase (LD), Uric Acid, Total Protein, Albumin, Total Bilirubin, Calcium, Blood Urea Nitrogen (BUN).
Q3: What is the impact of multiple freeze-thaw cycles on metabolic fingerprinting? A: Each freeze-thaw cycle can reduce analytical reproducibility. In one study on microalgal extracts using direct infusion HR-MS, reproducibility dropped from about 90% for fresh samples to about 80% after one cycle, and further to about 73% after a second cycle. This decrease is attributed to sample degradation rather than instrument variability [47].
Q4: How does long-term storage affect the stability of oxidative stress biomarkers in urine? A: Some biomarkers demonstrate remarkable stability. Urinary 11-dehydro-thromboxane-B2 and creatinine showed no significant degradation after storage at -40°C for up to 10 years. In contrast, urinary 8-iso-prostaglandin F2α, a marker of lipid peroxidation, can increase significantly after multiple freeze-thaw cycles due to ex vivo oxidation, unless protected by an antioxidant [48].
Q5: Does the choice of anticoagulant matter for ORP measurements? A: Yes. Heparin is the recommended anticoagulant for ORP measurement as it provides a more sensitive baseline ORP reading compared to citrate. However, this anticoagulant-dependent effect may disappear in samples with exogenously elevated ORP [46].
Summarized Quantitative Data on Analyte Stability
Table 1: Effect of Multiple Freeze-Thaw Cycles on Clinical Chemistry Analytes (Stored at -20°C) [49] Summary of data from 15 patient sera aliquots subjected to up to 10 freeze-thaw cycles. Changes were evaluated for clinical significance according to desirable bias limits.
| Analyte Category | Analyte | Stability after 10 Freeze-Thaw Cycles |
|---|---|---|
| Enzymes | AST, ALT, CK, GGT | Stable |
| Lactate Dehydrogenase (LD) | Unstable (Significant Change) | |
| Metabolites | Glucose, Creatinine | Stable |
| Uric Acid, BUN, Calcium | Unstable (Significant Change) | |
| Lipids | Cholesterol, Triglycerides, HDL | Stable |
| Proteins | Total Protein, Albumin | Unstable (Significant Change) |
| Bilirubin | Direct Bilirubin | Stable |
| Total Bilirubin | Unstable (Significant Change) |
Table 2: Stability of Nutritional and NCD Biomarkers After a Single Freeze-Thaw Cycle (Stored at -70°C) [50] Data from 70 subjects. Stability was assessed based on whether the mean percentage change (bias) remained within the total allowable error (TEa) limits.
| Biomarker | Mean % Change (Bias) | Statistical Significance (p<0.05) | Clinically Acceptable (Within TEa) |
|---|---|---|---|
| Vitamin D | -12.51% | Yes | Yes |
| Cholesterol | +9.76% | Yes | Yes |
| HDL | +7.98% | Yes | Yes |
| CRP | +3.45% | Yes | Yes |
| Vitamin B12 | -3.74% | Yes | Yes |
| Glucose | +1.93% | Yes | Yes |
| sTfR | -5.49% | Yes | Yes |
| Triglycerides | +2.82% | No | Yes |
| Total Protein | +1.00% | No | Yes |
| Albumin | +0.87% | No | Yes |
| Creatinine | +0.94% | No | Yes |
| LDL | -0.67% | No | Yes |
| Ferritin | -0.58% | No | Yes |
Detailed Experimental Protocols
Protocol: Assessing Freeze-Thaw Impact on ORP
This protocol is optimized for researching redox homeostasis and is based on a study investigating ORP in human plasma [46].
Key Research Reagent Solutions:
- Heparin Tubes: For blood collection; provides a more sensitive baseline ORP measurement compared to citrate.
- RedoxSYS Diagnostic System: Includes the analyzer platform and disposable sensor strips (electrodes: working, counter, reference).
- Calibration Standards: For verifying analyzer specification (e.g., 100 ± 1 mV and 300 ± 4 mV standards).
Methodology:
- Sample Collection: Draw whole blood from consented healthy volunteers into heparin anticoagulant tubes.
- Plasma Separation: Centrifuge tubes at 590.3 g at 4°C for 10 minutes to separate plasma.
- Baseline Measurement (T0):
- Calibrate the ORP analyzer according to the manufacturer's instructions.
- Pipette 30 µL of fresh plasma onto the reservoir of a disposable sensor strip.
- Insert the strip into the reader to obtain the baseline ORP value (in mV).
- Aliquoting and Freezing: Aliquot the remaining plasma into smaller volumes (e.g., 100 µL) and store at -80°C for a predetermined period.
- Freeze-Thaw Analysis:
- Remove aliquots from -80°C storage and thaw completely at room temperature.
- Perform ORP measurement on the thawed samples using the same procedure as in step 3.
- Data Analysis: Compare the ORP values of the thawed samples to the baseline (T0) measurement to determine the percentage change or absolute difference.
Protocol: Evaluating Long-Term Storage and Freeze-Thaw Stability of Urinary Biomarkers
This protocol is adapted from a study on the stability of urinary eicosanoids over a decade [48].
Key Research Reagent Solutions:
- Antioxidant Solution: 4-hydroxy-2,2,6,6-tetramethylpiperidin-1-oxyl (10 mM) to prevent ex vivo oxidation.
- Chromatographic Columns: C18 and SiOH SPE columns (e.g., Bakerbond) for sample purification.
- Enzyme Immunoassay Kits: Validated ELISA kits for specific biomarkers (e.g., 11-dehydro-TxB2, 8-iso-PGF2α).
- Tritiated Tracer: (e.g., ³H-PGE2) for calculating extraction recovery.
Methodology:
- Sample Collection and Pretreatment: Collect human urine and centrifuge at 671 g for 5 min to remove precipitates. For antioxidant tests, add the chosen antioxidant to a subset of samples.
- Baseline Measurement (T0):
- Extraction: Add a tritiated tracer to 1 mL of urine supernatant for recovery calculation. Pass the sample through C18 and SiOH columns, elute, dry, and reconstitute in assay buffer.
- Analysis: Measure analyte concentration (e.g., via ELISA) and calculate recovery.
- Long-Term Storage: Store the remaining urine samples and/or extracts at -40°C or -80°C for the duration of the stability study (e.g., months to years).
- Freeze-Thaw Cycling: For a defined set of aliquots, subject them to repeated freeze-thaw cycles. After each cycle, analyze the samples as in step 2.
- Data Analysis: Calculate the concentration of the analyte at each time point or cycle. Express the data as a percentage of the baseline (T0) concentration. Use statistical tests (e.g., paired t-tests) to determine significance.
Workflow and Pathway Visualizations
ORP Measurement and Freeze-Thaw Impact Workflow
Redox Signaling and Oxidative Stress Pathway
The Scientist's Toolkit: Essential Research Reagents and Materials
Table 3: Key Reagents and Materials for Redox and Stability Studies
| Item | Function/Application | Example/Note |
|---|---|---|
| Heparin Anticoagulant Tubes | Blood collection for ORP measurement; provides superior baseline signal vs. citrate [46]. | Vacutainer systems. |
| RedoxSYS Diagnostic System | Measures Oxidation-Reduction Potential (ORP) in biological samples as a composite marker of oxidative stress [46]. | Aytu BioSciences. |
| Specific Antioxidants | Added to samples to prevent ex vivo oxidation during storage and freeze-thaw cycles [48]. | 4-hydroxy-2,2,6,6-tetramethylpiperidin-1-oxyl. |
| Validated Immunoassays | Quantifying specific biomarkers (e.g., eicosanoids, cytokines) after storage. Must be validated for use with frozen samples [48]. | ELISA for 11-dehydro-TxB2, 8-iso-PGF2α. |
| Solid-Phase Extraction (SPE) Columns | Purifying and concentrating analytes from complex matrices like urine before analysis [48]. | C18 and SiOH columns. |
| High-Resolution Mass Spectrometer (HR-MS) | For metabolic profiling (metabolomics); sensitive to sample degradation from freeze-thaw cycles [47]. | Requires strict sample handling protocols. |
| Temperature-Monitored Freezers | For stable, long-term storage of samples at specified temperatures (e.g., -40°C, -70°C, -80°C) [48]. | Critical for preserving sample integrity. |
| Gacyclidine | Gacyclidine (GK-11) | Gacyclidine is a high-affinity, non-competitive NMDA receptor antagonist for neuroscience research. For Research Use Only. Not for human use. |
Frequently Asked Questions (FAQs)
FAQ 1: Why is methodological calibration important in redox measurements? Calibration with exogenous oxidants and reductants is crucial for minimizing oxidative damage during research because it establishes a controlled baseline. This process helps account for and mitigate background oxidative stress introduced by the experimental system itself, ensuring that the measurements you collect accurately reflect biological processes rather than methodological artifacts. A properly calibrated system is fundamental for obtaining reliable and reproducible data on redox balance [51].
FAQ 2: My redox titration endpoint is unclear. What could be going wrong? An unclear endpoint can stem from several issues. The concentration of your titrant might be incorrect, or the reaction kinetics may be too slow. The sample itself could contain interfering substances, or the indicator (if used) may not be appropriate for your specific analyte or pH range. Using a potentiometer to track the reaction potential instead of relying on a visual cue can often resolve this problem [52] [53].
FAQ 3: How can I prevent the introduction of oxidative stress during sample preparation? To prevent introducing oxidative stress, work quickly and at lower temperatures to slow down oxidative processes. Use buffers that contain chelating agents (e.g., EDTA) to sequester metal ions like Fe²⺠that can catalyze Fenton reactions, a significant source of highly reactive hydroxyl radicals. Ensure all solutions are prepared with deoxygenated solvents and store samples appropriately under inert gas if necessary [54] [55].
FAQ 4: What is the best way to handle and store sensitive redox reagents? Many redox reagents are light-sensitive and prone to oxidation by ambient air. Store them according to manufacturer specifications, often in dark bottles under inert atmospheres or in a freezer. Always prepare fresh solutions when possible and avoid repeated freeze-thaw cycles. For example, potassium permanganate solutions should be stored in dark bottles to prevent light-induced decomposition [53] [56].
FAQ 5: My positive control is not producing the expected level of oxidative damage. What should I check? First, verify the concentration and activity of your exogenous oxidant (e.g., hydrogen peroxide, tert-butyl hydroperoxide). Prepare a fresh stock solution and confirm its concentration spectrophotometrically if possible. Check that the exposure time and temperature for your positive control are sufficient to induce a measurable response. Ensure your detection method (e.g., fluorescent probe, antibody) is functioning correctly with a known standard [51].
Troubleshooting Guide
Table 1: Common Experimental Issues and Solutions
| Problem | Possible Cause | Solution |
|---|---|---|
| High Background Signal | Contaminated labware or reagents with oxidizing agents; impure solvents. | Use high-purity reagents, thoroughly clean glassware, and include a no-analyte control to assess background [51]. |
| Low Signal from Analyte | Analyte degradation due to oxidative damage during storage or processing; incorrect pH for reaction. | Optimize sample lysis and storage conditions (e.g., add antioxidants if they don't interfere, use chelating agents); verify optimal reaction pH [54] [55]. |
| Irreproducible Results | Inconsistent sample handling leading to variable oxidative stress; inaccurate titrant concentration. | Standardize every step of the protocol (time, temperature, pipetting); regularly re-standardize titrant solutions [52] [56]. |
| Poor Recovery of Spiked Analyte | The analyte is being lost or modified by the sample matrix or procedure. | Add internal standards to correct for losses; validate the entire sample preparation method for your specific analyte [51]. |
Table 2: Troubleshooting Oxidant/Reductant Solutions
| Reagent Issue | Impact on Experiment | Corrective Action |
|---|---|---|
| Decomposed Titrant (e.g., KMnOâ‚„) | Erroneous concentration calculations, leading to incorrect analyte values. | Standardize titrant solution frequently against a primary standard (e.g., sodium oxalate for KMnOâ‚„) [53] [56]. |
| Volatile Reductants | Changing concentration over time, causing drift in calibration curves. | Prepare small, fresh volumes more frequently; ensure tight sealing of storage containers. |
| Metal Contamination | Catalyzes non-specific oxidation (via Fenton reaction), damaging your analyte and increasing background. | Use ultra-pure water and reagents; include metal chelators (e.g., EDTA, DTPA) in buffers where compatible [54] [55]. |
The Scientist's Toolkit: Research Reagent Solutions
Table 3: Essential Reagents for Redox Titration and Calibration
| Item | Function | Key Considerations |
|---|---|---|
| Potassium Permanganate (KMnOâ‚„) | A strong oxidizing titrant used to determine the concentration of reducing agents. | Self-indicating (colorless to pink); requires frequent re-standardization and acidic conditions [53] [56]. |
| Oxalic Acid (Hâ‚‚Câ‚‚Oâ‚„) | A primary standard reducing agent used to standardize oxidizing titrants like KMnOâ‚„. | Provides a known, precise concentration for accurate calibration of oxidant solutions [56]. |
| Potassium Dichromate (K₂Cr₂O₇) | A strong oxidizing agent often used in the quantification of iron and other analytes. | Highly stable and can be used as a primary standard, but requires a separate redox indicator [52]. |
| Diphenylamine | A redox indicator that changes from colorless to blue/violet at the endpoint. | Useful for titrations where the titrant is not self-indicating, such as with dichromate titrations [52]. |
| Metal Chelators (e.g., EDTA) | Binds free metal ions (Fe²âº, Cuâº) to prevent catalytic Fenton reactions and minimize artificial oxidative damage. | Critical for maintaining sample integrity in buffers and storage solutions [54] [55]. |
| Fluorogenic Probes (e.g., DCFDA, DHE) | Used for direct or indirect measurement of ROS (Hâ‚‚Oâ‚‚, Oâ‚‚â») in cellular or biochemical assays. | DCFDA is sensitive to a broad range of ROS; DHE is more specific for superoxide. Select based on the ROS of interest [51]. |
Experimental Workflows and Signaling Pathways
Redox Titration Calibration Workflow
Key Redox Signaling Pathways in Stress
Oxidative Damage Measurement Pathways
Adopting a Multi-Assay Approach to Cross-Validate Findings and Minimize Artifacts
Reactive oxygen species (ROS) and redox signaling are integral to both normal physiology and the pathogenesis of various diseases. However, the field of redox biology has been hampered by the challenges inherent in measuring these highly reactive and transient molecules. Reliance on single, commercially available assays often leads to misleading claims entering the literature, impeding scientific progress. A well-established body of knowledge confirms that the complex and dynamic nature of ROS production and antioxidant reactions necessitates a multi-faceted evaluation strategy. This guide provides troubleshooting and best practices for implementing a multi-assay approach to ensure accurate, reliable, and physiologically relevant redox measurements.
Frequently Asked Questions (FAQs)
Why is a single assay insufficient for measuring "oxidative stress"?
A: Oxidative stress is not a single entity but a complex imbalance involving various reactive species with different reactivities, lifetimes, and molecular targets. Using a single assay is insufficient for several reasons [57] [58]:
- Diverse ROS Chemistries: The term "ROS" encompasses species from the highly selective superoxide (O₂•â») and hydrogen peroxide (Hâ‚‚Oâ‚‚) to the indiscriminately reactive hydroxyl radical (•OH). A probe specific for Hâ‚‚Oâ‚‚ will not detect O₂•⻠[57].
- Compartmentalization: ROS production and signaling are localized within specific subcellular organelles (e.g., mitochondria, peroxisomes). A single, whole-cell assay lacks the spatial resolution to capture these critical dynamics [59] [58].
- Dynamic Equilibrium: Oxidative stress reflects a disruption in the balance between pro-oxidants and antioxidants. A single assay cannot simultaneously capture real-time ROS generation, the extent of accumulated biomolecular damage, and the capacity of the antioxidant defense system [58].
What are the main categories of assays I should combine?
A: A comprehensive assessment requires integrating methods from at least three different categories [58]:
- Direct ROS Measurement: Techniques like electron spin resonance (ESR) or fluorescent probes that attempt to detect reactive species directly. These are often limited by the short lifespan of ROS and can be prone to artifacts [59] [58].
- Markers of Oxidative Damage: Indirect but more stable measurements of the consequences of ROS. This includes quantifying lipid peroxidation (e.g., malondialdehyde, MDA), protein oxidation (e.g., protein carbonyls), and DNA damage (e.g., 8-hydroxydeoxyguanosine, 8-OHdG) [58].
- Antioxidant Status Assessment: Evaluating the defense system by measuring the activity of key enzymes like superoxide dismutase (SOD), catalase, and glutathione peroxidase (GPx), or the levels of low-molecular-weight antioxidants like glutathione (GSH/GSSG ratio) [60] [58].
How can I validate my findings when different assays give seemingly conflicting results?
A: Apparent conflicts can often be resolved by understanding the specific biological context each assay captures.
- Temporal Disconnect: A spike in Hâ‚‚Oâ‚‚ (a direct, transient signal) may have normalized by the time a sample is taken for protein carbonyl analysis (a stable, cumulative damage marker). This isn't a conflict but a reflection of different time scales [58].
- Spatial Specificity: A genetically encoded sensor in the mitochondrial matrix might report a reducing environment, while a lipid peroxidation assay on whole-cell lysates indicates oxidative damage in the membranes. This highlights compartment-specific redox states [59].
- Troubleshooting Action: If results are conflicting, use a third, orthogonal assay (an assay based on a different physical or chemical principle) to cross-verify. For example, if a fluorescent dye indicates a large increase in ROS but no corresponding increase in oxidative damage markers is found, the dye signal may be an artifact. Switching to a genetically encoded sensor or an ESR-based method can help clarify [57] [59].
What are common artifacts in ROS detection and how can I avoid them?
A: Common artifacts and their solutions include [57]:
- Probe Autoxidation: Many chemical fluorescent probes (e.g., DCFH-DA) can oxidize independently of ROS in the presence of light, cellular peroxidases, or heme proteins, leading to false positives.
- Solution: Include rigorous controls (e.g., no-cell, inhibitor-treated) and consider using genetically encoded sensors like roGFP or HyPer, which are more specific and provide ratiometric measurement [59].
- Interference from Antioxidants: The presence of endogenous antioxidants in cell extracts can interfere with acellular assays like the DTT assay.
- Solution: Characterize and control for the major antioxidants in your system. Use standard addition methods to account for matrix effects [5].
- Sample Preparation Artifacts: Exposure to ambient oxygen during sample preparation can rapidly oxidize labile species, altering the true redox state.
- Solution: Use anaerobic chambers or rapid-freezing techniques for sensitive samples, and minimize the time between sample collection and analysis [57].
Troubleshooting Guides
Problem: Inconsistent Results from Kinetic Oxidative Potential (OP) Assays
Background: Assays like the dithiothreitol (DTT) and ascorbic acid (AA) assays are used to measure the oxidative potential of environmental samples like particulate matter. Inconsistencies often arise not from the biology but from the data calculation method [5].
Symptoms:
- High variability in OP values between replicate samples.
- Poor correlation between OP values and known sample toxicity.
- Inability to reproduce published results from other labs.
Diagnosis and Resolution:
- Identify the Calculation Method: Determine which mathematical approach you are using to derive the OP value from the raw kinetic data. Common methods include [5]:
- ABS: Uses direct absorbance values.
- CC1/CC2: Uses calculated concentrations from absorbance.
- CURVE: Uses an external calibration curve.
- Compare Methods: A comparative study has shown that these methods yield systematically different results. The table below summarizes the findings [5]:
| Calculation Method | Description | Typical Variation (vs. ABS/CC2) | Recommended Practice |
|---|---|---|---|
| ABS | Uses raw absorbance values from the kinetic readout. | Baseline (0%) | Recommended for better consistency |
| CC2 | A concentration-based method. | ~0% variation | Recommended for better consistency |
| CC1 | A different concentration-based method. | +12% to +18% | Use with caution; can overestimate |
| CURVE | Relies on an external calibration curve. | +10% to +19% | Use with caution; can overestimate |
- Action: Standardize your lab's protocol to use either the ABS or CC2 method for calculating OPDTT and OPAA, as they show the best consistency across different sample types. Always explicitly report the calculation method used in publications [5].
Problem: Lack of Physiological Relevance in 2D Cell Culture Models
Background: Many redox studies are performed in traditional 2D cell cultures, which often fail to replicate the physiological conditions of in vivo tissues, leading to misleading conclusions [61].
Symptoms:
- Cells in 2D culture accumulate abnormally high levels of ROS upon challenge.
- Antioxidant treatments show efficacy in 2D models but fail in more complex models or in vivo.
- Difficulty in translating findings from cell lines to animal models or human physiology.
Diagnosis and Resolution:
- Implement Advanced Models: Transition to more physiologically relevant models such as 3D organoids or organs-on-chips. These models better mimic the tissue architecture, cell-cell interactions, and metabolic gradients found in vivo [61].
- Adopt Multiplexed Assays: Use a multiplexed assay that can simultaneously quantify intracellular ROS and cell viability within the same sample in the complex model. This controls for cell number and health, providing a more accurate picture [61].
- Re-evaluate Scavenging Capacity: Be aware that physiologically relevant models may be more prone to scavenge ROS rather than accumulate them, which is a more accurate representation of in vivo tissue responses. Your assay must be sensitive enough to detect this [61].
Problem: Inability to Measure Dynamic, Compartment-Specific Redox Changes
Background: Redox processes are highly dynamic and localized within specific subcellular compartments. Bulk cell lysate measurements average out these critical fluctuations [59].
Symptoms:
- A lack of signal or a weak signal when a robust redox response is expected.
- Inability to correlate a redox event with a specific cellular outcome (e.g., mitochondrial ROS and apoptosis).
Diagnosis and Resolution:
- Employ Genetically Encoded Redox Biosensors (GEFIs): Utilize sensors like roGFP (for glutathione redox potential) or HyPer (for Hâ‚‚Oâ‚‚). These can be genetically targeted to specific organelles (e.g., mitochondria, endoplasmic reticulum) [59].
- Perform Live-Cell Imaging: Conduct real-time, ratiometric imaging in live cells or organisms. This allows you to track rapid redox changes as they happen, rather than at a single endpoint [59].
- Utilize Transgenic Models: For in vivo work, use established transgenic organisms (e.g., zebrafish, C. elegans) that express redox biosensors in specific tissues. This allows for non-invasive, whole-organism redox monitoring with high spatial and temporal resolution [59] [62].
The Scientist's Toolkit: Key Research Reagent Solutions
The following table details essential tools and reagents for robust redox biology research.
| Item | Function & Application | Key Considerations |
|---|---|---|
| Genetically Encoded Sensors (e.g., roGFP, HyPer) | Real-time, ratiometric measurement of specific redox parameters (EGSH, Hâ‚‚Oâ‚‚) in live cells and in vivo. Can be targeted to subcellular compartments [59]. | Provides high spatial/temporal resolution. Requires genetic manipulation of the biological system. |
| DTT / AA Assay Kits | Acellular assays to measure the oxidative potential (OP) of environmental samples (e.g., particulate matter) by tracking the consumption of reductants [5]. | Be consistent with the calculation method (ABS or CC2 recommended). Results are sensitive to reactant concentrations and pH. |
| Electron Spin Resonance (ESR) | The gold-standard direct method for detecting and quantifying paramagnetic species (molecules with unpaired electrons) like free radicals [58]. | Highly specific but requires specialized equipment and expertise. Often used with spin traps to stabilize short-lived radicals. |
| Antibodies for Damage Markers | Immunoassays for stable, indirect markers of oxidative damage (e.g., protein carbonyls, 3-nitrotyrosine, 8-OHdG, 4-HNE) [58]. | Allows for histological localization and western blot analysis. Represents cumulative damage over time, not instantaneous ROS levels. |
| Ingestible Redox Sensor | A novel, miniaturized device that wirelessly measures oxidation-reduction potential (ORP) and pH throughout the entire human gastrointestinal tract in vivo [63]. | Enables direct, non-invasive redox profiling in the human gut, moving beyond fecal or blood-based biomarkers. |
Experimental Workflow for a Multi-Assay Approach
The following diagram illustrates a logical workflow for designing a robust redox biology study that cross-validates findings and minimizes artifacts.
Redox Signaling and Antioxidant Defense Pathway
This diagram outlines the core pathways of ROS generation, signaling, and antioxidant defense, highlighting key targets for measurement.
Establishing Rigorous Validation and Comparative Analysis Frameworks
Correlating Direct ROS Detection with Downstream Biomarkers of Oxidative Damage
In redox biology research, a critical challenge is effectively linking the direct detection of short-lived Reactive Oxygen Species (ROS) with the measurement of stable, downstream biomarkers of oxidative damage. This connection is fundamental to understanding the complete picture of oxidative stress, from its initiation to its functional consequences. A precise approach minimizes experimental artifacts and misinterpretation, which is essential for research aimed at developing therapeutic interventions to minimize oxidative damage. This guide provides troubleshooting advice and methodologies to help researchers robustly correlate these two key aspects of redox biology.
Frequently Asked Questions (FAQs) and Troubleshooting Guides
FAQ 1: Why do my direct ROS measurements (e.g., with fluorescent probes) not correlate with downstream markers of oxidative damage?
This is a common issue often stemming from the misuse or misinterpretation of fluorescent probes.
- Problem: Lack of correlation between fluorescent signal and damage markers.
- Underlying Cause:
- Probe Lack of Specificity: Many popular fluorescent probes are not specific to a single ROS. For example, Dichlorodihydrofluorescein diacetate (DCFH-DA) is oxidized by various one-electron oxidants and not directly by Hâ‚‚Oâ‚‚, and its oxidized product can itself generate ROS, leading to artifactual signal amplification [7].
- Improper Probe Validation: Using fluorescence microscopy or plate readers without validating the specific oxidation products can be misleading. Dihydroethidium (DHE), a common probe for superoxide (O₂•â»), forms two fluorescent products: 2-hydroxyethidium (2-OH-Eâº), which is specific to O₂•â», and ethidium, which is formed by non-specific oxidation. Their fluorescence spectra overlap, making simple fluorescence detection unreliable [7].
- Solution:
- Employ Specific Methodologies: For DHE, use HPLC to separate and quantify the specific product 2-OH-Eâº, providing a definitive measure of O₂•⻠production [7].
- Use Genetically Encoded Systems: For Hâ‚‚Oâ‚‚, consider using controlled expression systems like d-amino acid oxidase to generate Hâ‚‚Oâ‚‚ internally in a regulated manner [1].
- Select Specific Assays: For extracellular H₂O₂, the Amplex Red assay coupled with horseradish peroxidase is highly specific and sensitive, provided superoxide dismutase (SOD) is added to prevent interference from O₂•⻠[7].
FAQ 2: My experiment shows increased oxidative damage, but my antioxidant treatment (e.g., N-acetylcysteine) had no effect. Why?
- Problem: Antioxidant intervention fails to reduce measured oxidative damage.
- Underlying Cause:
- Incorrect Antioxidant Choice: The term "antioxidant" is often used generically. Different antioxidants have specific reactivities. N-acetylcysteine (NAC) is a poor scavenger of Hâ‚‚Oâ‚‚ and exerts many of its effects by increasing cellular cysteine pools and glutathione levels, or through other mechanisms like cleaving disulphides [1].
- Wrong Target ROS: The antioxidant used may not effectively scavenge the specific ROS causing the damage. For instance, so-called "•OH scavengers" are unlikely to compete effectively with biomolecules for the extremely reactive hydroxyl radical [1].
- Solution:
- Match the Antioxidant to the ROS: Ensure the chemical reactivity, rate constant, and cellular location of the antioxidant make it plausible for targeting the specific ROS you are studying. Use a combination of specific inhibitors (e.g., for NOX enzymes) and genetic knockdowns to verify the source [1] [64].
- Confirm Antioxidant Activity: Always confirm the efficacy of your antioxidant by measuring a decrease in a specific oxidative damage biomarker relevant to your model [1].
FAQ 3: How can I be sure that a specific ROS is responsible for the oxidative damage I observe?
- Problem: Attributing observed damage to a specific ROS.
- Underlying Cause: Multiple ROS can cause similar types of damage, and their generation is often interconnected.
- Solution:
- Use Selective ROS Generators: Utilize compounds that selectively generate specific ROS. Paraquat (PQ) or MitoPQ can be used to generate O₂•⻠(and subsequently H₂O₂), while glucose oxidase or a genetically encoded d-amino acid oxidase system can generate H₂O₂ directly [1].
- Inhibit Specific Enzymatic Sources: Use specific inhibitors or genetic deletion of enzymes like NADPH oxidases (NOX) rather than non-specific inhibitors like apocynin or diphenyleneiodonium [1].
- Measure Multiple, Specific Damage Markers: Different ROS have different reactivities and may leave distinct "footprints." Correlate the presence of a specific ROS with a biomarker whose formation is chemically plausible from that ROS (e.g., hydroxyl radical with almost any biomolecule damage, peroxynitrite with protein nitration) [1] [65].
Experimental Protocols for Robust Correlation
Protocol for Specific Superoxide (O₂•â») Detection and DNA Damage Correlation
This protocol uses HPLC to ensure specific O₂•⻠detection and correlates it with a well-established DNA damage marker.
- Objective: Quantitatively correlate intracellular O₂•⻠levels with oxidative DNA damage.
- Materials:
- Dihydroethidium (DHE)
- HPLC system with fluorescence detector
- Specific ELISA kit or HPLC-MS/MS for 8-hydroxy-2'-deoxyguanosine (8-OHdG)
- Cell culture or tissue samples
- Methodology:
- Treat samples according to your experimental design.
- Incubate with DHE: Load samples with DHE (typically 5-50 µM) for 30 minutes at 37°C.
- Cell Lysis and Extraction: Lyse cells and extract the nucleic acids.
- HPLC Analysis for 2-OH-Eâº: Inject the lysate into the HPLC. Use a C-18 reverse-phase column with a mobile phase of methanol and water. Detect 2-OH-E⺠(specific for O₂•â») with fluorescence detection (Ex/Em: 510/595 nm) and ethidium (non-specific) at (Ex/Em: 510/595 nm) [7].
- DNA Digestion and 8-OHdG Measurement: Digest DNA to deoxynucleosides. Quantify 8-OHdG using a specific ELISA or, for higher accuracy, by HPLC with electrochemical or mass spectrometry detection (HPLC-ECD or HPLC-MS/MS) [66] [64].
- Data Correlation: Statistically correlate the quantified levels of 2-OH-E⺠from step 4 with the levels of 8-OHdG from step 5.
Protocol for Specific Hydrogen Peroxide (Hâ‚‚Oâ‚‚) Detection and Lipid Peroxidation Correlation
This protocol uses a validated enzymatic assay for extracellular Hâ‚‚Oâ‚‚ and a gold-standard method for lipid peroxidation.
- Objective: Measure Hâ‚‚Oâ‚‚ release from cells and correlate with systemic lipid peroxidation.
- Materials:
- Amplex Red reagent kit
- Horseradish Peroxidase (HRP)
- Superoxide Dismutase (SOD)
- Microplate reader
- Mass spectrometry system (GC-MS or LC-MS/MS) for Fâ‚‚-isoprostanes
- Methodology:
- Sample Treatment: Treat cells in a suitable buffer.
- Amplex Red Assay: Incubate the cell supernatant with Amplex Red (50 µM) and HRP (0.1 U/mL) in the presence of SOD (50 U/mL) to eliminate O₂•⻠interference. Measure fluorescence/absorbance (Ex/Em: 530/590 nm) over time [7].
- Quantify Lipid Peroxidation: From plasma or tissue samples, extract lipids. Hydrolyze and quantify Fâ‚‚-isoprostanes using gas chromatography or liquid chromatography with tandem mass spectrometry (GC-MS or LC-MS/MS). This method is considered more accurate and reliable than the traditional TBARS assay for malondialdehyde (MDA) [64].
- Data Correlation: Correlate the rate of Hâ‚‚Oâ‚‚ generation (from step 2) with the concentration of Fâ‚‚-isoprostanes (from step 3).
Data Presentation: Biomarkers and Detection Methods
Table 1: Common Downstream Biomarkers of Oxidative Damage and Their Detection Methods
| Biomarker Category | Specific Biomarker | Detection Methods | Key Considerations |
|---|---|---|---|
| Lipid Peroxidation | Fâ‚‚-Isoprostanes | GC-MS, LC-MS/MS | Gold standard, specific and stable [64] |
| Malondialdehyde (MDA) | TBARS Assay, HPLC | TBARS is inexpensive but lacks specificity; HPLC is better [66] [67] | |
| DNA Oxidation | 8-OHdG | ELISA, HPLC-ECD, HPLC-MS/MS | HPLC-based methods offer higher sensitivity and specificity than ELISA [66] [64] |
| Protein Oxidation | Protein Carbonyls | DNPH derivatization + spectrophotometry/immunoblotting/ELISA | Widely used reliable marker of protein oxidation [64] [67] |
| Oxidized Protein | Oxidized Albumin (Cys34) | HPLC, ELISA, Electrochemical sensors | Sensitive marker of systemic oxidative stress, relevant in kidney disease [66] |
Table 2: Methods for Direct ROS Detection and Their Specificity
| Target ROS | Detection Method / Reagent | Specificity & Key Troubleshooting Tips |
|---|---|---|
| Superoxide (O₂•â») | Dihydroethidium (DHE) with HPLC | Specific for O₂•⻠only when using HPLC to quantify 2-OH-Eâº. Simple fluorescence is not specific [7]. |
| MitoSOX with HPLC | Mitochondria-targeted DHE analog. Same specificity rules as DHE apply; requires HPLC validation [7]. | |
| Hydrogen Peroxide (H₂O₂) | Amplex Red + HRP | Highly specific for extracellular H₂O₂. Always add SOD to the assay to prevent O₂•⻠interference [7]. |
| Genetically encoded d-amino acid oxidase | Allows controlled, internal generation of Hâ‚‚Oâ‚‚ for mechanistic studies [1]. | |
| Peroxynitrite (ONOOâ») | Dihydrorhodamine (DHR) | Not specific; also oxidized by HOCl and other one-electron oxidants. Use with caution and corroborate with other data [7]. |
Visualization of Workflows and Relationships
Experimental Workflow for Correlative Redox Analysis
This diagram outlines a robust experimental strategy for linking ROS detection with damage biomarkers.
Relationship Between ROS, Damage Biomarkers, and Disease
This chart illustrates the pathological cascade from specific ROS production to measurable oxidative damage and disease outcomes.
The Scientist's Toolkit: Key Research Reagent Solutions
Table 3: Essential Reagents for Redox Correlation Studies
| Reagent / Tool | Function | Specific Example & Consideration |
|---|---|---|
| Selective ROS Generators | To induce specific ROS and establish causality. | MitoPQ: Generates O₂•⻠within mitochondria [1]. d-Amino Acid Oxidase (DAAO): Genetically encoded system for controlled intracellular H₂O₂ production [1]. |
| Targeted Antioxidants | To scavenge specific ROS in specific compartments. | MitoTEMPO: Mitochondria-targeted SOD mimetic [1]. PEG-Catalase: Extracellular catalase to breakdown Hâ‚‚Oâ‚‚. |
| Specific Enzyme Inhibitors | To inhibit enzymatic sources of ROS. | NOX Isoform-specific inhibitors: Prefer over non-specific inhibitors like apocynin [1] [64]. |
| Validated Detection Probes | To accurately measure specific ROS. | Dihydroethidium (DHE) with HPLC: For specific O₂•⻠quantification [7]. Amplex Red + HRP + SOD: For specific extracellular H₂O₂ detection [7]. |
| Biomarker Assay Kits | To quantify stable oxidative damage products. | 8-OHdG ELISA: High-throughput but validate with a more specific method. Fâ‚‚-Isoprostanes by GC-MS/MS: Gold-standard for lipid peroxidation [64]. |
Benchmarking Against Gold-Standard Methods and Reference Materials
Frequently Asked Questions (FAQs)
1. What are the biggest challenges in measuring ROS and oxidative damage? The primary challenges include the transient nature and low concentration of most ROS, the lack of specificity of many common probes and assays, and the potential for the measurement methods themselves to perturb the delicate redox balance of the system being studied [68] [1]. Accurately interpreting results requires an understanding of the specific ROS involved, as they have vastly different reactivities, lifespans, and biological targets [1].
2. Why is it problematic to use the generic term "ROS" in my research? "ROS" is an umbrella term for a diverse group of molecules with different properties [68]. Using the term generically can be misleading. For example, superoxide (O₂•â») and hydrogen peroxide (Hâ‚‚Oâ‚‚) have limited reactivity and specific biological roles, whereas the hydroxyl radical (•OH) is highly reactive and destructive [1]. Progress requires stating the actual chemical species involved and ensuring the observed biological effects are compatible with its known chemistry [1] [69].
3. My antioxidant treatment didn't work as expected. Why might that be? Many substances described as "antioxidants" have modes of action beyond direct ROS scavenging [68] [1]. For instance, N-acetylcysteine (NAC) can increase cellular glutathione levels and cleave protein disulfides, making it difficult to attribute its effects solely to ROS scavenging [1]. The effect of an antioxidant must be chemically plausible based on its specificity, reaction rate, and concentration at the relevant site within the cell [68] [1].
4. How can I be sure my ORP (Oxidation-Reduction Potential) measurements are accurate? ORP measurements are non-specific and can be influenced by many factors. To ensure accuracy:
- Calibrate regularly using a standard solution like Zobell's solution [70].
- Account for temperature, as it affects the voltage output [70].
- Clean the electrode thoroughly if contaminated with organics, hard water deposits, or biofilms using appropriate cleaning procedures [71] [70].
- Verify proper grounding and check for electrical continuity to prevent interference [71].
Troubleshooting Guides
Issue 1: Inconsistent or Erratic ORP Analyzer Readings
| Symptom | Possible Cause | Diagnosis & Solution |
|---|---|---|
| Fluctuating readings, values don't match expected conditions [71]. | Improper calibration; Sensor malfunction; Poor grounding [71]. | Check Calibration: Recalibrate with a fresh standard solution [71] [70]. Verify Grounding: Ensure the analyzer is properly grounded [71]. |
| Readings differ significantly between instruments in the same sample [70]. | Contaminated ORP electrode; Low concentration of redox-active species [70]. | Clean the Electrode: Follow a sequential cleaning protocol (mild detergent → chlorine bleach → dilute HCl for hard deposits) [70]. Assess Sample: ORP can be unreliable in "clean" water with few redox-active species [70]. |
| Slow response or lack of response [71]. | Clogged sensor or electrode frit; Software glitches [71]. | Clean/Replace Sensor: Clean debris or replace faulty sensors [71]. Check Software: Reset to factory settings or update software [71]. |
Issue 2: High Background Noise in Electrochemical Measurements
| Symptom | Possible Cause | Diagnosis & Solution |
|---|---|---|
| Excessive noise in the electrochemical signal [72]. | Poor electrical contacts; Lack of shielding [72]. | Check Connections: Polish or replace lead contacts to remove rust/tarnish [72]. Use a Faraday Cage: Place the electrochemical cell inside a Faraday cage to block external electromagnetic interference [72]. |
Issue 3: Cell Health Deteriorates During Redox Experiments
| Symptom | Possible Cause | Diagnosis & Solution |
|---|---|---|
| Increased cell death and elevated ROS in culture upon adding redox mediators [73]. | Cytotoxic effects from high concentrations of exogenous redox mediators [73]. | Optimize Mediator Concentration: Keep concentrations at or below 1 mM where possible. Higher concentrations (e.g., >1 mM) of common mediators like ferrocyanide/ferricyanide (FiFo) and ferrocene methanol (FcMeOH) can significantly increase ROS and reduce cell viability [73]. |
| Impaired cell migration and growth [73]. | Stress from redox-active compounds disrupting normal cellular functions [73]. | Shorten Exposure Time and Assess Multiple Health Parameters: Use viability (luminescence), ROS (flow cytometry), and functional assays (e.g., scratch tests) to holistically evaluate mediator impact [73]. |
The Scientist's Toolkit: Key Research Reagent Solutions
| Item | Function & Application | Key Considerations |
|---|---|---|
| Zobell's Solution | A standard solution for calibrating ORP (redox) electrodes, containing a known ratio of ferri-/ferrocyanide for a stable reference potential [70]. | Temperature-sensitive; use the correct mV value for your calibration temperature (e.g., 228 mV at 25°C, 241 mV at 15°C) [70]. |
| d-Amino Acid Oxidase (DAAO) | A genetically encoded system for controlled, site-specific generation of Hâ‚‚Oâ‚‚ within cells. Its flux can be regulated by adding different concentrations of its substrate, d-alanine [1]. | Superior to bolus addition of Hâ‚‚Oâ‚‚ as it mimics physiological, sustained production and can be targeted to organelles [1]. |
| MitoPQ | A mitochondria-targeted compound that generates superoxide (O₂•â») within the organelle, used to selectively induce mitochondrial oxidative stress [1]. | Useful for studying the role of mitochondrial ROS in signaling and pathology [1]. |
| Paraquat (PQ) | A redox-cycling compound that primarily generates superoxide (O₂•â») in the cytosol [1]. | A common tool to induce general cellular oxidative stress; note that its use will also lead to increased Hâ‚‚Oâ‚‚ via superoxide dismutation [1]. |
| CellROX Reagents | Fluorogenic probes used to quantify general oxidative stress in live cells via flow cytometry or fluorescence microscopy [73]. | They are indicators of general stress; specific ROS identification requires more specialized techniques [1]. |
| Luminescence-Based Viability Assays | Assays (e.g., RealTime-Glo) that use luciferase enzymes to monitor cell health, growth, and viability in real-time without lysing cells [73]. | Ideal for long-term tracking of cell health in response to treatments like redox mediator exposure [73]. |
Experimental Protocols for Redox Biology
Protocol 1: Guidelines for Measuring Reactive Oxygen Species (ROS) in Cells
This protocol outlines a rigorous approach to ROS detection, based on international consensus guidelines [1].
1. Principle: Avoid non-specific "ROS" assays. Instead, use methods that can identify specific ROS or employ strategies to infer the involvement of a particular ROS through selective generation or inhibition [1].
2. Materials:
- Cell culture
- ROS detection method (e.g., flow cytometer with appropriate fluorescent probes, EPR spectrometer)
- Reagents for selective ROS generation (e.g., Paraquat, MitoPQ, d-alanine for DAAO-expressing cells)
- Specific NOX inhibitors (if applicable)
3. Workflow:
- Step 1: Selective Generation. To implicate a specific ROS, use tools to generate it selectively in your model.
- Step 2: Specific Inhibition. Use genetically-encoded tools (e.g., siRNA, CRISPR knockout) for enzymes like NOX. If using pharmacological inhibitors, employ the most specific ones available and avoid non-specific agents like apocynin [1].
- Step 3: Measure Oxidative Damage. Correlate ROS measurements with specific markers of oxidative damage, such as:
Protocol 2: Flow Cytometry-Based ROS Quantification with Redox Mediators
This protocol is adapted from a study investigating the impact of redox mediators on cell health [73].
1. Principle: To quantify changes in general ROS levels in cell populations treated with various concentrations of electrochemical redox mediators.
2. Materials:
- Mammalian cell lines (e.g., HeLa, Panc1)
- Redox mediators (e.g., Ferrocyanide/Ferricyanide 1:1 mixture (FiFo), Ferrocene methanol (FcMeOH))
- CellROX Green Oxidative Stress Reagent
- Flow cytometer (e.g., BD LSRFortessa)
- Tissue culture plates and standard cell culture reagents
3. Procedure:
- Step 1: Cell Seeding and Treatment. Seed cells in 6-well plates and grow to 80-90% confluence. Treat cells with a range of mediator concentrations (e.g., 0.1 mM, 1 mM, 5 mM) for a set duration (e.g., 6 hours) [73].
- Step 2: Staining. After treatment, stain cells with CellROX Green reagent at a final concentration of 5 µM. Incubate for 30 minutes [73].
- Step 3: Cell Preparation. Rinse cells with DPBS, lift with trypsin, and centrifuge (2000 rpm for 8 minutes). Resuspend the cell pellet in 0.5% bovine serum albumin in PBS and keep on ice [73].
- Step 4: Flow Cytometry Analysis. Run samples on the flow cytometer. Use a gating strategy to first select live cells, then single cells, and finally, gate for cells emitting ROS-generated fluorescence in the FITC channel [73].
4. Data Analysis: Compare the median fluorescence intensity or the percentage of CellROX-positive cells between treatment groups and an untreated control. A concentration-dependent increase in fluorescence indicates mediator-induced oxidative stress [73].
Visualization of Workflows and Concepts
Redox Measurement Benchmarking Workflow
Experimental Planning for Oxidative Stress
Core Concepts and Compartmentalization
What does "redox compartmentalization" mean and why is it critical for my research?
Redox compartmentalization refers to the maintenance of distinct, kinetically controlled redox states within different subcellular compartments, such as the mitochondria, cytosol, and extracellular space. These compartments are not in redox equilibrium with each other but instead maintain unique steady-state redox potentials optimized for their specific functions [74]. This organization allows cells to poise specific protein cysteine residues ("sulfur switches") to function in localized redox signaling and control. Disruption of this delicate organization is a common basis for disease, making its accurate measurement essential [74].
What are the typical redox potential values I should expect in different compartments?
The table below summarizes the distinct redox environments of key cellular compartments, primarily based on measurements of the glutathione (GSH)/glutathione disulfide (GSSG) couple.
| Cellular Compartment | Typical Redox Potential (Eh, mV) | GSH:GSSG Ratio | Functional Significance |
|---|---|---|---|
| Mitochondrial Matrix | -250 to -280 mV (at pH 7.8) [75] | ~20:1 to 40:1 [75] | Reducing environment for energy metabolism; susceptible to oxidation under stress [74]. |
| Mitochondrial IMS | Considerably more oxidizing than matrix/cytosol [75] | N/A | Oxidizing environment supports protein import & disulfide bond formation; phylogenetically linked to bacterial periplasm [75]. |
| Cytosol | -289 mV [75] to -290 mV [74] (at pH 7.0) | ~3300:1 [75] | Highly reducing environment to protect cellular machinery. |
| Endoplasmic Reticulum | -170 to -185 mV (at pH 7.0) [75] | ~1:1 to 3:1 [75] | Oxidizing environment facilitates protein folding and disulfide bond formation. |
| Nucleus | Reducing [74] | N/A | Reducing environment relatively resistant to oxidation, protecting DNA from oxidant-induced mutation [74]. |
| Extracellular (Plasma) | Oxidized relative to intracellular compartments [74] | N/A | Measured Cys/CySS and GSH/GSSG couples are oxidized in association with conditions like diabetes [74]. |
This compartmentalization is visualized in the following diagram, which shows the relative redox potential across different cellular locations:
Troubleshooting Measurement Artifacts
Inconsistent measurements often stem from methodological artifacts. Key sources include:
- Electrode Artifacts with Redox Reagents: In electrophysiology, Ag/AgCl electrodes are susceptible to large voltage offsets when exposed to common redox reagents like dithiothreitol (DTT), glutathione, and H₂O₂. For example, 10 μM DTT can produce voltage offsets from 10 to 284 mV, depending on the electrode chloriding method [76]. These offsets can generate currents that mimic biological signals.
- Probe Misuse and Over-interpretation: Commercial probes like DCFDA and DHE are often misused. "ROS" is a generic term, and these probes have different reactivities with specific species [1]. Recommendation: Always state the specific chemical species (e.g., Hâ‚‚Oâ‚‚, O₂•â») you are investigating and ensure the probe's reactivity and the observed effects are chemically plausible [1].
- Sample Processing Artifacts: Thiol oxidation can occur during cell lysis and fractionation, artificially oxidizing your samples. Use appropriate extraction and processing procedures with rapid inhibition of metabolism to trap steady-state concentrations [74].
How can I prevent electrode-related artifacts in my redox experiments?
To minimize artifacts in electrophysiological recordings:
- Use Agar Bridges: Separate your measurement electrode from the experimental solution with an agar bridge (3 M NaCl, 3% agar) to prevent direct contact with redox-active reagents [76].
- Standardize Chloriding: Freshly chloride electrodes before each use. Be aware that chemically chlorided (hypochlorite-treated) and electrolytically chlorided electrodes may exhibit different sensitivities to redox reagents [76].
- Verify Electrode Purity: Use high-purity (99.9% or 99.99%) silver wire to minimize offsets [76].
Why did my antioxidant intervention fail to show the expected effect?
The term "antioxidant" is often used imprecisely. Many substances described as antioxidants have other, more significant modes of action.
- Example - N-acetylcysteine (NAC): NAC is a widely used "antioxidant," but it has poor reactivity with Hâ‚‚Oâ‚‚. Its effects are often due to increasing the cellular cysteine pool (enhancing GSH synthesis), generating Hâ‚‚S, or directly cleaving protein disulphides [1].
- Recommendation: For any intervention, the specific chemical species targeted by the 'antioxidant' must be made explicit. The specificity, rate constant, location, and achievable concentration of the antioxidant within the cell must render an antioxidant effect chemically plausible [1].
Experimental Protocols & Best Practices
What are reliable methods for measuring redox states in specific compartments?
A combination of methods is needed to build a complete picture. The table below outlines key strategies.
| Method / Tool | Measured Analytes / Parameters | Key Consideration |
|---|---|---|
| HPLC | Small molecules (GSH, GSSG, Cys, CySS) [74] | Provides precise quantification of specific thiol-disulfide couples. Requires careful sample processing to avoid oxidation artifacts [74]. |
| Genetically Encoded Sensors (e.g., rxYFP, Grx1-roGFP2) | Compartment-specific GSH/GSSG redox potential [74] [75] | Allows dynamic, subcellular measurement in live cells. Must verify correct targeting and dynamic response [75]. |
| Redox Western Blotting / BIAM | Oxidation state of specific proteins (e.g., Trx, Prx) [74] | Useful for assessing the functional redox state of key signaling nodes. |
| Fluorogenic Probes (e.g., DCFDA, DHE) | General oxidant activity (Hâ‚‚Oâ‚‚, ROOâ») or superoxide [51] | Use with caution. Results can be misleading due to non-specificity, auto-oxidation, and interference with the redox state under investigation [1]. |
Can you provide a detailed protocol for using genetically encoded rxYFP sensors?
The following workflow, based on studies in yeast, can be adapted for other model systems to measure compartment-specific redox states [75].
Protocol Details:
- Step 1: Construct Targeting Plasmids. Target the rxYFP gene to your compartment of interest by fusion with appropriate localization sequences. For the mitochondrial matrix, use the targeting sequence from cytochrome oxidase subunit IV (COX4). For the intermembrane space (IMS), use the sequence from cytochrome b2 (Cyb2) [75].
- Step 2: Express in Model System. Transfert the plasmid into your model system (e.g., S. cerevisiae) and grow cells aerobically to mid-log phase in appropriate selective medium [75].
- Step 3: Validate Subcellular Targeting. Use subcellular fractionation (e.g., differential centrifugation followed by osmotic shock to separate IMS from mitoplasts). Treat fractions with proteinase K in the presence or absence of Triton X-100 to confirm correct localization and membrane integrity [75].
- Step 4: Treat Cells & Prepare Samples. To trap the in vivo redox state, treat cells with trichloroacetic acid (TCA) or directly lyse in non-reducing SDS-PAGE sample buffer without β-mercaptoethanol or DTT. To verify sensor dynamics, include control treatments with an exogenous oxidant (e.g., H₂O₂) and reductant (e.g., DTT) [75].
- Step 5: Analyze by Non-Reducing SDS-PAGE. The reduced and oxidized forms of rxYFP have different electrophoretic mobilities. Use immunoblotting with an anti-rxYFP or anti-GFP antibody to distinguish the bands [75].
- Step 6: Calculate Redox Potential (Eâ‚•). Quantify the band intensities to determine the ratio of oxidized to reduced rxYFP. This ratio can be used to calculate the GSH/GSSG redox potential (Eâ‚•) using the Nernst equation, as the sensor equilibrates with the glutathione pool via glutaredoxins [75].
How can I manipulate redox states in specific compartments to establish cause and effect?
To move from correlation to causation, use targeted genetic tools:
- To Generate O₂•⻠(Superoxide): Use redox-cycling compounds like paraquat (PQ) or MitoPQ (which targets mitochondria). Note that increased O₂•⻠will also increase H₂O₂ production via dismutation [1].
- To Generate Hâ‚‚Oâ‚‚ in a Controlled Manner: Use genetically expressed d-amino acid oxidase (DAAO) targeted to different cellular sites. The flux of Hâ‚‚Oâ‚‚ generation can be regulated by varying the concentration of its substrate, d-alanine [1].
- To Manipulate the Glutathione System: Use localization mutants of glutathione disulfide (GSSG) reductase. Expressing cytosolic or mitochondrial isoforms can selectively alter the redox state of the cytosol or matrix, confirming that these compartments are regulated independently [75].
The Scientist's Toolkit: Key Reagents & Materials
| Reagent / Material | Function / Explanation |
|---|---|
| D-amino Acid Oxidase (DAAO) | Genetically encoded system for controlled, localized generation of H₂O₂ without significant O₂•⻠production [1]. |
| MitoPQ | Mitochondria-targeted compound that generates O₂•⻠within the organelle, used to induce site-specific oxidative stress [1]. |
| rxYFP & roGFP2 Sensors | Genetically encoded fluorescent sensors that dynamically report the GSH/GSSG redox potential in specific compartments [74] [75]. |
| Glutaredoxin (Grx) | Enzyme that catalyzes thiol-disulfide exchange, critical for the equilibration of rxYFP with the GSH/GSSG pool [75]. |
| Agar Salt Bridge | Used in electrophysiology to separate Ag/AgCl electrodes from bath solutions containing redox reagents, preventing galvanic artifacts [76]. |
| Tris-(2-carboxyethyl)-phosphine (TCEP) | A reducing agent; can cause voltage offsets in Ag/AgCl electrodes [76]. |
| High-Purity Silver Wire (99.99%) | Used for fabricating electrophysiology electrodes; higher purity reduces susceptibility to redox artifacts [76]. |
FAQ 1: Why is reporting data in absolute values critical for cross-study comparisons in redox biology?
Reporting data in absolute values (e.g., molar concentrations, exact effect sizes with confidence intervals) is fundamental for meaningful cross-study comparisons for several key reasons [77] [78]:
- Enables Direct Comparison: Relative terms like "increased" or "decreased" are context-dependent. Absolute values, such as a specific concentration of malondialdehyde (MDA) in nM, allow other researchers to directly compare results from your study with those in the existing literature [77].
- Facilitates Meta-Analysis: Systematic reviews and meta-analyses, which pool data from multiple studies to draw stronger conclusions, rely on standardized, absolute data. Without them, synthesizing findings becomes difficult or impossible [78].
- Enhances Reproducibility: Providing absolute values with clear units makes it easier for other labs to replicate your experimental conditions and validate your findings, a cornerstone of scientific progress.
- Prevents Misinterpretation: Relying solely on relative changes within a single study can be misleading. A statistically significant "two-fold increase" from a very low baseline may be biologically irrelevant. Absolute values provide the necessary context to assess the real-world significance of the finding.
FAQ 2: What are the best practices for presenting numerical results to ensure they are useful for future comparative research?
Adhering to structured reporting guidelines ensures clarity and utility. The following table summarizes key elements to include in your results section.
Table 1: Checklist for Reporting Numerical Results
| Section | Recommendation | Example from Redox Research |
|---|---|---|
| Study Population | Report numbers of individuals at each stage of the study and reasons for non-participation [79]. | "Of 100 potentially eligible subjects, 85 were included in the analysis. Fifteen were excluded due to incomplete sample data." |
| Descriptive Data | Give characteristics of study participants and indicate the number of participants with missing data for each variable [79]. | "Study population characteristics (age, BMI) and information on exposures are presented in Table 1. MDA data was missing for 2 participants." |
| Outcome Data | Report numbers of outcome events or summary measures. For biomarker levels, provide mean/median values with standard deviation or interquartile range [79]. | "Mean plasma 8-OHdG levels were 4.5 ± 1.2 ng/mL in the treatment group versus 8.1 ± 2.0 ng/mL in the control group." |
| Main Results | Give unadjusted and confounder-adjusted estimates with their precision (e.g., 95% Confidence Intervals). Make clear which confounders were adjusted for [79] [78]. | "The adjusted difference in MDA levels was -3.5 µM (95% CI: -5.2 to -1.8)." |
FAQ 3: How can we accurately measure specific reactive oxygen species (ROS) and oxidative damage, rather than just 'ROS' in general?
The term "ROS" encompasses a wide range of species with different reactivities and biological roles. Treating it as a single entity is a major source of error [57] [80]. A multi-faceted approach is required [77] [2].
Table 2: Methods for Assessing ROS and Oxidative Damage
| Target | Method Category | Specific Assay/Technique | What It Measures | Key Consideration |
|---|---|---|---|---|
| Specific ROS | Direct / Semi-Direct | Electron Spin Resonance (ESR) [2] | Detects unpaired electrons in free radicals (e.g., O₂•â»). | Highly specific but technically demanding. |
| Fluorescent Probes (e.g., DCFH-DA, Amplex Red) [57] | Measures Hâ‚‚Oâ‚‚ or other specific oxidants. | Can be non-specific; requires careful controls. | ||
| Ingestible Redox Sensor [63] | Measures oxidation-reduction potential (ORP) in the human gut in real-time. | Provides direct, in vivo redox potential; a novel technological solution. | ||
| Oxidative Damage | Indirect (Fingerprinting) | Thiobarbituric Acid Reactive Substances (TBARS) [2] | Measures malondialdehyde (MDA), a by-product of lipid peroxidation. | Can overestimate MDA; more specific techniques (HPLC, GC-MS) are preferred. |
| Protein Carbonyl Content Assay [2] | Quantifies oxidized proteins, a marker of protein oxidation. | A common and reliable marker for protein damage. | ||
| 8-hydroxydeoxyguanosine (8-OHdG) Measurement [2] | A specific biomarker for oxidative DNA damage. | Often measured via ELISA or HPLC. | ||
| Antioxidant Defense | Activity / Capacity | Superoxide Dismutase (SOD) Activity Assay [2] | Measures activity of the enzyme that converts O₂•⻠to H₂O₂. | Assesses the functional status of a key enzymatic antioxidant. |
| Total Antioxidant Capacity (TAC) assays [2] | Measures the combined capacity of all antioxidants in a sample to neutralize a free radical. | Provides a global picture but misses individual antioxidant contributions. |
Comprehensive Redox Assessment Strategy
FAQ 4: What are common pitfalls when using commercial antioxidant or ROS detection kits, and how can we avoid them?
Commercial kits offer convenience but can be misapplied. Key pitfalls and solutions include [57] [80] [77]:
- Pitfall: Assuming Specificity. Many fluorescent probes (e.g., DCFH-DA) are marketed as "ROS" probes but react with various oxidants and can be influenced by cellular conditions like pH and enzyme activity, leading to non-specific signals.
- Solution: Do not treat the signal as a measure of general "ROS." Use the probe as an indicator of cellular oxidative activity and confirm findings with more specific methods or by measuring stable oxidative damage products [57].
- Pitfall: Misinterpreting "Total Antioxidant Capacity" (TAC). TAC assays give a global measure but do not reveal which specific antioxidants are responsible or their physiological relevance.
- Solution: Use TAC as a initial screening tool. Follow up with assays for specific antioxidants (e.g., vitamin E, glutathione) and key antioxidant enzymes (e.g., SOD, catalase) to gain mechanistic insight [2].
- Pitfall: Poor Sample Handling. ROS and oxidized products are reactive. Exposure to air, improper storage, or repeated freeze-thaw cycles can artifactually generate or degrade these molecules.
- Solution: Standardize sample collection, processing, and storage protocols. Process samples in a controlled environment (e.g., anaerobic chamber if necessary) and store them at appropriate temperatures without repeated thawing [77].
FAQ 5: How should we structure the methodology section to ensure our redox study can be accurately compared or included in a future meta-analysis?
A well-structured methods section is crucial for replication and comparison. Follow established guidelines like the STROBE statement for observational studies and provide detailed, unambiguous information [79].
Table 3: Essential Methodology Details for Redox Studies
| Category | Key Details to Report | Example |
|---|---|---|
| Study Design & Participants | Clearly state the study design (cohort, case-control, cross-sectional). Present key elements early. Give eligibility criteria and sources of participants [79] [81]. | "We conducted a case-control study. Cases were patients with diagnosed NAFLD; controls were healthy volunteers matched for age and sex." |
| Variables | Clearly define all outcomes, exposures, predictors, and potential confounders. Give diagnostic criteria [79]. | "Our primary outcome was oxidative DNA damage, defined as the plasma concentration of 8-OHdG (ng/mL), measured using a commercially available ELISA kit (cite vendor, catalog#)." |
| Data Sources & Measurement | For each variable, give sources of data and details of methods of assessment (measurement). If a commercial kit is used, state the vendor, catalog number, and any modifications to the protocol [79]. | "Plasma MDA was measured using a TBARS assay kit (Sigma-Aldrich, MAK085). Absorbance was read at 532 nm. Values were calculated against an MDA standard curve and expressed as µM." |
| Bias & Study Size | Describe any efforts to address potential sources of bias. Explain how the study size was arrived at (e.g., power calculation) [79]. | "To minimize batch effects, all samples from cases and controls were analyzed in a single, randomized assay run. A sample size of 50 per group was determined to provide 90% power to detect a 40% difference in mean 8-OHdG." |
| Statistical Methods | Describe all statistical methods, including those used to control for confounding. Explain how missing data were addressed [79]. | "Group differences in MDA were assessed by ANOVA, adjusting for age and smoking status. Missing data (<2%) were handled using complete-case analysis." |
Experimental Workflow for Cross-Study Comparability
The Scientist's Toolkit: Key Research Reagent Solutions
Table 4: Essential Materials for Redox Biology Research
| Item | Function / Application | Brief Explanation |
|---|---|---|
| Fluorescent Probes (e.g., DCFH-DA, MitoSOX Red) | Detection of general oxidative activity or specific ROS like mitochondrial superoxide in cells. | These cell-permeable compounds become fluorescent upon oxidation. Critical Note: They are indicators, not definitive proof of a specific ROS; use with controls and complementary methods [57] [80]. |
| ELISA Kits | Quantification of specific oxidative damage biomarkers (e.g., 8-OHdG, 3-Nitrotyrosine) in biological fluids. | Provide a high-throughput, sensitive means to measure stable end-products of oxidative damage. Always report the exact kit and protocol used [2]. |
| Antibodies for Western Blot | Detection of protein oxidation (e.g., anti-DNP for protein carbonyls) or expression of antioxidant enzymes. | Allow for the specific detection of modified proteins or antioxidant defense proteins within a complex sample. |
| Enzymatic Activity Assay Kits (e.g., for SOD, Catalase, GPx) | Functional assessment of the antioxidant enzyme defense system. | Measure the activity of key enzymes that directly neutralize ROS, providing insight into the cellular redox buffering capacity [2]. |
| Ingestible Redox Sensor | Direct, in vivo measurement of oxidation-reduction potential (ORP) in the human GI tract. | A novel device that moves beyond snapshots to provide real-time, dynamic profiles of the gut's redox environment [63]. |
Conclusion
Minimizing oxidative damage during redox measurements is not a single-step fix but requires a holistic and vigilant approach throughout the experimental pipeline. Success hinges on understanding the fundamental chemistry of ROS, selecting complementary methodologies, rigorously optimizing pre-analytical conditions, and implementing a robust validation framework. The future of reliable redox biology lies in moving away from single, unvalidated assays and toward integrated, multi-parametric strategies. For biomedical and clinical research, this rigorous approach is the foundation for discovering robust redox biomarkers, accurately evaluating the mechanisms of redox-active therapeutics, and ultimately translating these insights into effective treatments for diseases rooted in oxidative stress.
References
- 1. Guidelines for measuring reactive oxygen species and ... [https://www.nature.com/articles/s42255-022-00591-z]
- 2. The Importance of Multifaceted Approach for Accurate and ... [https://pmc.ncbi.nlm.nih.gov/articles/PMC12466452/]
- 3. Redox regulation: mechanisms, biology and therapeutic ... [https://www.nature.com/articles/s41392-024-02095-6]
- 4. Redox signaling and homeostasis [https://www.sciopen.com/article/10.26599/OSHM.2025.9610003]
- 5. A comparative study of methods for calculating the oxidative ... [https://pubs.rsc.org/en/content/articlehtml/2025/ea/d5ea00025d]
- 6. Reactive Oxygen Species (ROS) Detection Methods in ... [https://pmc.ncbi.nlm.nih.gov/articles/PMC6812658/]
- 7. Methods for Detection of Mitochondrial and Cellular ... [https://pmc.ncbi.nlm.nih.gov/articles/PMC3887411/]
- 8. Redox Homeostasis in Red Blood Cells: From Molecular ... [https://www.mdpi.com/1467-3045/47/8/655]
- 9. “Double-Edged Sword†Effect of Reactive Oxygen Species ... [https://pmc.ncbi.nlm.nih.gov/articles/PMC10669002/]
- 10. Reactive Oxygen Species: A Double-Edged Sword in the ... [https://www.mdpi.com/2073-4409/14/15/1207]
- 11. Oxidative Stress: Causes, Symptoms & Treatment [https://my.clevelandclinic.org/health/articles/oxidative-stress]
- 12. Oxidative Stress Detection | Thermo Fisher Scientific - US [https://www.thermofisher.com/us/en/home/life-science/cell-analysis/cell-viability-and-regulation/oxidative-stress.html]
- 13. Strategies for Reducing or Preventing the Generation of ... [https://pmc.ncbi.nlm.nih.gov/articles/PMC3236599/]
- 14. Redox potential measurement – how to avoid the most ... [https://en.jumo.pl/web/about-us/blog-pl/redox-measurement]
- 15. How to Troubleshoot Common Problems with an Industrial ... [https://www.boquinstrument.com/how-to-troubleshoot-common-problems-with-an-industrial-orp-meter-1.html]
- 16. Oxidative stress assays and oxidative stress markers [https://www.abcam.com/en-us/technical-resources/product-overview/oxidative-stress-assays-and-oxidative-stress-markers]
- 17. Experimental Guidelines for Studies Designed to ... [https://pmc.ncbi.nlm.nih.gov/articles/PMC2906137/]
- 18. Oxidative Stress: What Is It? Can It Be Measured? Where ... [https://pmc.ncbi.nlm.nih.gov/articles/PMC9329886/]
- 19. The Chemistry of Reactive Oxygen Species (ROS) Revisited [https://pmc.ncbi.nlm.nih.gov/articles/PMC8125527/]
- 20. Guidelines for measuring reactive oxygen species and oxidative ... [https://www.nature.com/articles/s42255-022-00591-z?error=cookies_not_supported&code=50fd741e-56c8-457d-adff-4249da362757]
- 21. Reactive oxygen species [https://en.wikipedia.org/wiki/Reactive_oxygen_species]
- 22. Editorial: The Role of Reactive Oxygen Species in ... [https://www.frontiersin.org/journals/chemistry/articles/10.3389/fchem.2021.642523/full]
- 23. Reactive oxygen species, toxicity, oxidative stress, and antioxidants... [https://link.springer.com/article/10.1007/s00204-023-03562-9]
- 24. function in ROS signaling and redox stress oxidative [https://pubmed.ncbi.nlm.nih.gov/24845678/]
- 25. Defining ROS in Biology and Medicine - PMC - PubMed Central [https://pmc.ncbi.nlm.nih.gov/articles/PMC5921829/]
- 26. Chemistry and biology of reactive oxygen species in signaling ... [https://pmc.ncbi.nlm.nih.gov/articles/PMC3390228/]
- 27. Challenges and Opportunities for Small-Molecule Fluorescent ... [https://pmc.ncbi.nlm.nih.gov/articles/PMC6056262/]
- 28. Chemical Probes for Redox Signaling and Oxidative Stress [https://pmc.ncbi.nlm.nih.gov/articles/PMC6391619/]
- 29. Article Detection and Imaging of Superoxide in Roots by an ... [https://www.sciencedirect.com/science/article/pii/S0006349511008873]
- 30. Assessment of oxidative stress and antioxidant property using ... [https://pmc.ncbi.nlm.nih.gov/articles/PMC3541412/]
- 31. Blood Catalase, Superoxide Dismutase, and Glutathione ... [https://pmc.ncbi.nlm.nih.gov/articles/PMC11857377/]
- 32. Biomarkers of Oxidative Stress and Antioxidant Defense [https://www.sciencedirect.com/science/article/abs/pii/S0731708521005884]
- 33. Evaluation of The Antioxidant Capacity of Food Products [https://www.mdpi.com/2227-9717/10/10/2031]
- 34. In vitro and in vivo assessment of the antioxidant potential ... [https://www.nature.com/articles/s41598-022-23050-x]
- 35. How ORP Meters Works — In One Simple Flow (2025) [https://www.linkedin.com/pulse/how-orp-meters-works-one-simple-flow-2025-trendmatrix-analytics-sh94f]
- 36. The Importance Of ORP In Wastewater Treatment [https://atlas-scientific.com/blog/orp-in-wastewater-treatment/?srsltid=AfmBOorvtyTrjBL5GYPxyFATm48wULqLnDNV-yLk8hpCCZEw8QAnoZkk]
- 37. Oxidative Stress: Harms and Benefits for Human Health [https://pmc.ncbi.nlm.nih.gov/articles/PMC5551541/]
- 38. Oxidative Stress Research Area [https://www.rndsystems.com/research-area/oxidative-stress]
- 39. Top 5 Mistakes to Avoid When Selecting a pH or ORP Sensor [https://iconprocon.com/blog-post/top-5-mistakes-to-avoid-when-selecting-a-ph-or-orp-sensor/]
- 40. Common Mistakes When Using ORP Meters and How to ... [https://www.boquinstrument.com/a-news-common-mistakes-when-using-orp-meters-and-how-to-avoid-them.html]
- 41. ORP Sensor Troubleshooting and FAQs [https://www.vernier.com/til/1437?srsltid=AfmBOop1IT9pb__MopbdrFYQb39gGKbJeuw8SfO5SXy7b2qpfgok6mTD]
- 42. Effect of Regional Citrate Anticoagulation vs Systemic Heparin ... [https://pmc.ncbi.nlm.nih.gov/articles/PMC7585036/]
- 43. Reduction of Heparin and Oxidative Potential by Means ... [https://www.intechopen.com/chapters/43095]
- 44. Redox Imbalance in Inflammation: The Interplay of Oxidative ... [https://pmc.ncbi.nlm.nih.gov/articles/PMC12189482/]
- 45. Measurement of Redox Biomarkers in the Whole Blood ... [https://pmc.ncbi.nlm.nih.gov/articles/PMC8869394/]
- 46. Optimization of a diagnostic platform for oxidation–reduction ... [https://pmc.ncbi.nlm.nih.gov/articles/PMC6748793/]
- 47. The Effect of Freeze/Thaw Cycles on Reproducibility of ... [https://www.mdpi.com/1420-3049/19/10/16373]
- 48. Effect of very long-term storage and multiple freeze and ... [https://www.nature.com/articles/s41598-024-55720-3]
- 49. The effect of storage time and freeze-thaw cycles on the ... [https://pmc.ncbi.nlm.nih.gov/articles/PMC3900085/]
- 50. The Effects of a Single Freeze-Thaw Cycle on ... [https://pmc.ncbi.nlm.nih.gov/articles/PMC8154350/]
- 51. Approaches and Methods to Measure Oxidative Stress in ... [https://pmc.ncbi.nlm.nih.gov/articles/PMC6434272/]
- 52. Redox Titration [https://chem.libretexts.org/Ancillary_Materials/Demos_Techniques_and_Experiments/General_Lab_Techniques/Titration/Redox_Titration]
- 53. Redox Titrations - Titration - MCAT Content [https://jackwestin.com/resources/mcat-content/titration/redox-titrations]
- 54. The Redox Revolution in Brain Medicine [https://www.mdpi.com/1422-0067/26/15/7498]
- 55. Oxidative stress: fundamentals and advances in ... [https://www.frontiersin.org/journals/chemistry/articles/10.3389/fchem.2024.1470458/full]
- 56. Redox Titration [https://www.geeksforgeeks.org/chemistry/redox-titration/]
- 57. Guidelines for measuring reactive oxygen species and ... [https://pmc.ncbi.nlm.nih.gov/articles/PMC9711940/]
- 58. The Importance of Multifaceted Approach for Accurate and ... [https://www.mdpi.com/2076-3921/14/9/1083]
- 59. In Vivo Imaging with Genetically Encoded Redox Biosensors [https://pmc.ncbi.nlm.nih.gov/articles/PMC7662651/]
- 60. Exploring the Interplay of Antioxidants, Inflammation, and ... [https://pmc.ncbi.nlm.nih.gov/articles/PMC12469104/]
- 61. A versatile multiplexed assay to quantify intracellular ROS ... [https://www.sciencedirect.com/science/article/pii/S2213231722002609]
- 62. New insights into organ-specific oxidative stress ... [https://www.sciencedirect.com/science/article/pii/S0160412019318367]
- 63. Measurements of redox balance along the gut using a ... [https://www.nature.com/articles/s41928-025-01411-4]
- 64. Linking oxidative stress biomarkers to disease progression ... [https://www.frontiersin.org/journals/molecular-biosciences/articles/10.3389/fmolb.2025.1611842/full]
- 65. Biomarkers and Mechanisms of Oxidative Stress—Last 20 ... [https://pmc.ncbi.nlm.nih.gov/articles/PMC8347360/]
- 66. Oxidative and Glycation Stress Biomarkers - PubMed Central [https://pmc.ncbi.nlm.nih.gov/articles/PMC12610123/]
- 67. Oxidative Stress Fundamentals [https://www.mdpi.com/2076-3417/15/18/10191]
- 68. A guide to reactive oxygen species in tumour hypoxia [https://pmc.ncbi.nlm.nih.gov/articles/PMC12591319/]
- 69. Ten “Cheat Codes†for Measuring Oxidative Stress in ... [https://www.mdpi.com/2076-3921/13/7/877]
- 70. Measuring ORP: Top Tips for the Best Data [https://www.ysi.com/ysi-blog/water-blogged-blog/2015/11/measuring-orp-top-tips-for-the-best-data?srsltid=AfmBOoqpxGX2IkSxWUSKwpvZOcA8ikC_Ui7w5qosssywsgsaQbXX12NY]
- 71. How to Troubleshoot ORP Analyzer Issues [https://www.boquinstrument.com/a-how-to-troubleshoot-orp-analyzer-issues.html]
- 72. Troubleshooting Electrochemical Cell [https://redox.me/blogs/good-measurement-practices/troubleshooting-electrochemical-cell]
- 73. The impact of common redox mediators on cellular health [https://pubs.rsc.org/zh-hans/content/articlehtml/2025/an/d5an00017c]
- 74. Redox compartmentalization and cellular stress - PMC [https://pmc.ncbi.nlm.nih.gov/articles/PMC3052693/]
- 75. The Redox Environment in the Mitochondrial ... [https://pmc.ncbi.nlm.nih.gov/articles/PMC2570890/]
- 76. Redox artifacts in electrophysiological recordings - PMC [https://pmc.ncbi.nlm.nih.gov/articles/PMC3625719/]
- 77. Measuring ROS and Oxidative Damage in Human Health [https://biomedres.us/fulltexts/BJSTR.MS.ID.007833.php]
- 78. the challenges of cross-study comparative research and ... [https://pmc.ncbi.nlm.nih.gov/articles/PMC9613735/]
- 79. The STROBE guidelines - PMC - PubMed Central - NIH [https://pmc.ncbi.nlm.nih.gov/articles/PMC6398292/]
- 80. Guidelines for measuring reactive oxygen species ... - PubMed [https://pubmed.ncbi.nlm.nih.gov/35760871/]
- 81. Guidance for reporting a cross sectional study [https://www.goodreports.org/reporting-checklists/strobe-cross-sectional/info/]